Filter and Colour Your Salesforce Records: A Step-by-Step Guide
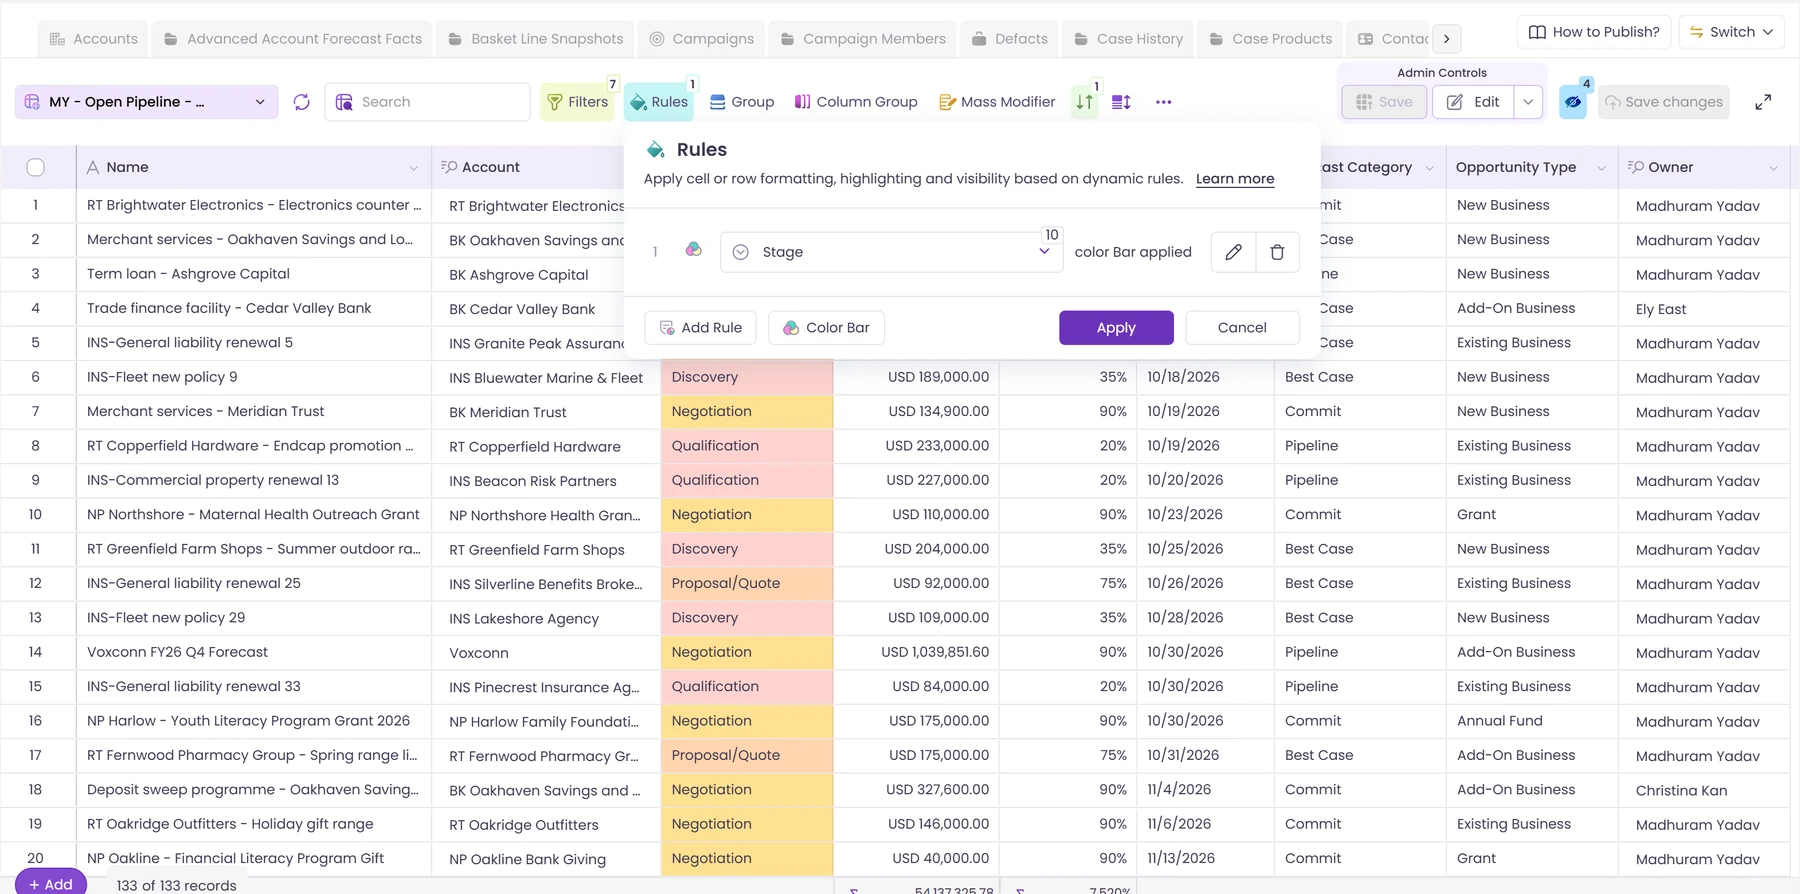
A list of 6,000 accounts isn't something you can work. A list of your key US accounts, with the at-risk ones shaded, is. This guide gets you from the first to the second in two panels: Filters and Rules.
Part 1: Filters
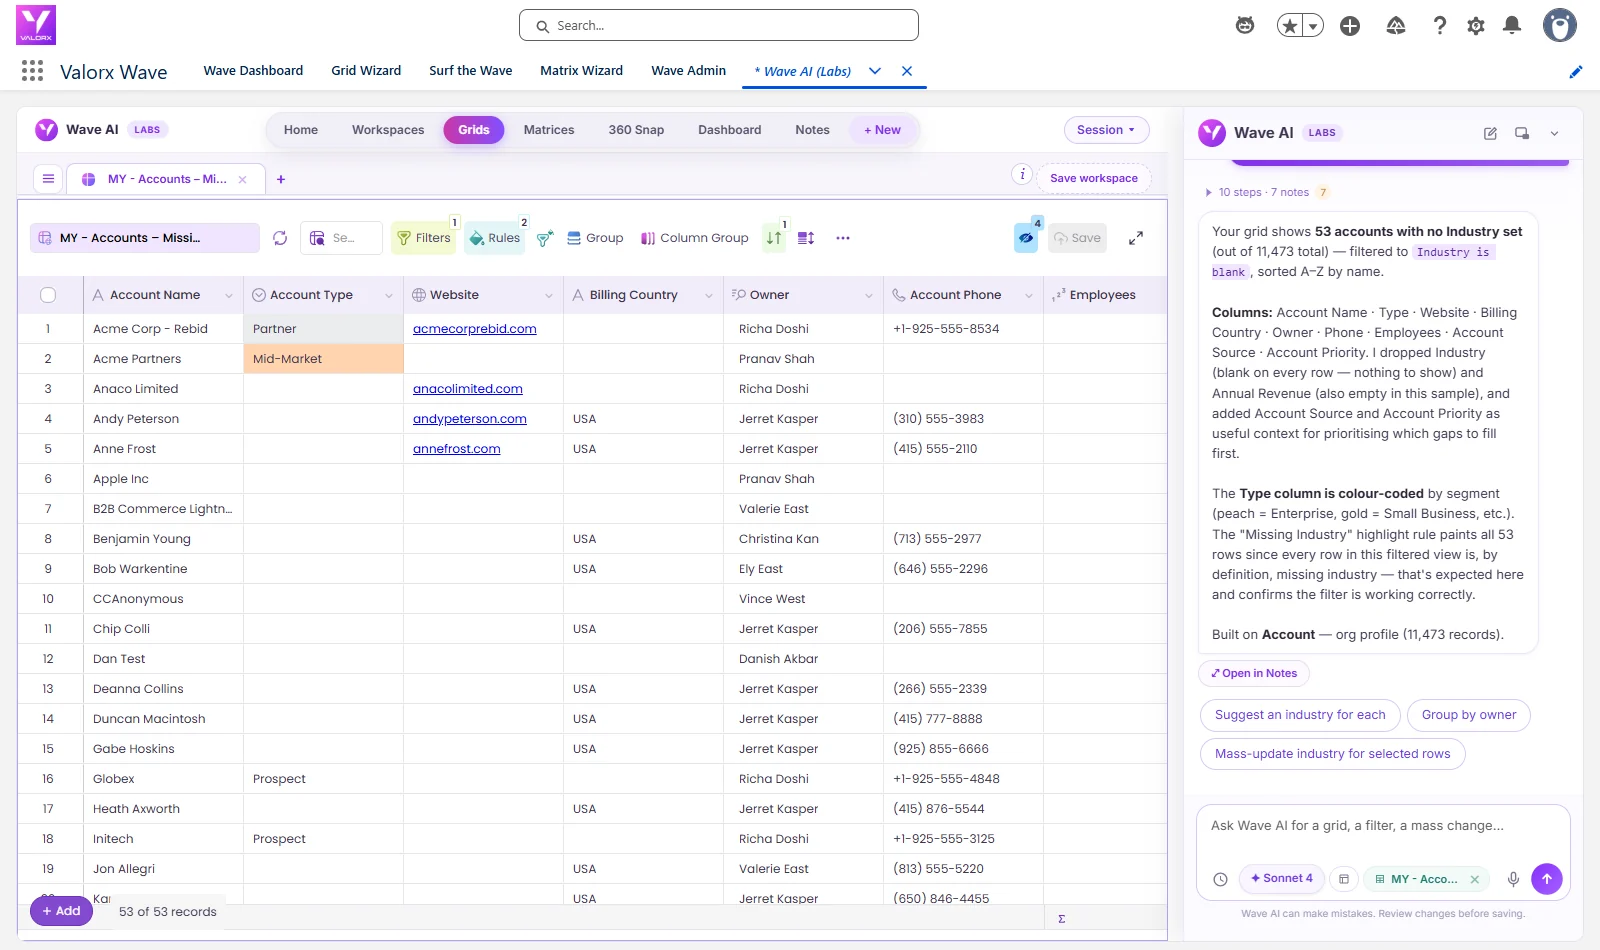
Click Filters in the grid toolbar. Each filter is one line with three parts: a field, a condition and a value.
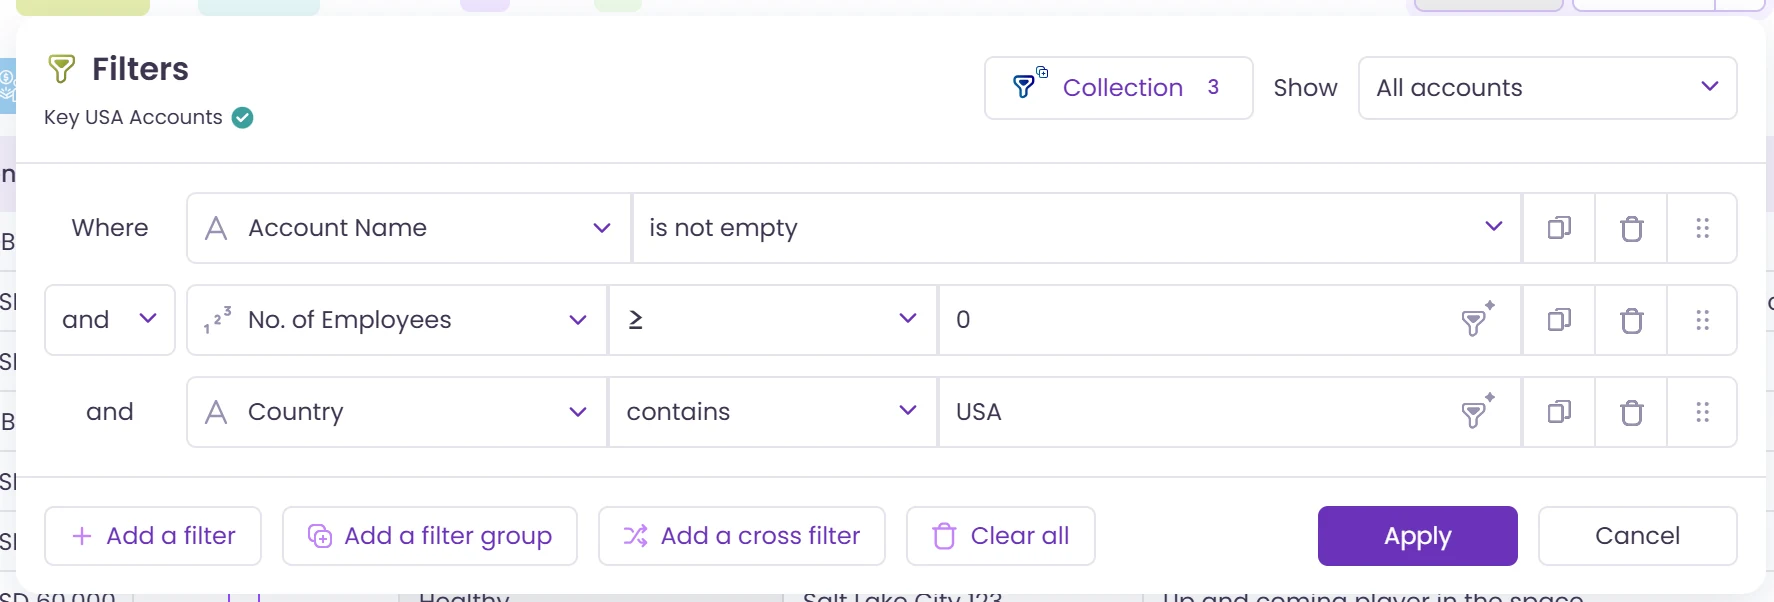
- Click Add a filter. Pick the field, the condition (contains, is not empty, greater than and so on) and the value.
- Add more lines for more conditions. Choose and or or between them.
- Need both in one filter, such as "USA and (over 500 employees or marked key)"? Use Add a filter group.
- Click Apply. The grid shows only the matching records.
Filter parents by their children
Add a cross filter answers questions a normal filter can't: accounts that have open cases, or opportunities with no line items. It filters the records in your grid by the records related to them.
Save a set of filters and switch between them
A Filter Collection is a saved set of filters with a name. Keep several on one grid, such as Key USA Accounts, Renewals This Quarter and No Activity, and switch between them from the Collection button. One can be the default the grid opens with.
Part 2: Colour rules
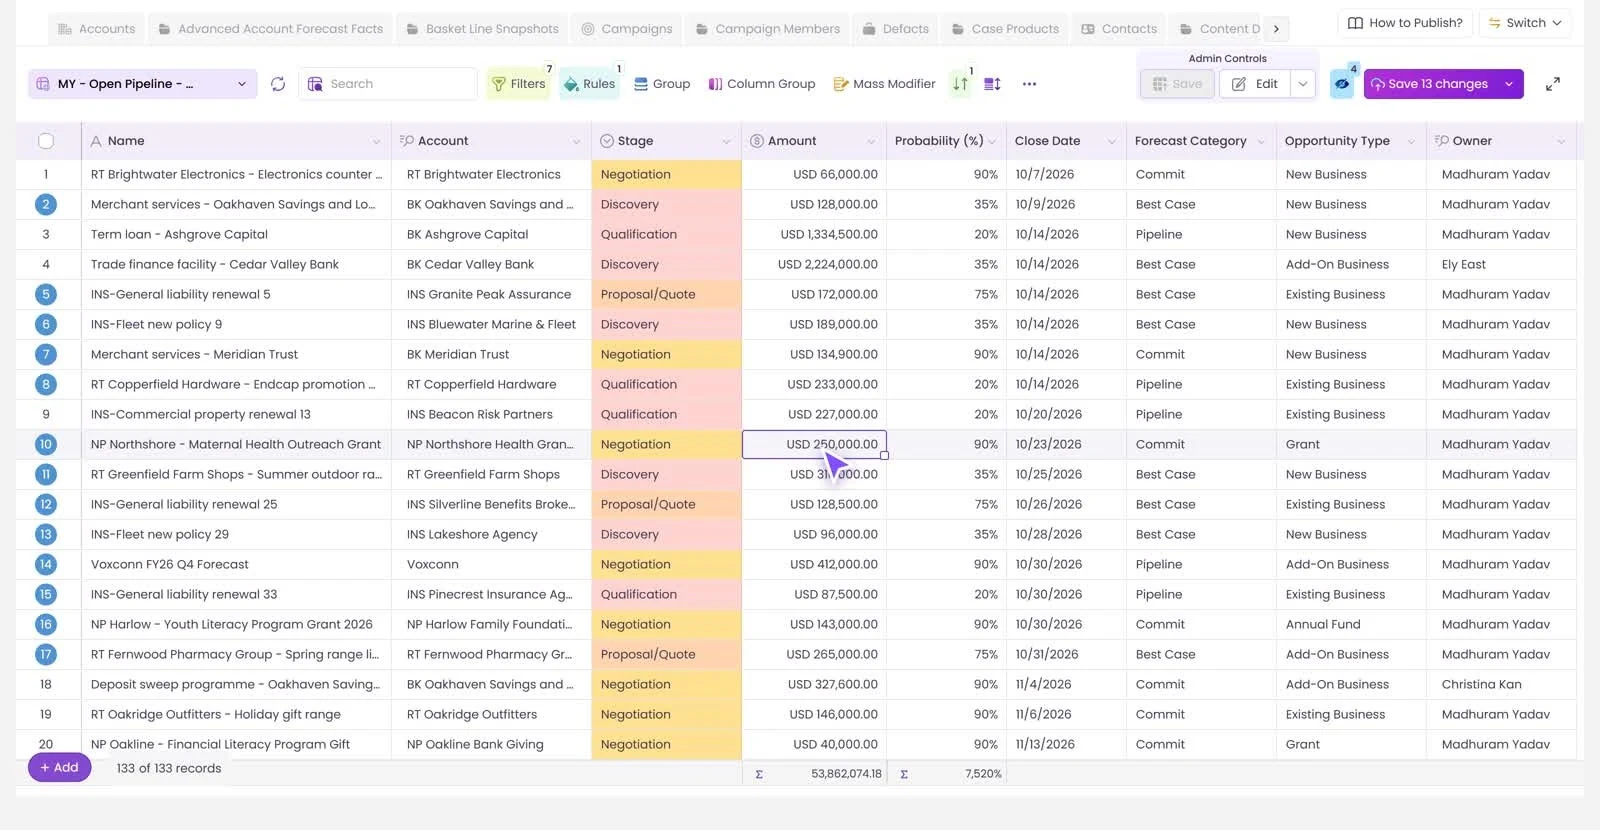
Filters decide which rows you see. Rules decide which of those rows catch your eye. Click Rules in the toolbar.
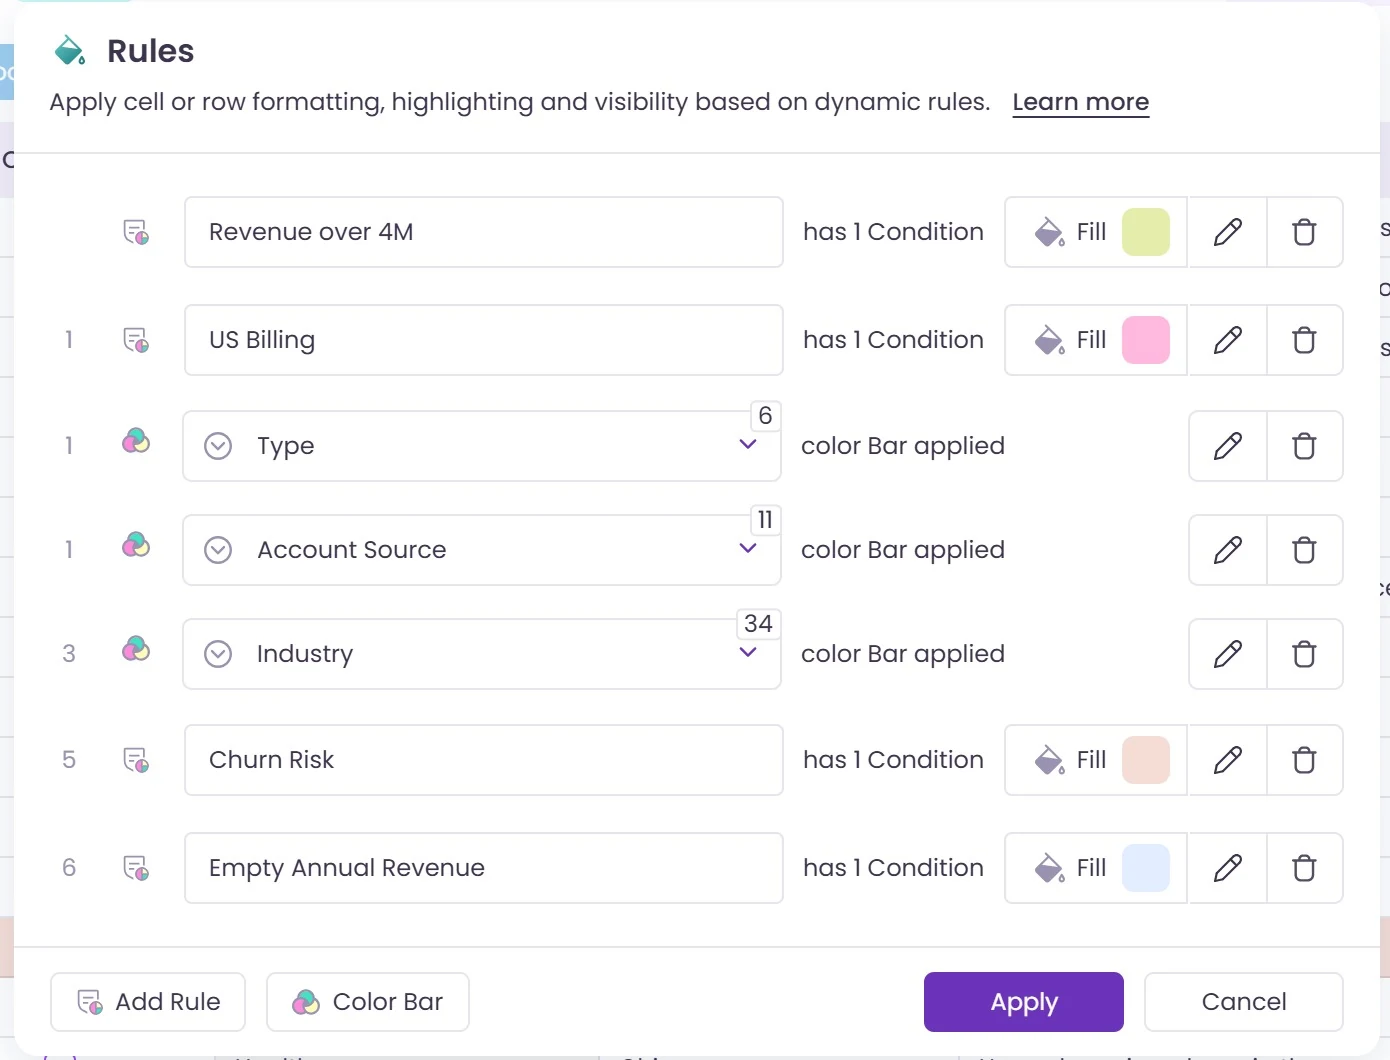
- Click Add Rule and name it, for example Churn Risk.
- Under When, set the condition: Churn Risk is ticked, Annual Revenue is over 4,000,000, or Close Date has passed. Combine conditions with and/or.
- Under Then, choose what happens. Highlight a cell with a dot, a bar or a fill. Shade the whole row. Or make a cell or a row read-only or hidden.
- Add a Legend if you'd like the grid to say what each colour means.
- Click Apply, then Apply again on the Rules panel to switch it on.
More than colour
Because a rule can make a cell or a row read-only, it also protects data. Lock the amount on closed deals. Hide a discount column from rows that aren't yours to change. The same rules work in a Wave matrix.
Filters and rules are saved with the grid, so the whole team opens the same view with the same colours.
Want to see it on your own objects? Book a demo and we'll build the first grid with you on the call.

.svg)





Choose the workflow you need:
Try Wave in browser Extension

Try Wave in Salesforce

Try Fusion In Excel

Enhancing Salesforce for industry leaders