Excel, Inside Salesforce: Everything You Do in a Spreadsheet, on Live Records
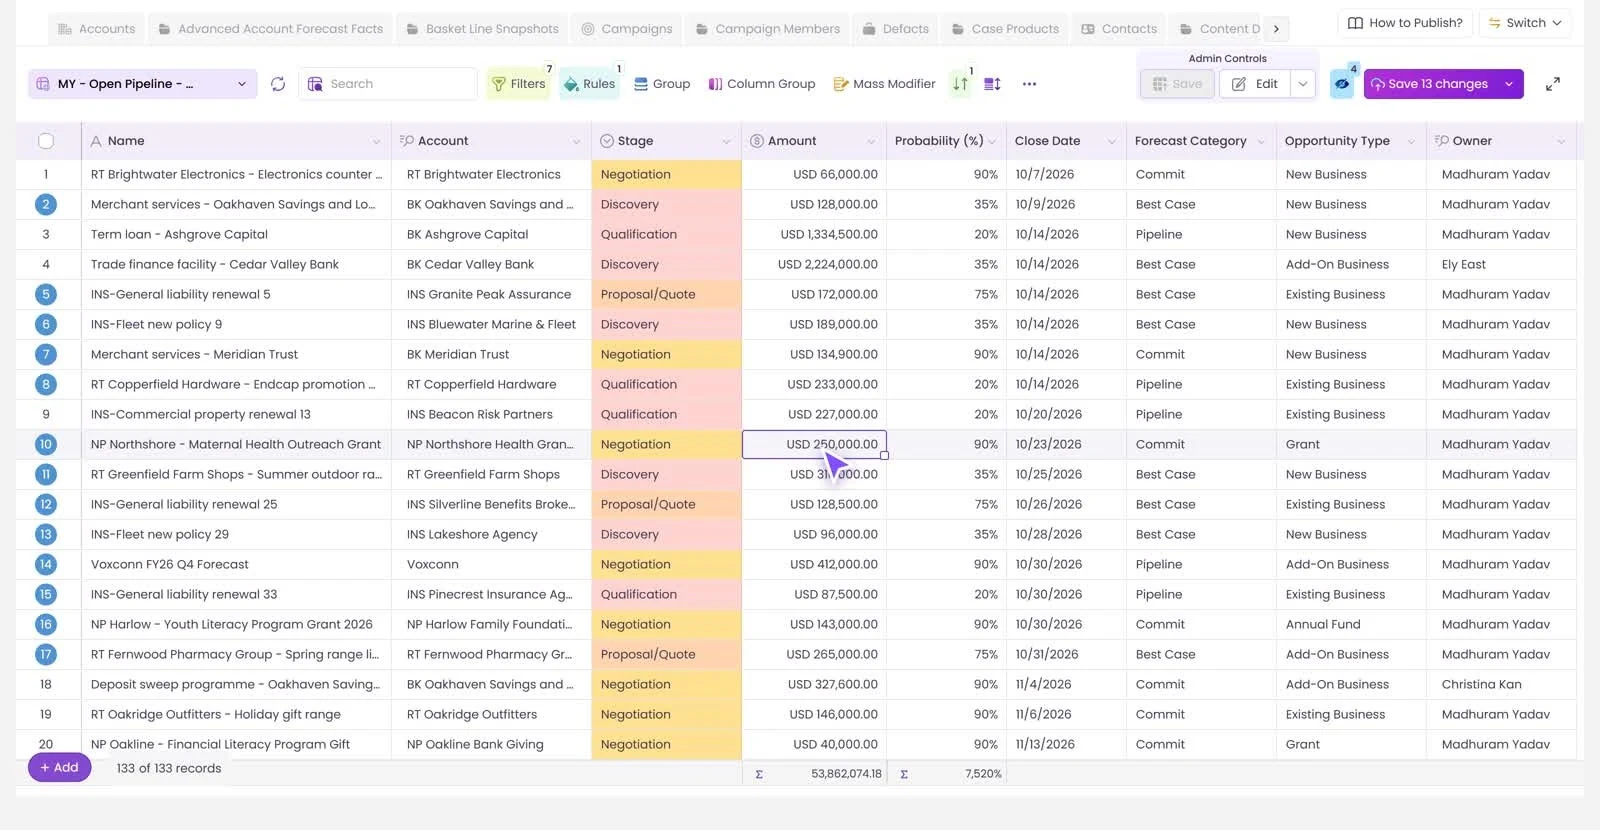
You already know how to work a list. You learned it in Excel: paste a column, drag a value down, write a formula, filter, colour the cells that need attention, turn it into a pivot table.
Salesforce holds the records, but it asks you to work them one at a time. Valorx Wave puts the spreadsheet way of working on top of the live records, inside Salesforce. Here's what carries over.
Copy, paste and fill down
Paste a column of values into the grid and they land in the right cells, one per row. Drag a value down to fill the rows below. Changed cells are marked, and nothing is saved until you click Save.
Change every row at once
Tick the rows, open Mass Modifier, pick the field and what to do with it: set a value, or increase a number across all of them. It's Find and Replace for Salesforce records.
Formulas
Add a formula column to the grid with if, and, round, concat and the other functions you'd expect. No new Salesforce field is needed. Read more: Formulas in a Salesforce Grid.
Filters and colour rules
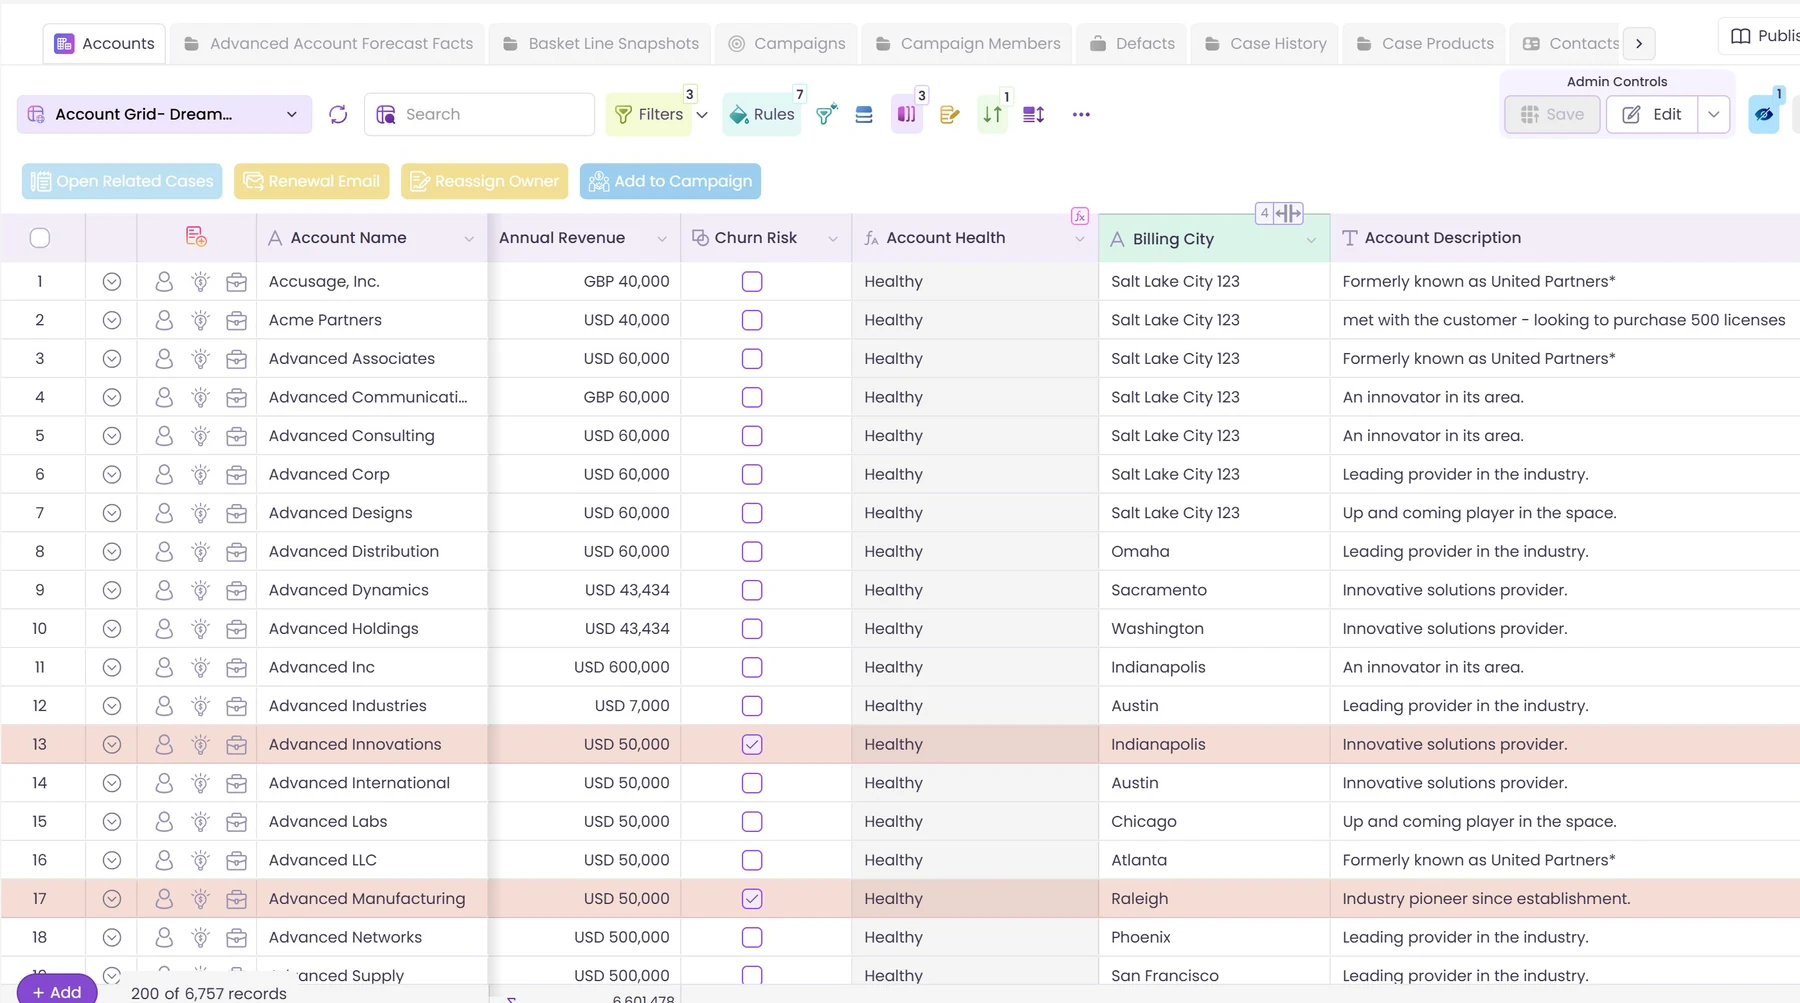
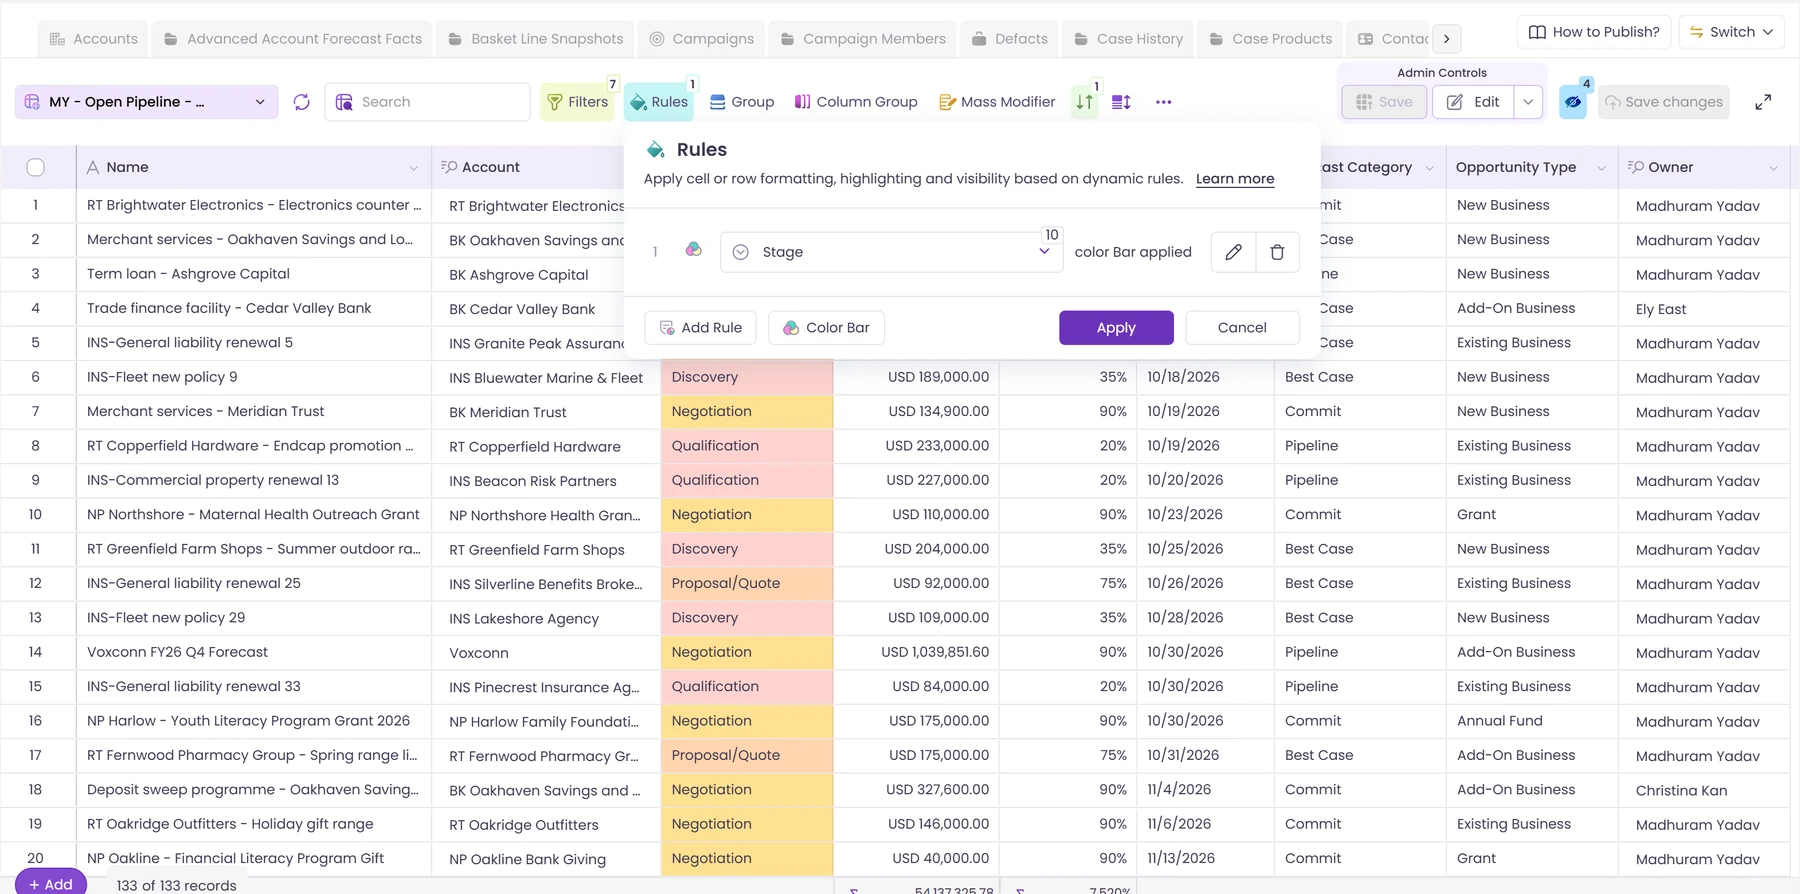
Filter on any field, save sets of filters, and let rules shade the rows that need you. Read more: Filter and Colour Your Salesforce Records.
Line items under the row
Open an opportunity's line items or an account's cases under the row, or the whole record in a side panel. Read more: Related Lists Beside Your Salesforce Grid.
Pivot tables, with Matrix
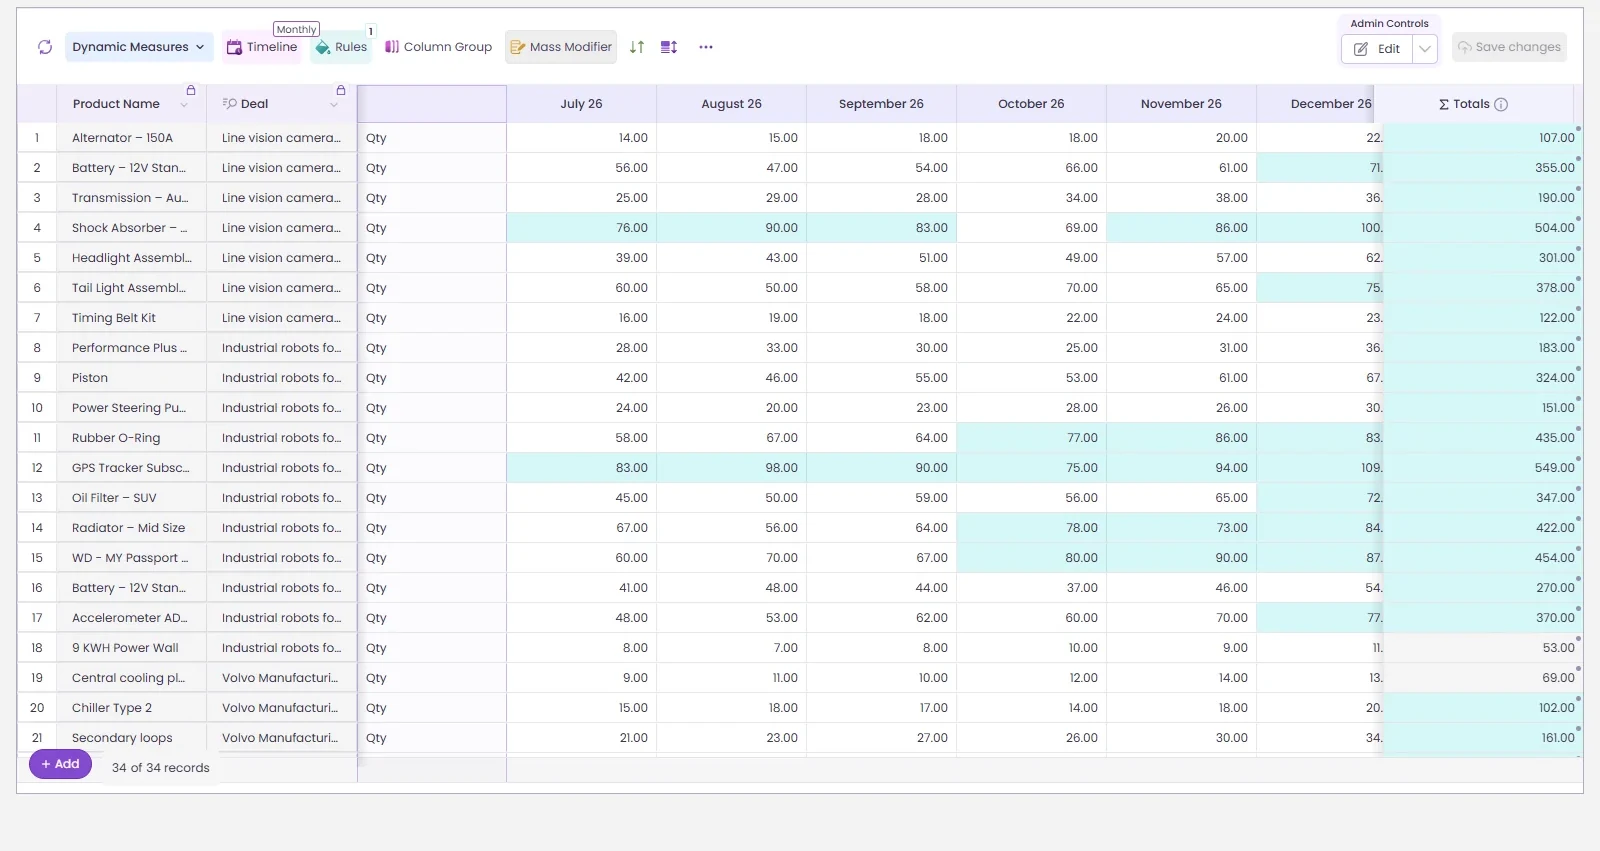
A Wave matrix is a pivot table on live records: products down the side, months across the top, a number in every cell. It works across up to three objects. Unlike a pivot table, you can type in the cells and save.
Buttons and sharing
Add a button that starts a Flow for the rows you ticked. Share the grid with the team and let each person keep their own copy. Read more: Run a Flow From Your Grid, and Share a Salesforce Grid With Your Team.
What's different from a spreadsheet
- It's the live record. There's no file, no copy and no version to merge.
- Your Salesforce permissions still apply. People see and change only what they're allowed to.
- It saves to Salesforce. Reports, dashboards and automations see the change straight away.
If you can use Excel, you can use a Wave grid. The difference is that when you save, Salesforce is already up to date.
Want to see it on your own objects? Book a demo and we'll build the first grid with you on the call.


.svg)







Choose the workflow you need:
Try Wave in browser Extension

Try Wave in Salesforce

Try Fusion In Excel

Enhancing Salesforce for industry leaders