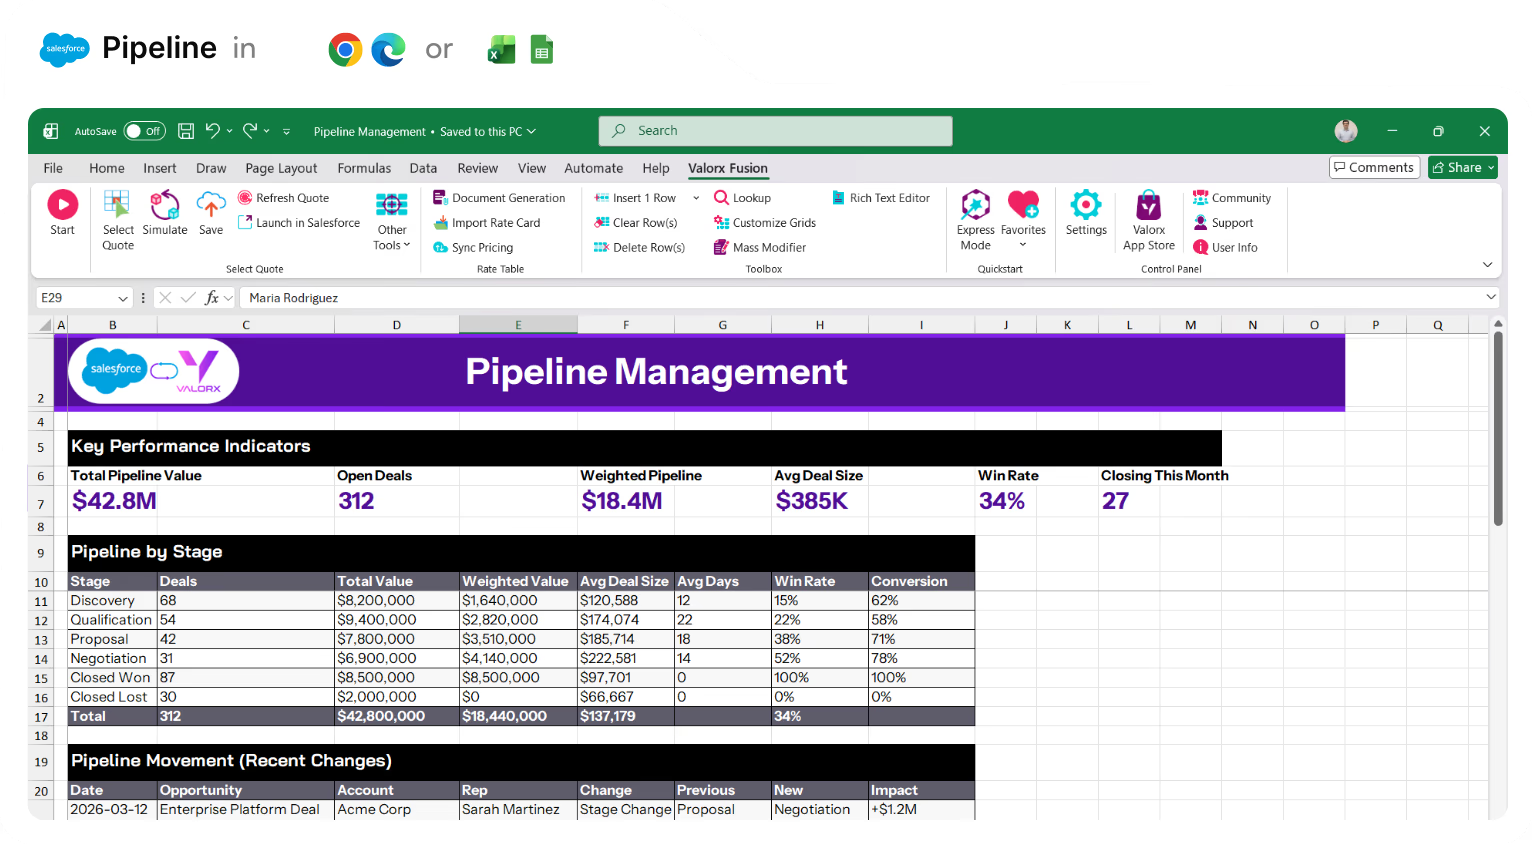
Salesforce Pipeline Management

Update deals in bulk, spot risk in real time, and keep pipeline data clean—all in a familiar Excel interface connected directly to Salesforce.
Excel spreadsheet showing Pipeline Management metrics including total pipeline value $42.8M, open deals 312, weighted pipeline $18.4M, average deal size $385K, win rate 34%, and deals closing this month 27 with detailed pipeline stages and recent pipeline movement.
USE CASES

What your pipeline management has been missing

Spend less time updating deals and more time on closing them.
Excel spreadsheet titled Pipeline Grid showing sales opportunities with columns for Account, Owner, Stage, Amount, Close Date, Probability, Weighted Amount, Next Step, Days in Stage, Forecast Category, Risk Score, Last Activity, and Flag.

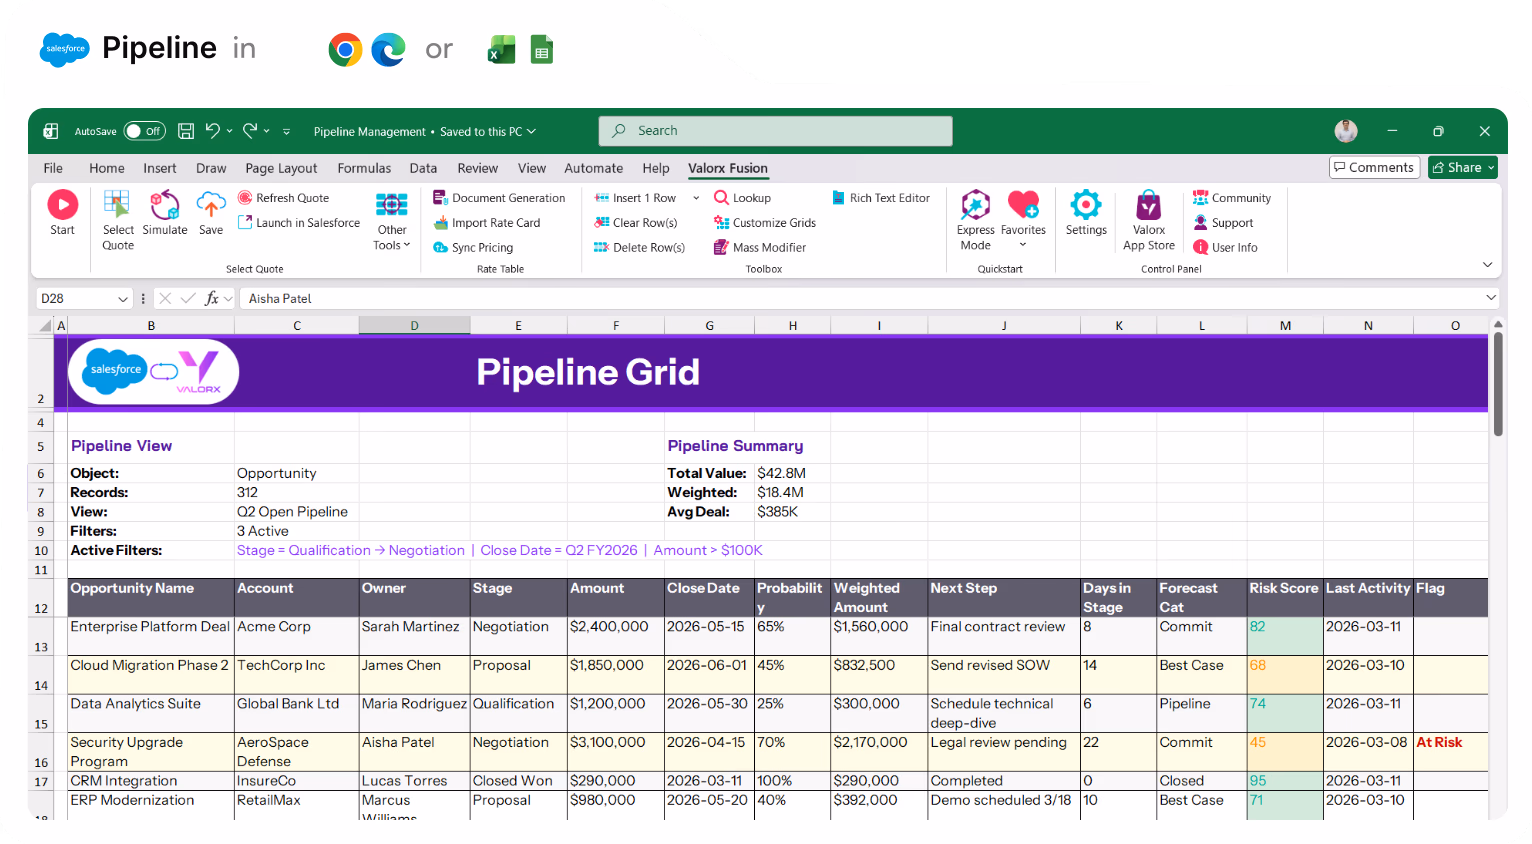
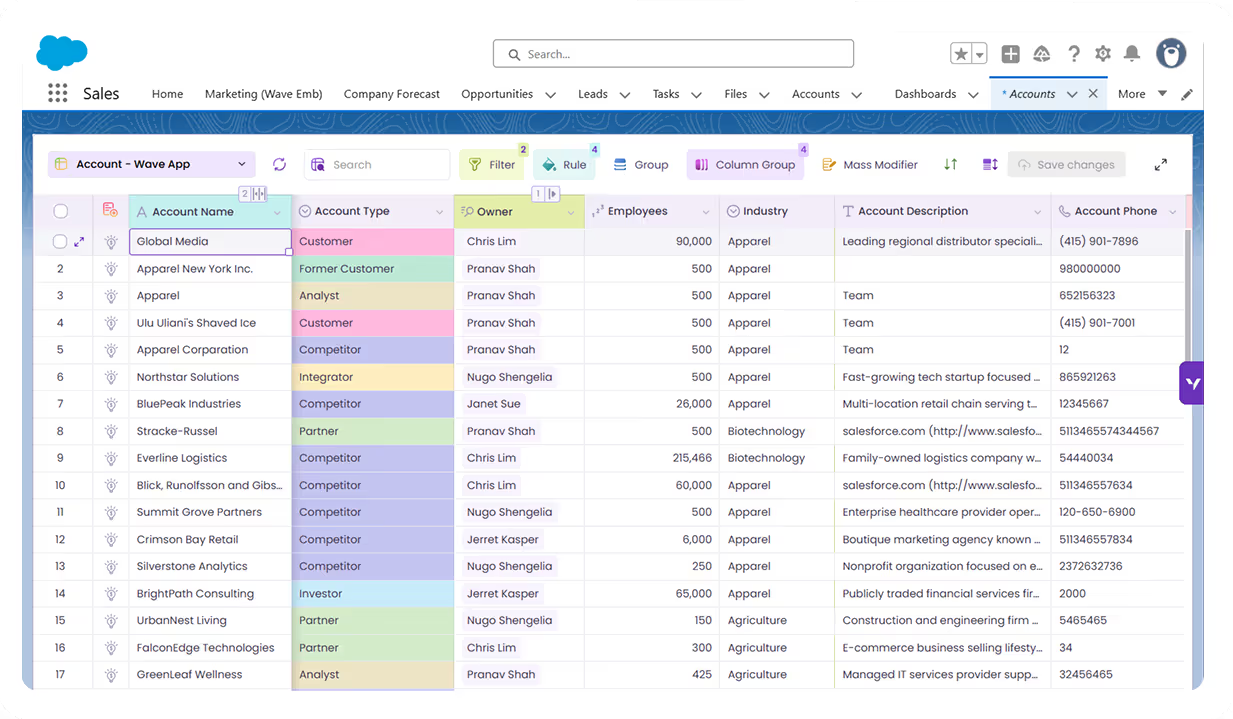
Update your entire pipeline in minutes, not hours

Pull up 300 open opportunities, filter by close date or stage, update next steps across all of them, and push to Salesforce in one click. No more opening 300 tabs or asking your admin to run a bulk job.
Excel spreadsheet titled Live Pipeline Tracker showing pipeline activity and deal movement log with details on dates, opportunities, accounts, owners, stages, amounts, and direction.

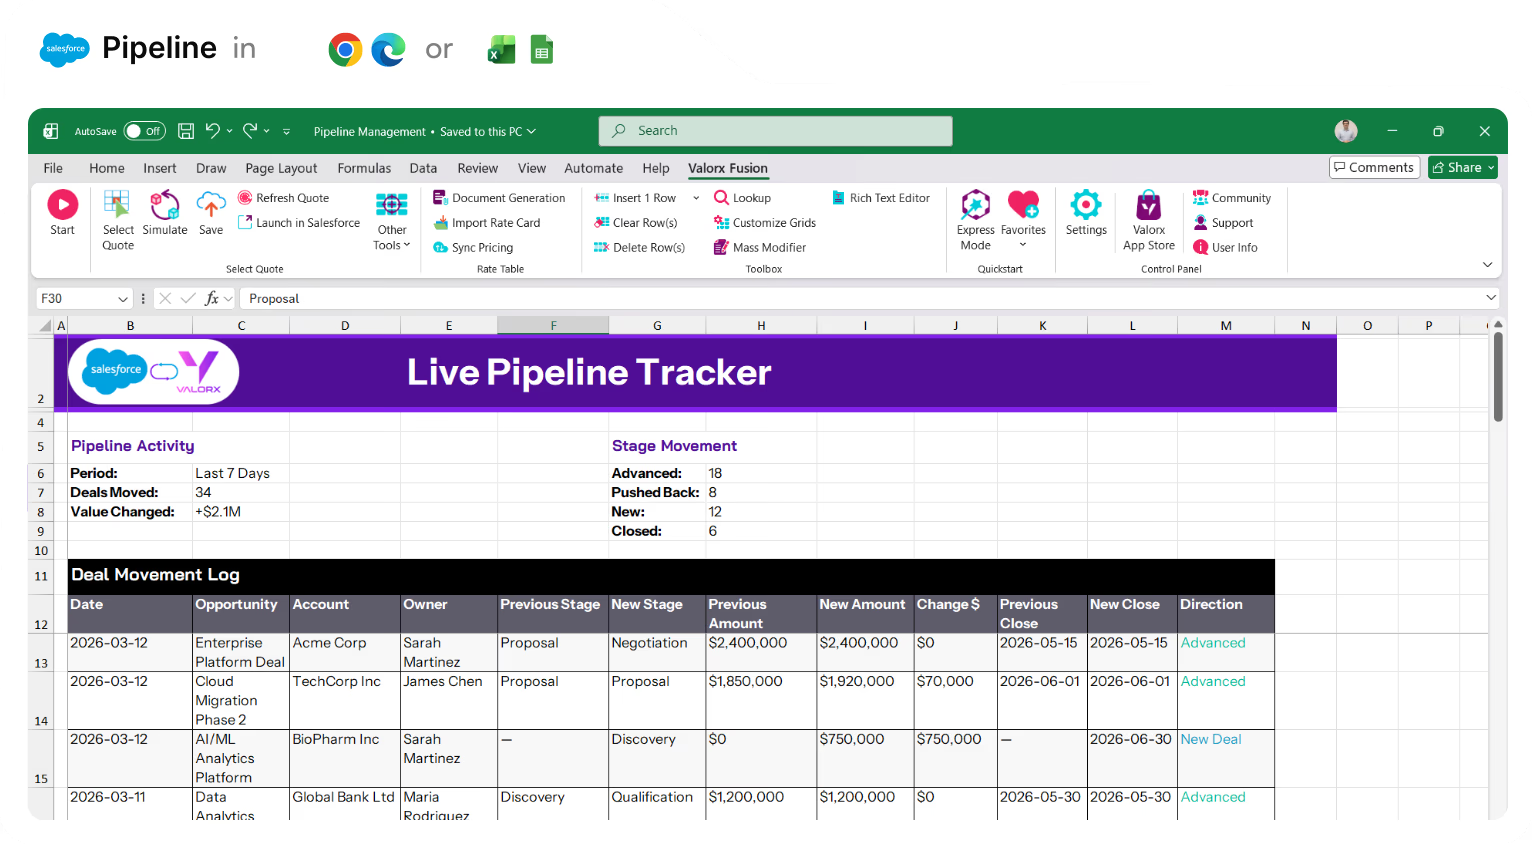
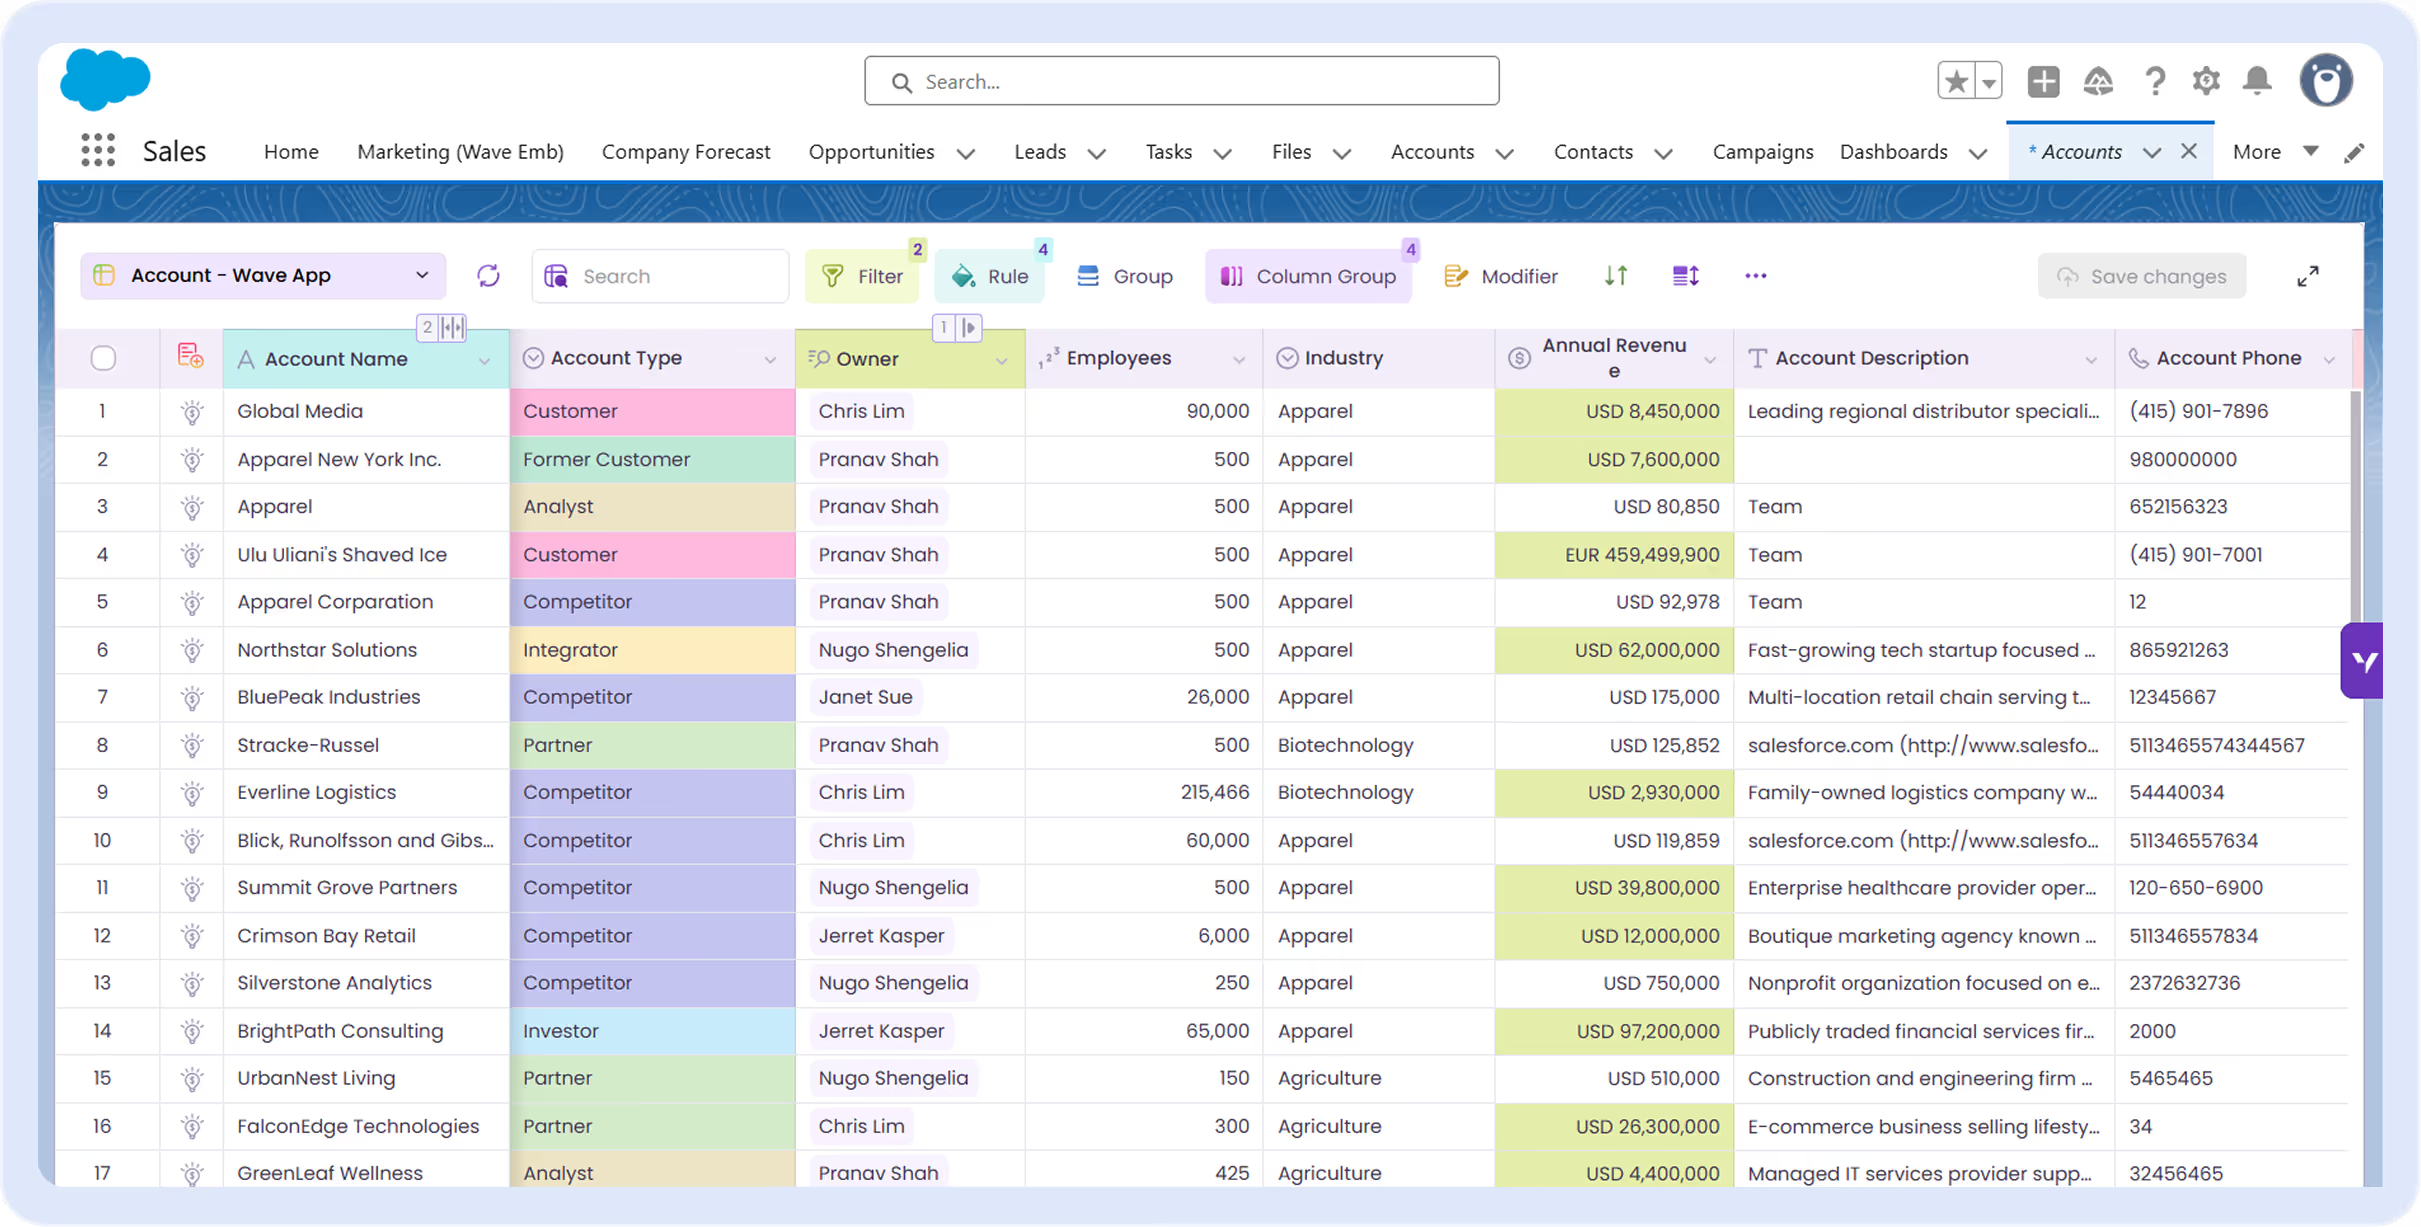
See what's actually happening—right now

Dashboards show you a snapshot. Fusion shows the live feed. Watch deals move between stages, track value changes as they happen, and stop relying on exports that are outdated before you open them.
Excel spreadsheet titled Scenario Modeling showing pipeline scenario analysis with base case and two scenarios detailing opportunity amounts, probabilities, expected values, and statuses.

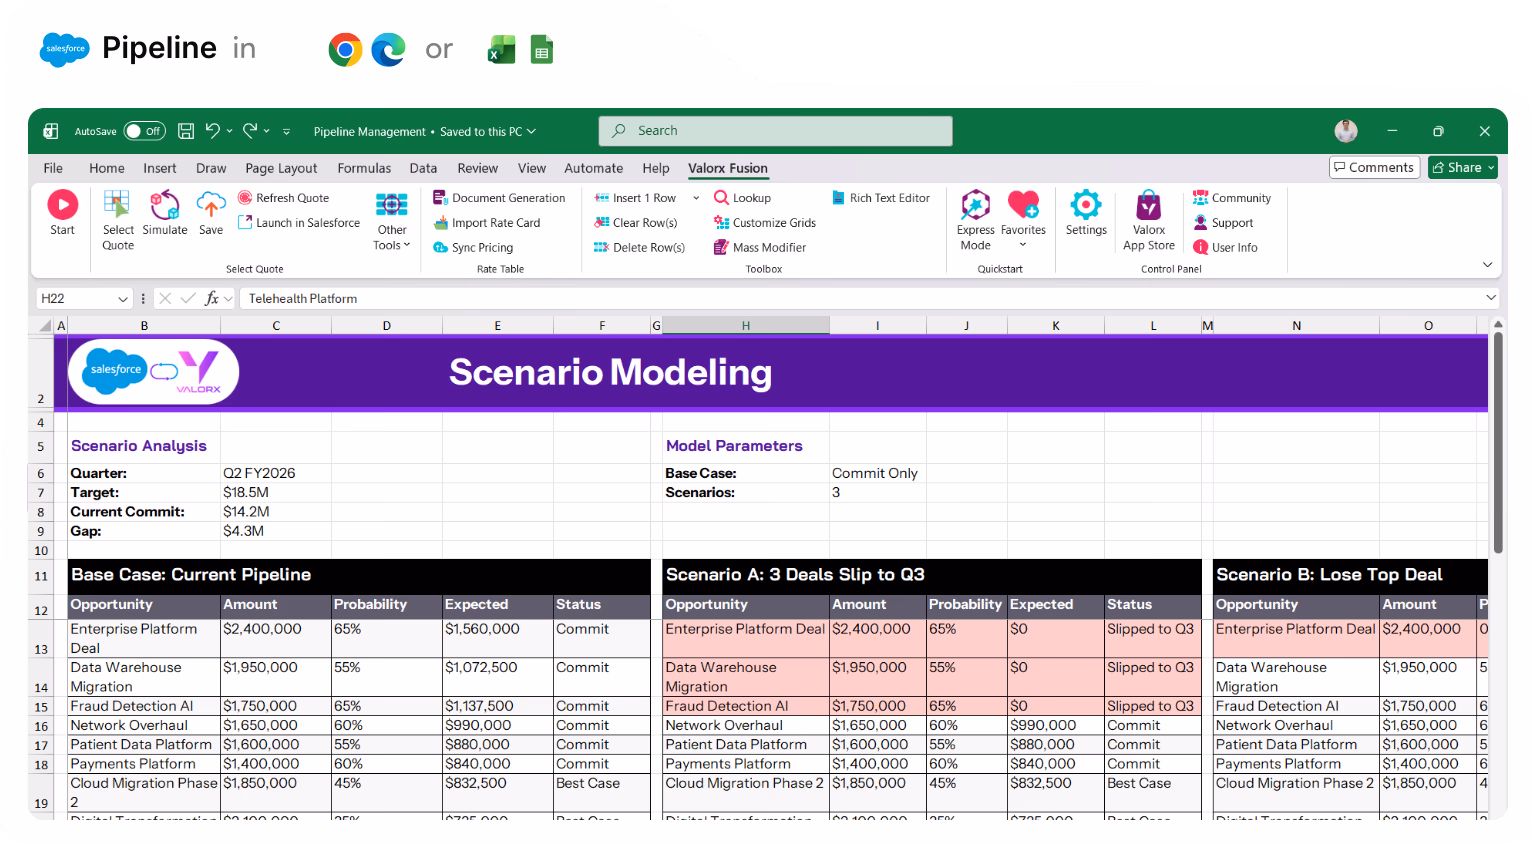
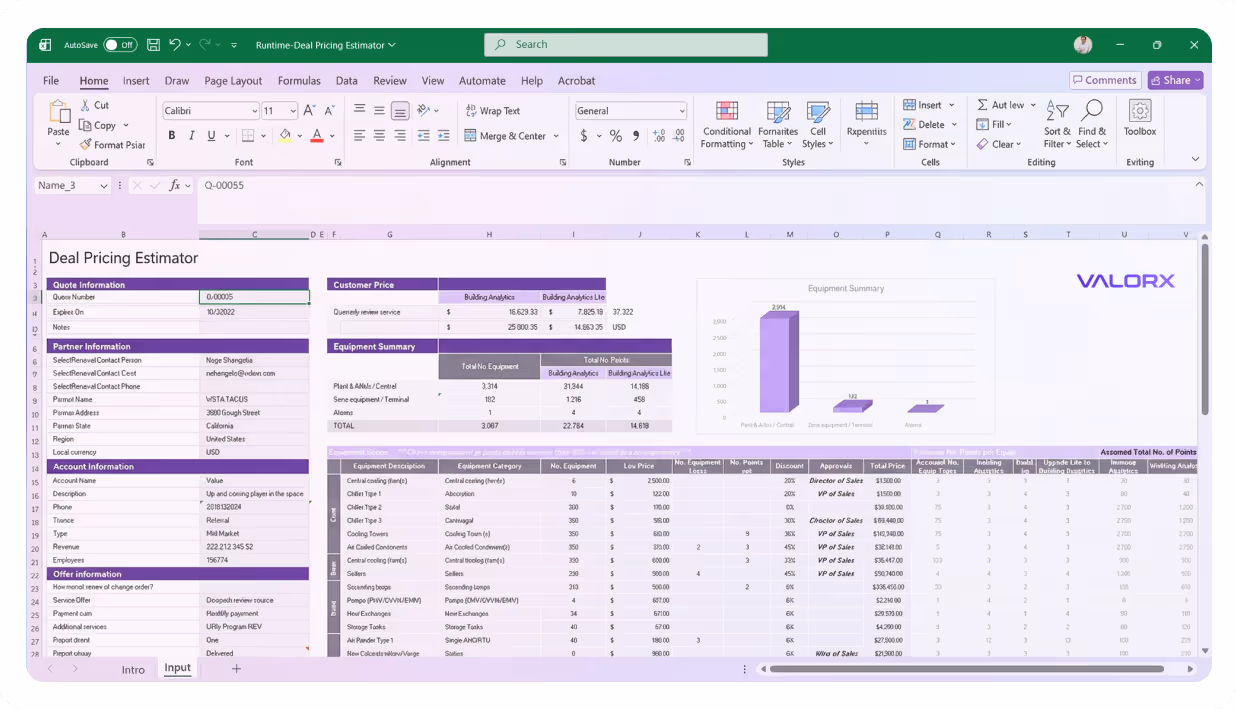
Answer "what if" without the spreadsheet gymnastics

What happens to your quarter if three deals slip? What's the gap to target if you lose your top opportunity? Model scenarios on live data and get answers in seconds—no exports, no formulas, no version control nightmares.
Excel spreadsheet showing a Rep Pipeline View integrating Salesforce and Valorx Fusion with deal details, stages, amounts, probabilities, next steps, and activities for sales rep Sarah Martinez.

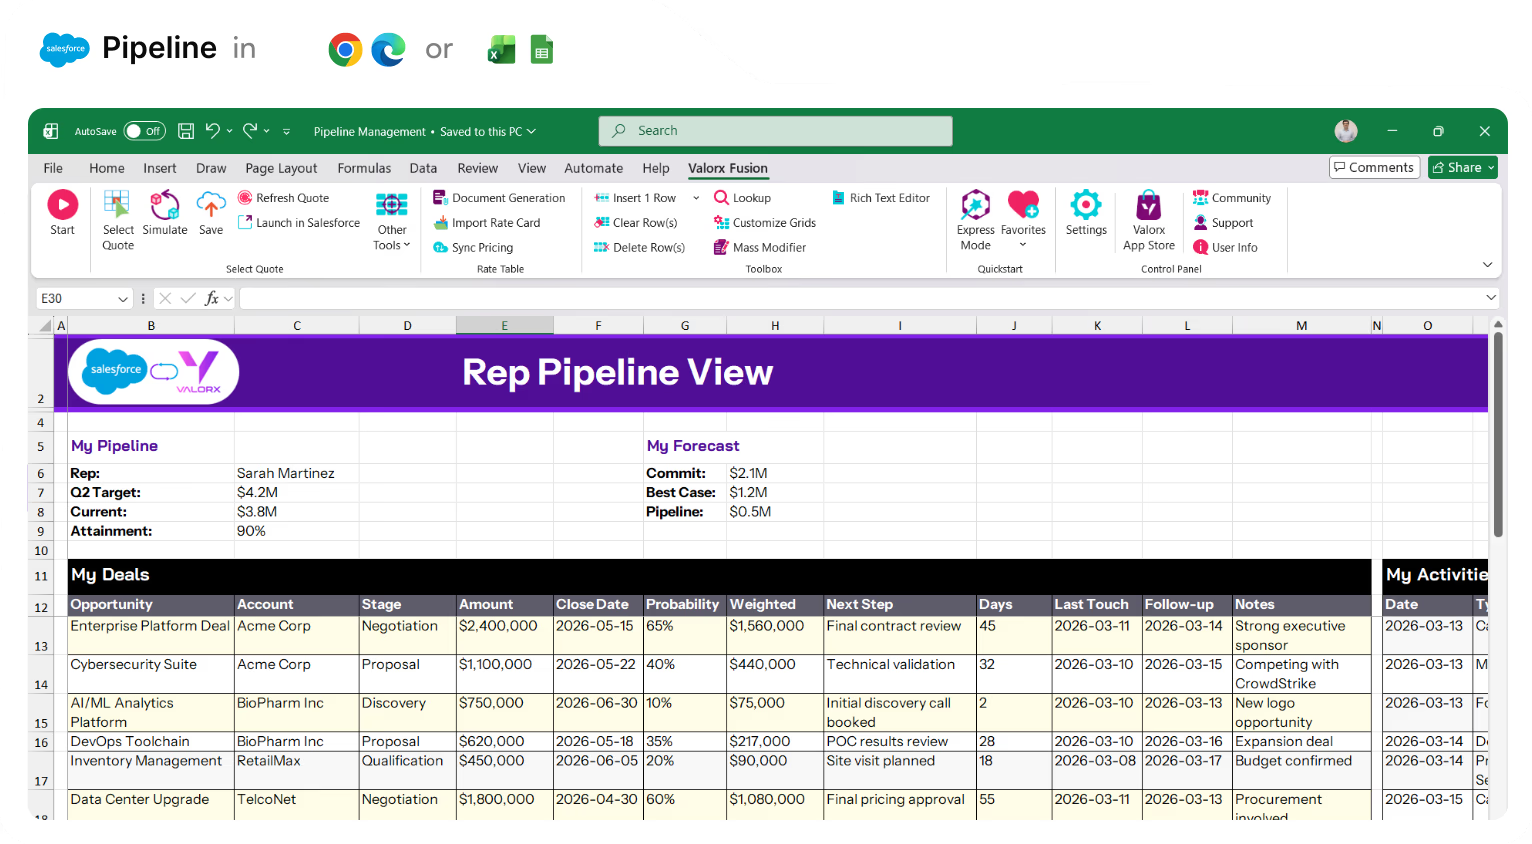
The tool your reps will actually use

Reps don't need training. They already know Excel. Give them a pipeline view that feels familiar, updates instantly, and doesn't make them click through five screens to change a close date.
Valorx Wave CRM dashboard displaying a table of opportunity records with columns for Name, Stage, Amount, Close Date, Owner, Opportunity Type, and Account.
Sales agreement table in Valorx Wave showing account details, products, planned quantities, sales prices, and discount percentages for October 25 and November 25.
Valorx Wave sales dashboard showing account details like name, phone, type, and owner, alongside a circular KPI chart with case status breakdown and 147 record count.

Real results from enterprise teams   

Book a demo

100%

customizable pipeline views

1

click to sync back to Salesforce

1000+

records updated in seconds
Abstract soft pastel-colored gradient background with blurred lavender, blue, and pink hues.

What changes when you add Valorx to Salesforce

Turn Salesforce from a reporting system into an active pipeline workspace.
Without Valorx
Clicking into each opportunity to update one field at a time
Reps exporting to Excel to build complex quotes
Can’t see everything in the quote because nested UI hides the bundle structure
Spend time on manual pricing checks and margin calculations
Valorx upgrades
Edit hundreds of deals in a single grid view
Real-time quoting inside Salesforce—no exports
Flat grid view that shows the whole quote at once
Formula-driven pricing with instant margin visibility
Smiling young man with glasses and a beard wearing a black shirt on a light gray circular background with a small purple circle in the top right.
Eric Winston
Service Supervisor
Book a demo
Soft gradient background fading from light gray to pale blue and white.

Two ways to work, one goal: better data in Salesforce

Choose the interface that fits how your team works.
Abstract purple outline of four connected circles inside a rounded square frame on a black background.
Abstract geometric logo featuring a circle above layered semicircles within a rounded square border.
Venn diagram with three overlapping purple circles on a black background.
Purple crescent shapes forming a circle on a black square background with rounded corners.
Purple outline icon of a briefcase inside a rounded square border on a black background.
Abstract black and purple geometric design with layered squares and rounded corners.
Green spreadsheet file icon representing an Excel document on a light background.
Abstract black and purple geometric design with layered squares and rounded corners.
Smiling young man with glasses and a beard wearing a black shirt on a light gray circular background with a small purple circle in the top right.
Eric Winston
Service Supervisor
Book a demo
Icon with three nested rectangles inside a rounded square outline, representing a scaling or resizing concept.
Microsoft Excel app icon with an overlapping white X on a green abstract background.
Purple geometric icon with three nested diamond shapes on a black background.
Three purple abstract human figures representing a group or team on a light background.
Icon with three stacked rounded rectangles in purple outline on a black background.
Abstract purple outline of four connected circles inside a rounded square frame on a black background.
Icon showing four interconnected circles forming a square with a horizontal line extending from the right circle.
Google Chrome web browser logo.
Salesforce logo with white text inside a blue cloud shape.
Abstract geometric design with multiple rounded squares outlined in purple on a black background.
Purple circular abstract icon with overlapping partial rings on a black square background with rounded corners.
Three overlapping purple circles forming a triangular Venn diagram on a black background.
Abstract geometric logo featuring a circle above layered semicircles within a rounded square border.