Resource Management in Salesforce

Staff projects, track utilization, and balance workloads with spreadsheet-style editing inside Salesforce.
Excel spreadsheet displaying resource management dashboard with key performance indicators, resource utilization summary by department, and current projects table.
Resources
USE CASES

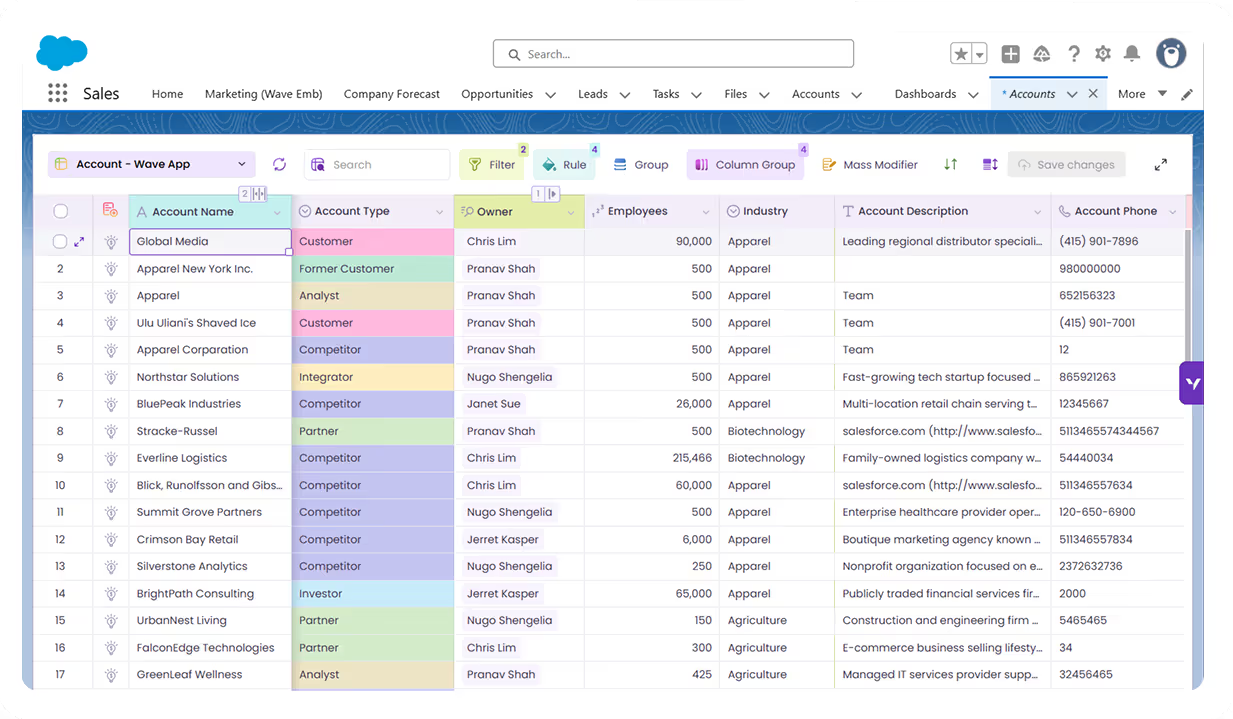
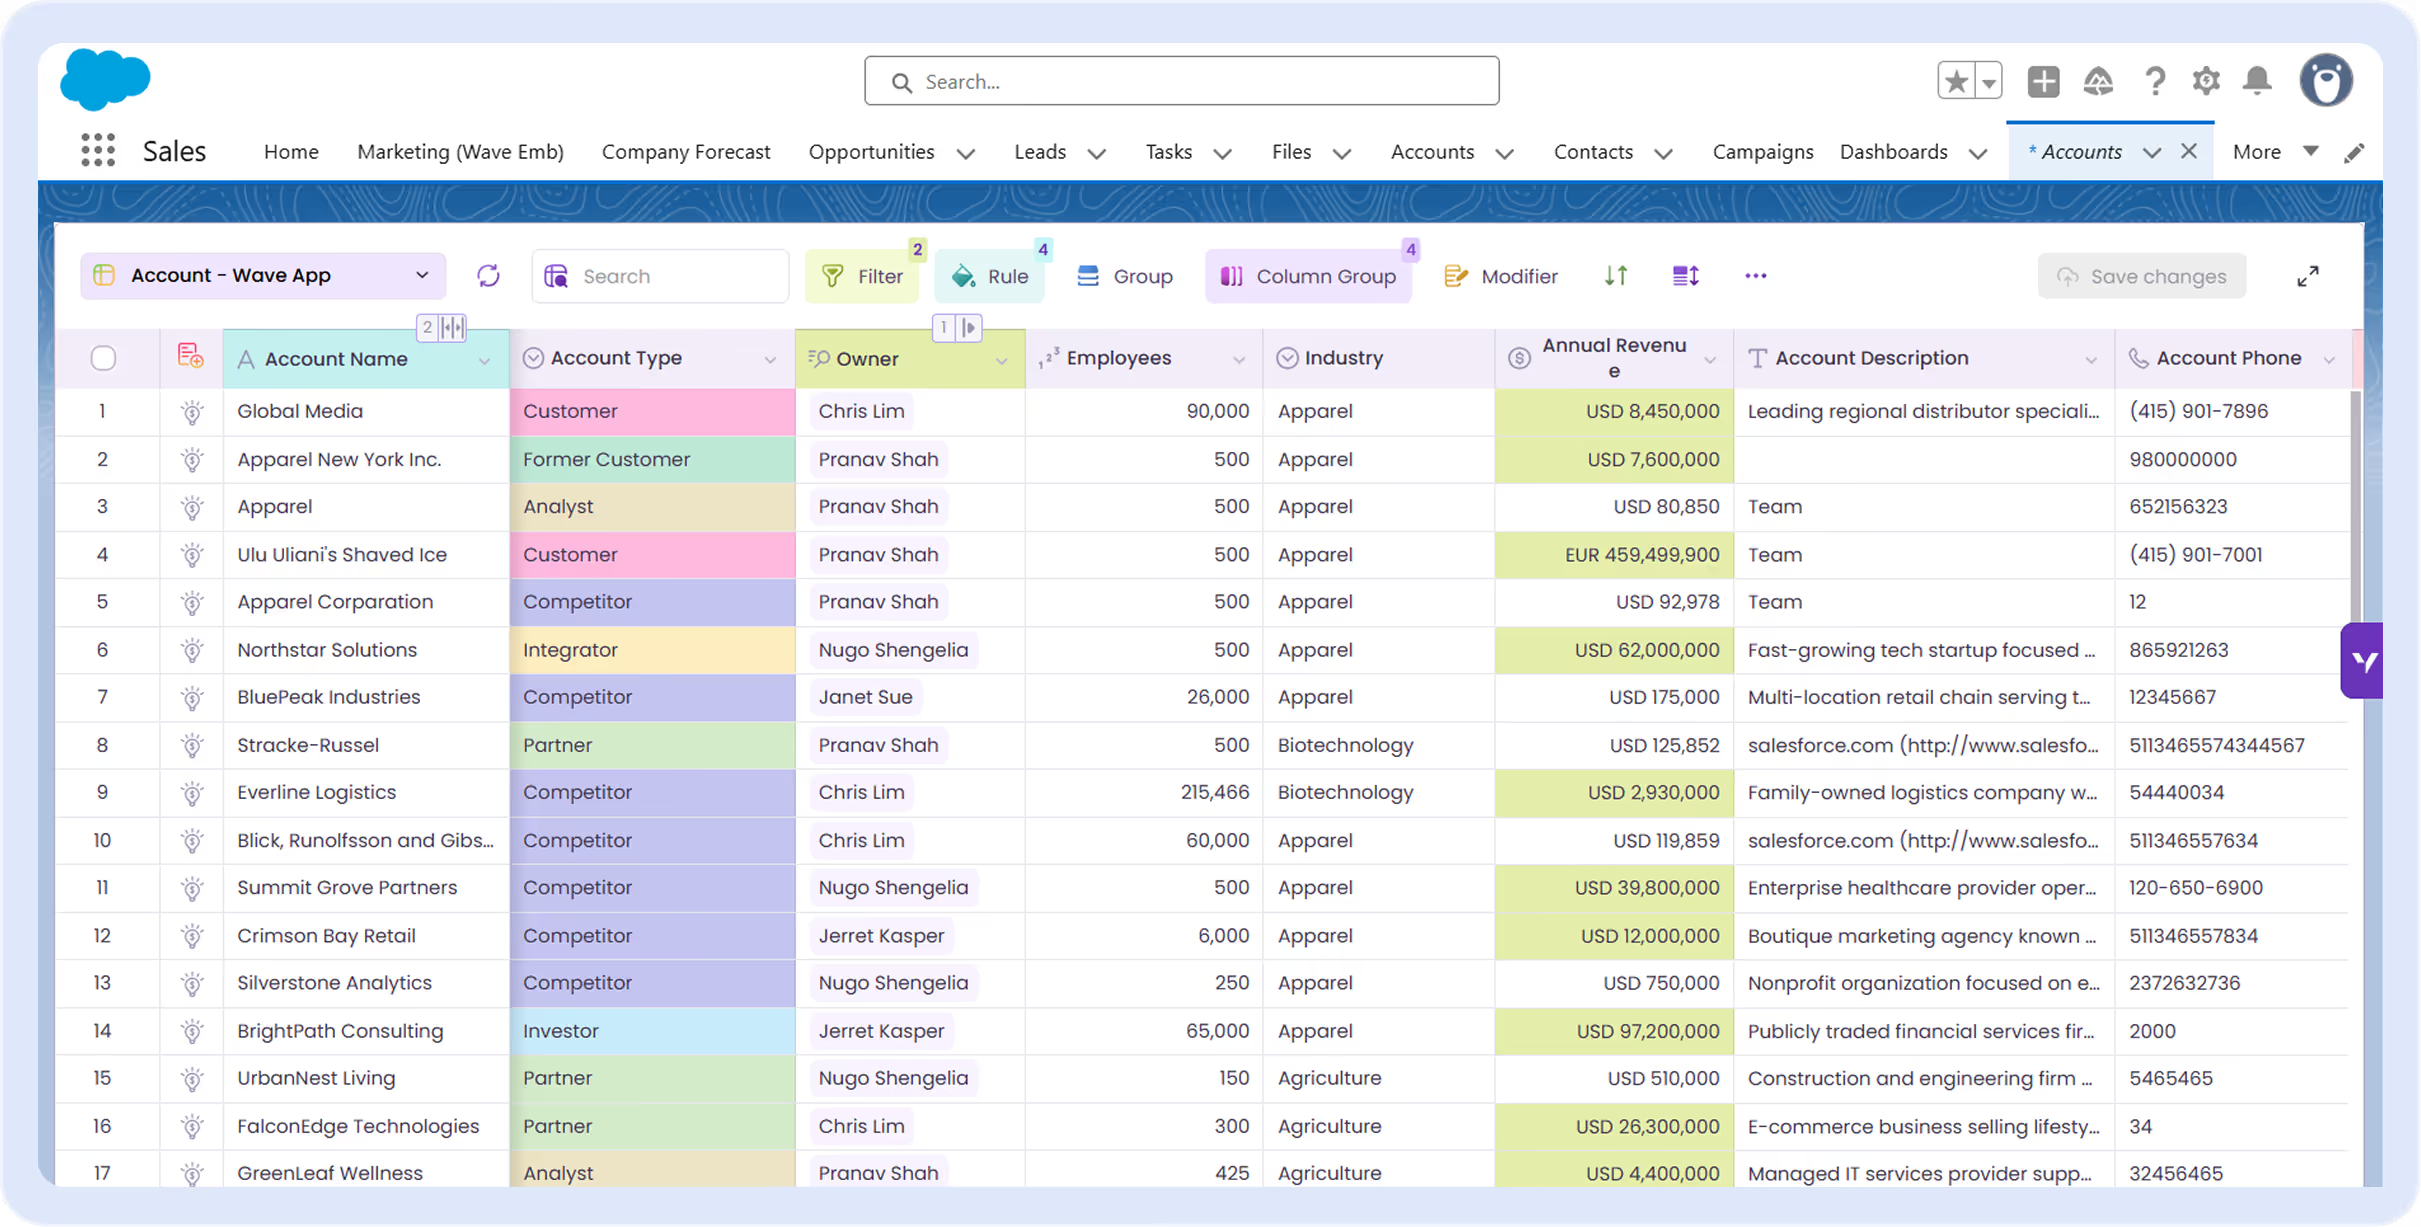
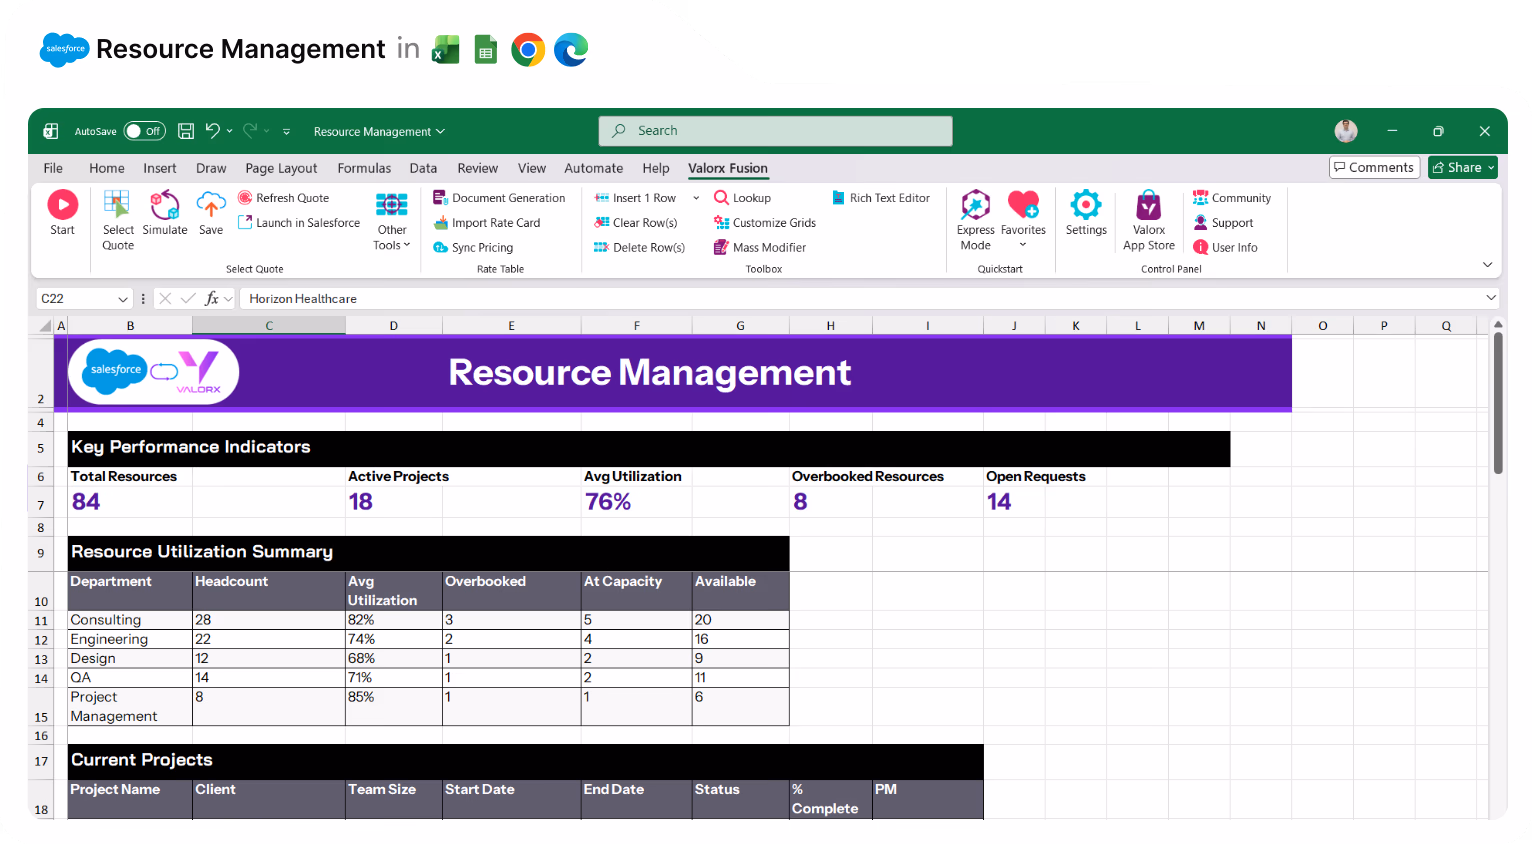
Assign and manage resources directly from Salesforce

Spreadsheet-style editing that makes resource planning faster and more accurate.
Excel sheet titled 'Bulk Assignment Updates' showing resource assignments with columns for resource name, role, department, current project, account, allocation percentage, start and end dates, hours per week, billable status, rate, status, and manager.

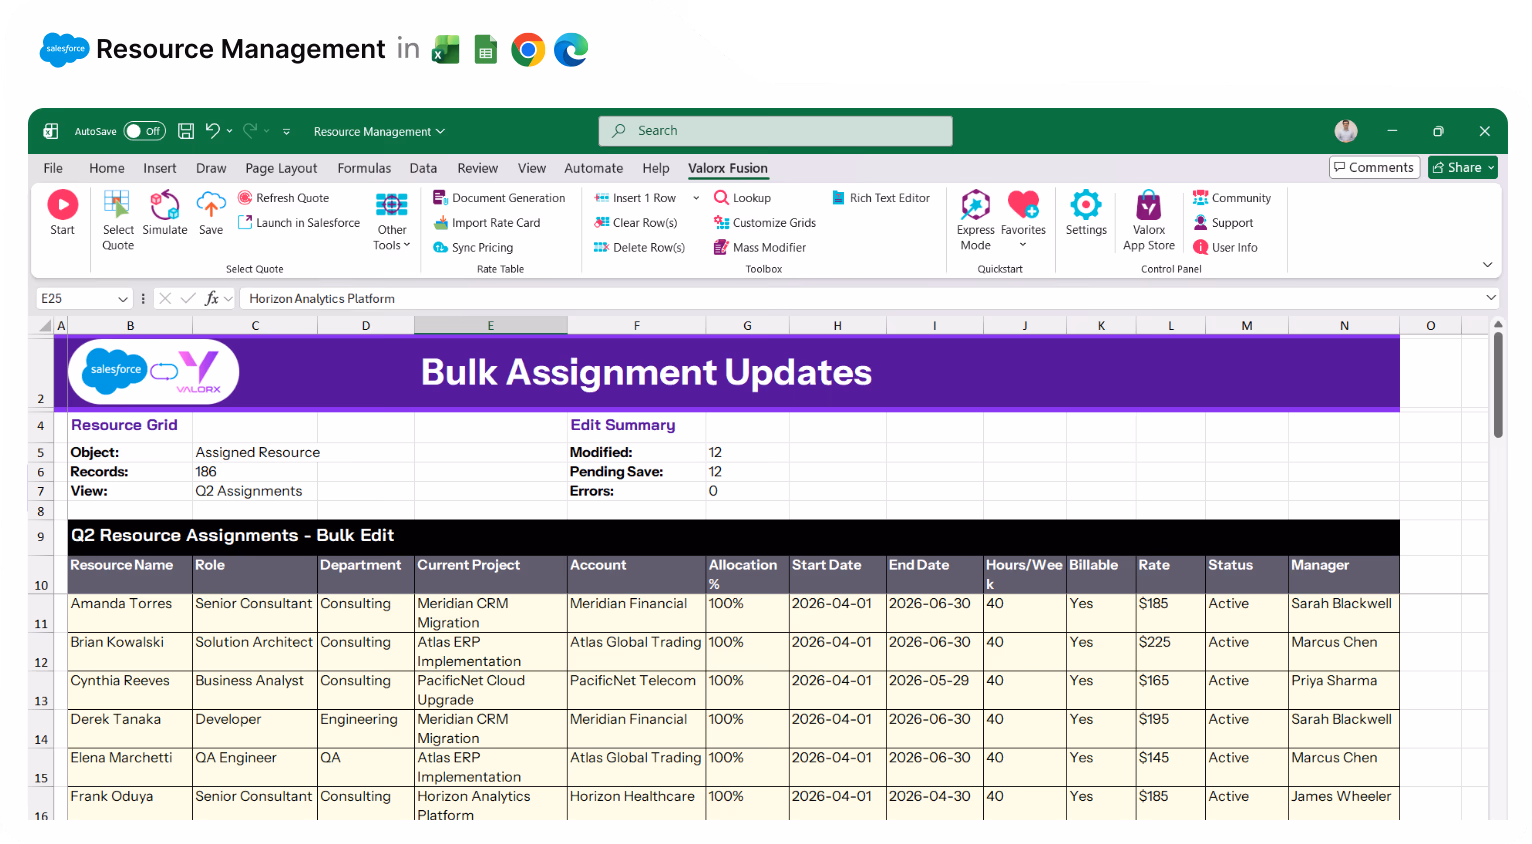
Update resource assignments in bulk

Edit allocations, project assignments, and availability across your team. Copy/paste, drag/fill, and mass modify.
Excel screenshot displaying a Resource Management Utilization Heatmap with overbooked consultants highlighted in red, showing roles, departments, allocated and available hours, utilization percentages, billable hours, project assignments, and status for Q2 FY2026.

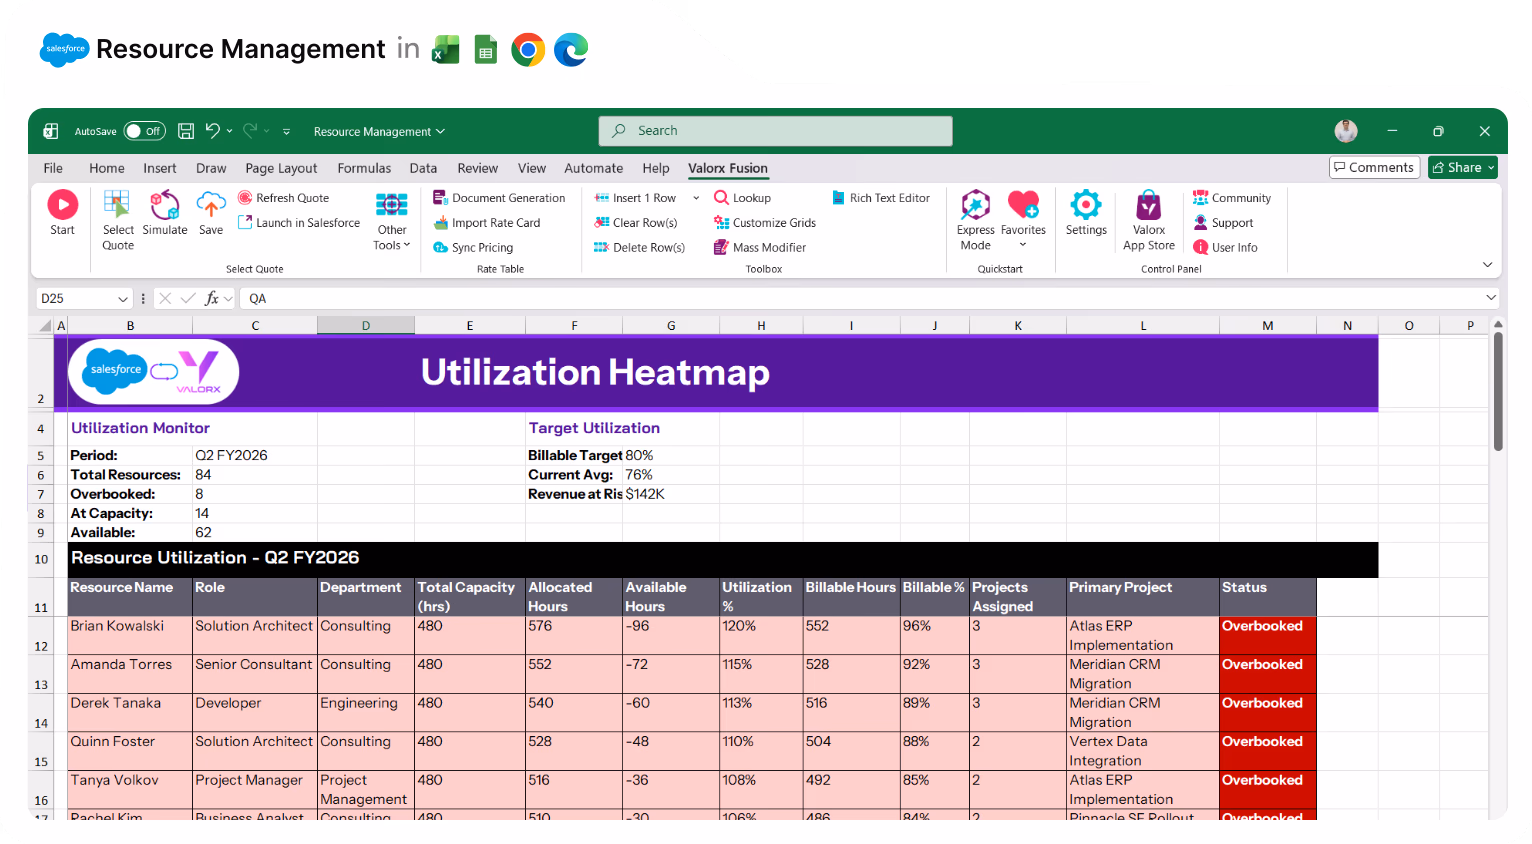
See overloaded and available resources instantly

Conditional formatting highlights who's at capacity, who's overbooked, and who has availability.
Excel spreadsheet titled Capacity vs Demand showing capacity planning and staffing gaps with a table listing resource names, roles, departments, skill levels, total capacity hours, currently allocated hours, available hours, pipeline demand, gap/surplus hours, gap percentage, urgency, and action needed.

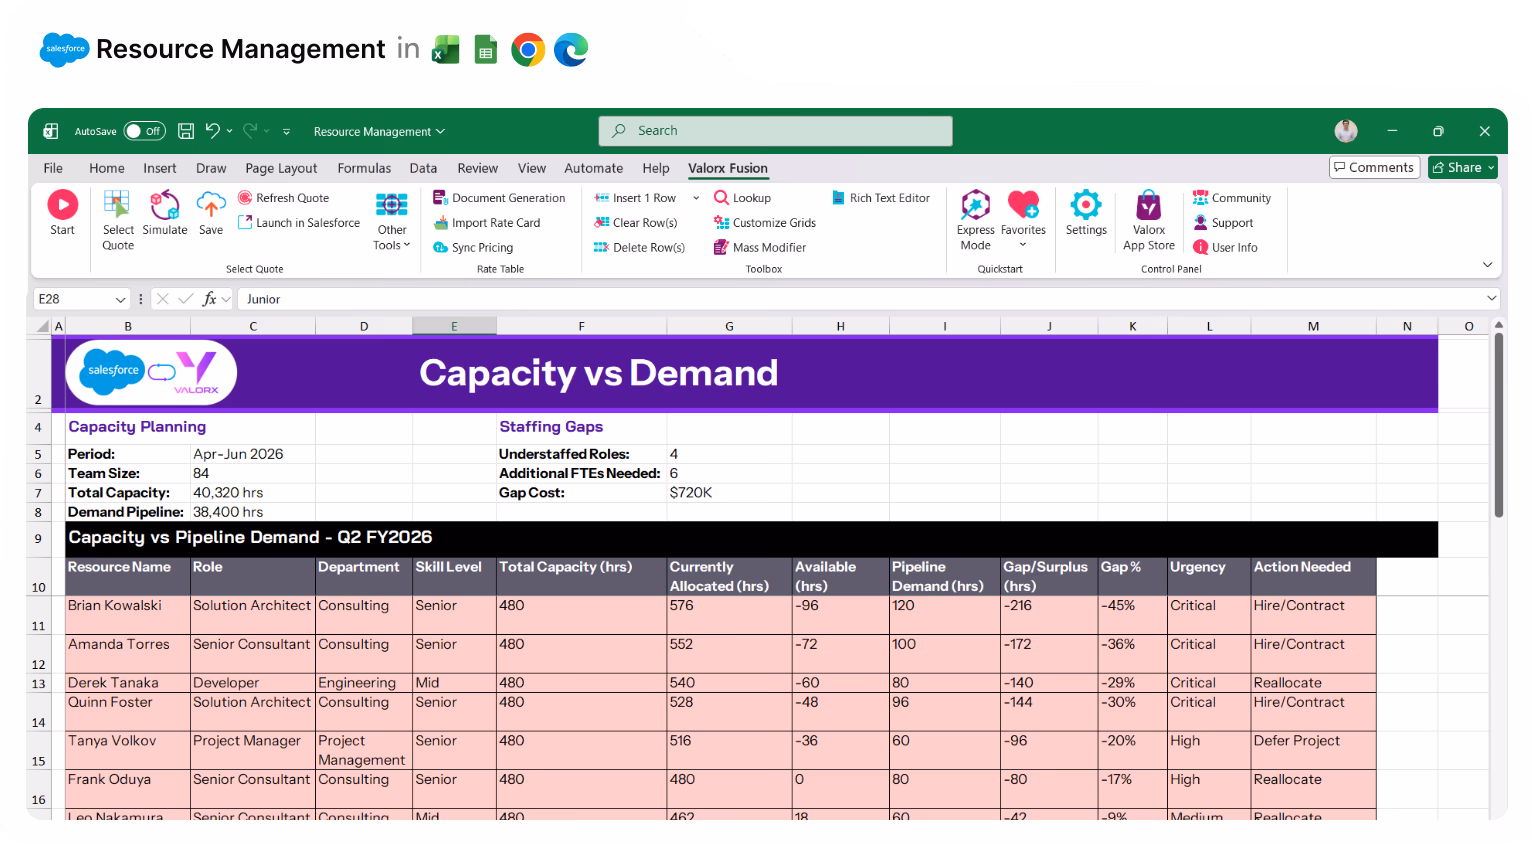
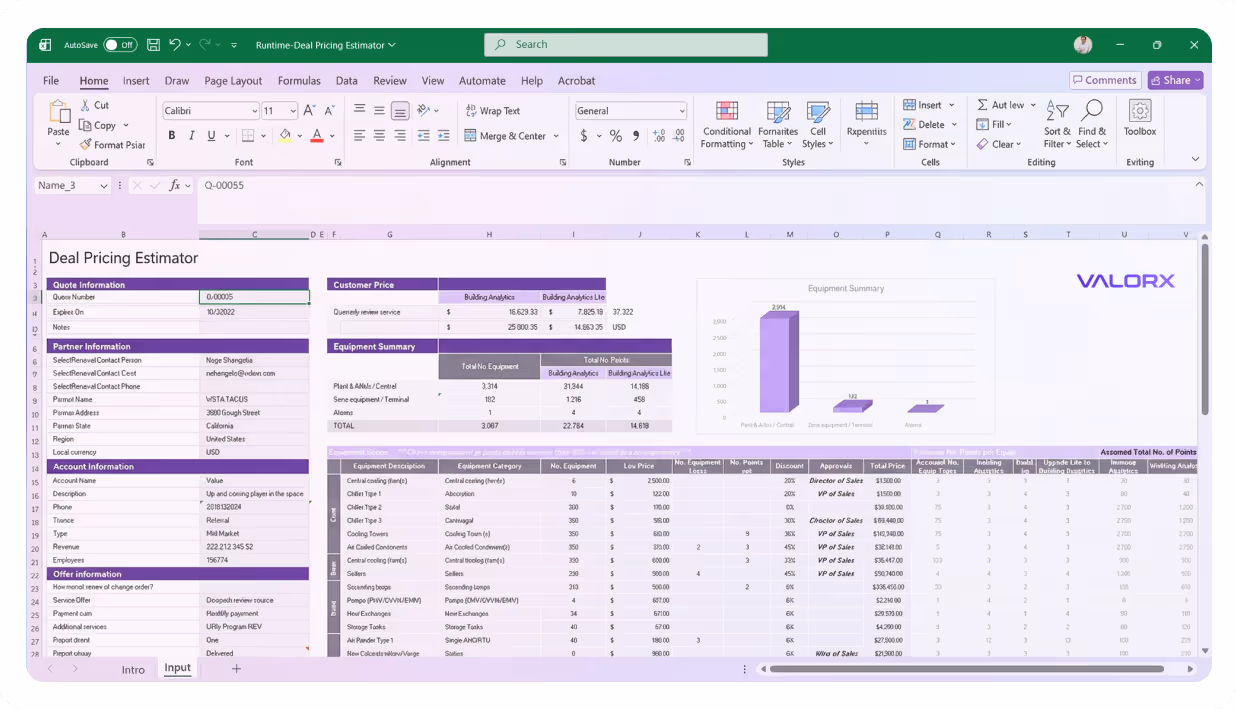
Compare capacity vs. demand side-by-side

See available capacity against incoming project demand. Identify staffing gaps at a glance.
Excel spreadsheet showing a multi-object view of resource management with columns for resource name, title, primary skill, certifications, current project, project account, project type, assignment start/end dates, allocation percentage, utilization percentage, and billable rate.

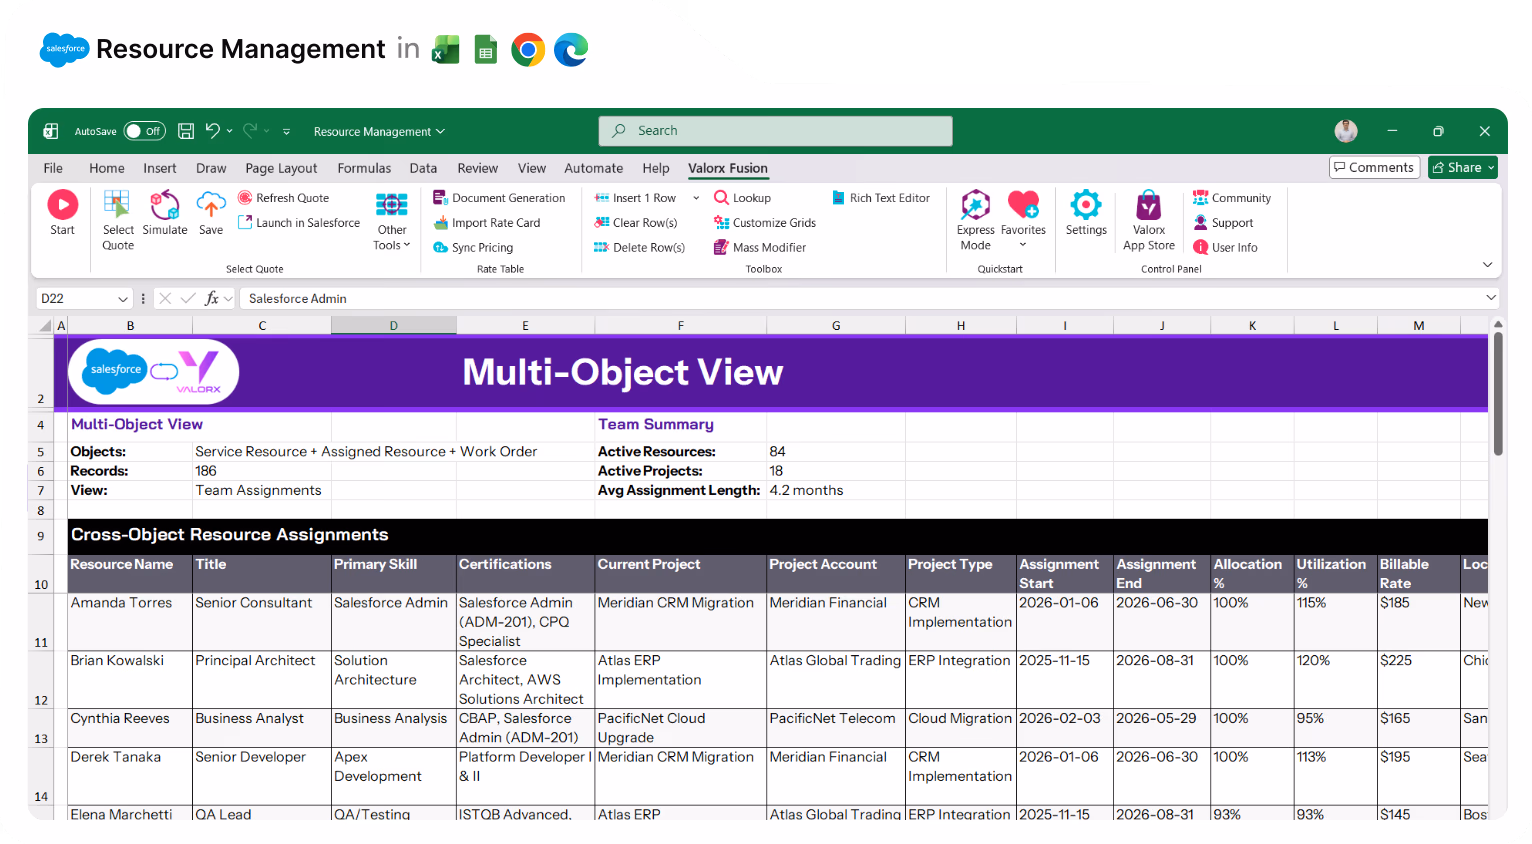
View related data in one place

Resources + Projects + Skills + Assignments together in a single grid.
Excel spreadsheet showing resource reassignment with columns for resource name, role, current and new projects, allocation percentages, dates, conflict check, status, and notes, highlighting a conflict entry in red.

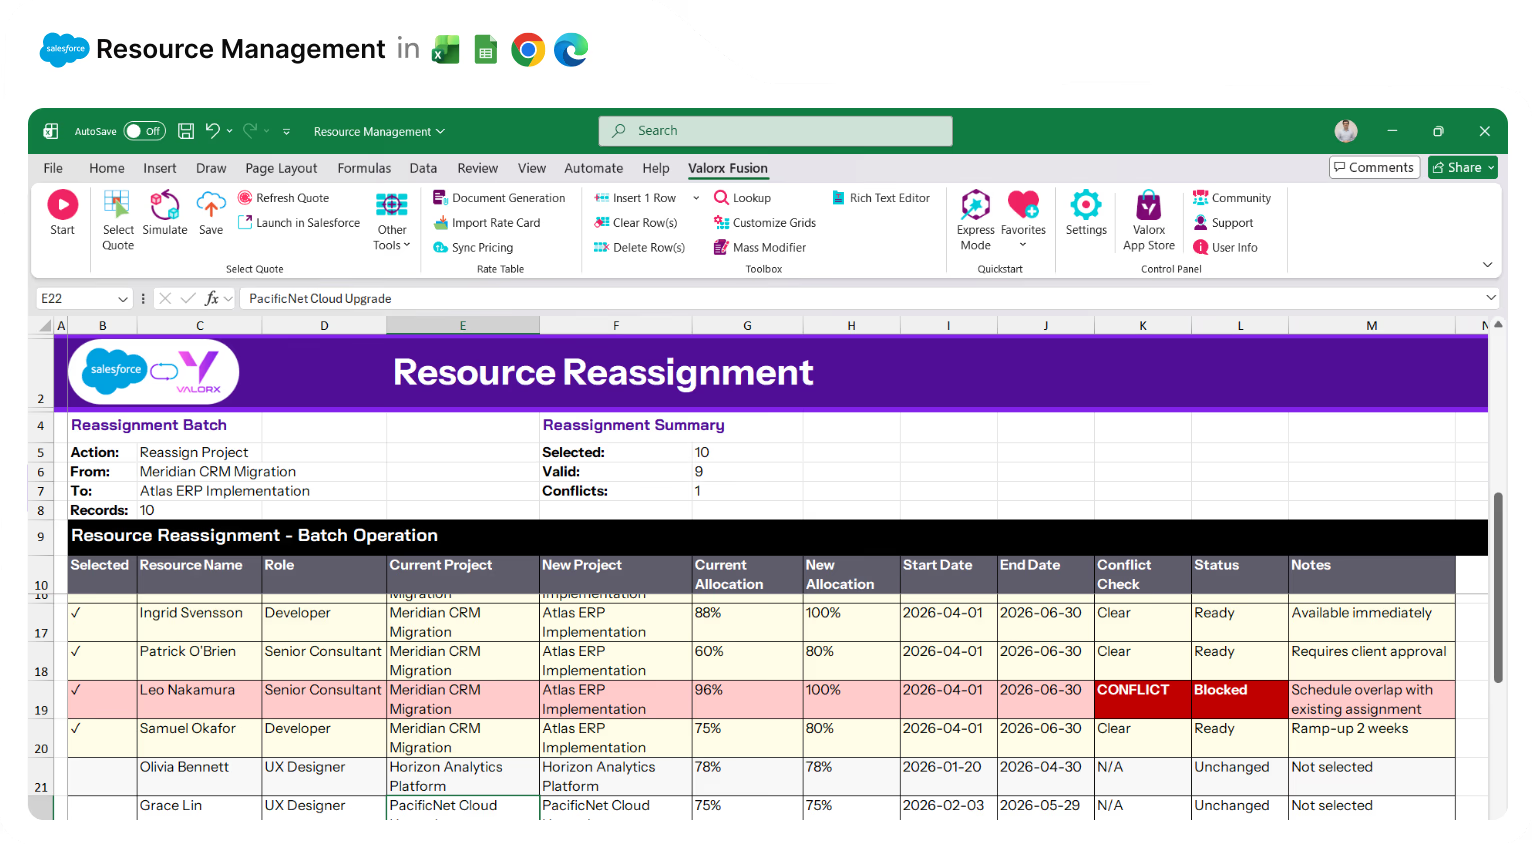
Reassign resources across projects instantly

Select resources, change project assignments, done. Reallocate your team in seconds.
Excel spreadsheet showing Salesforce and Valorx resource staffing actions with columns for resource name, role, project, account, allocation percentage, end date, days remaining, next assignment, status, and available actions.

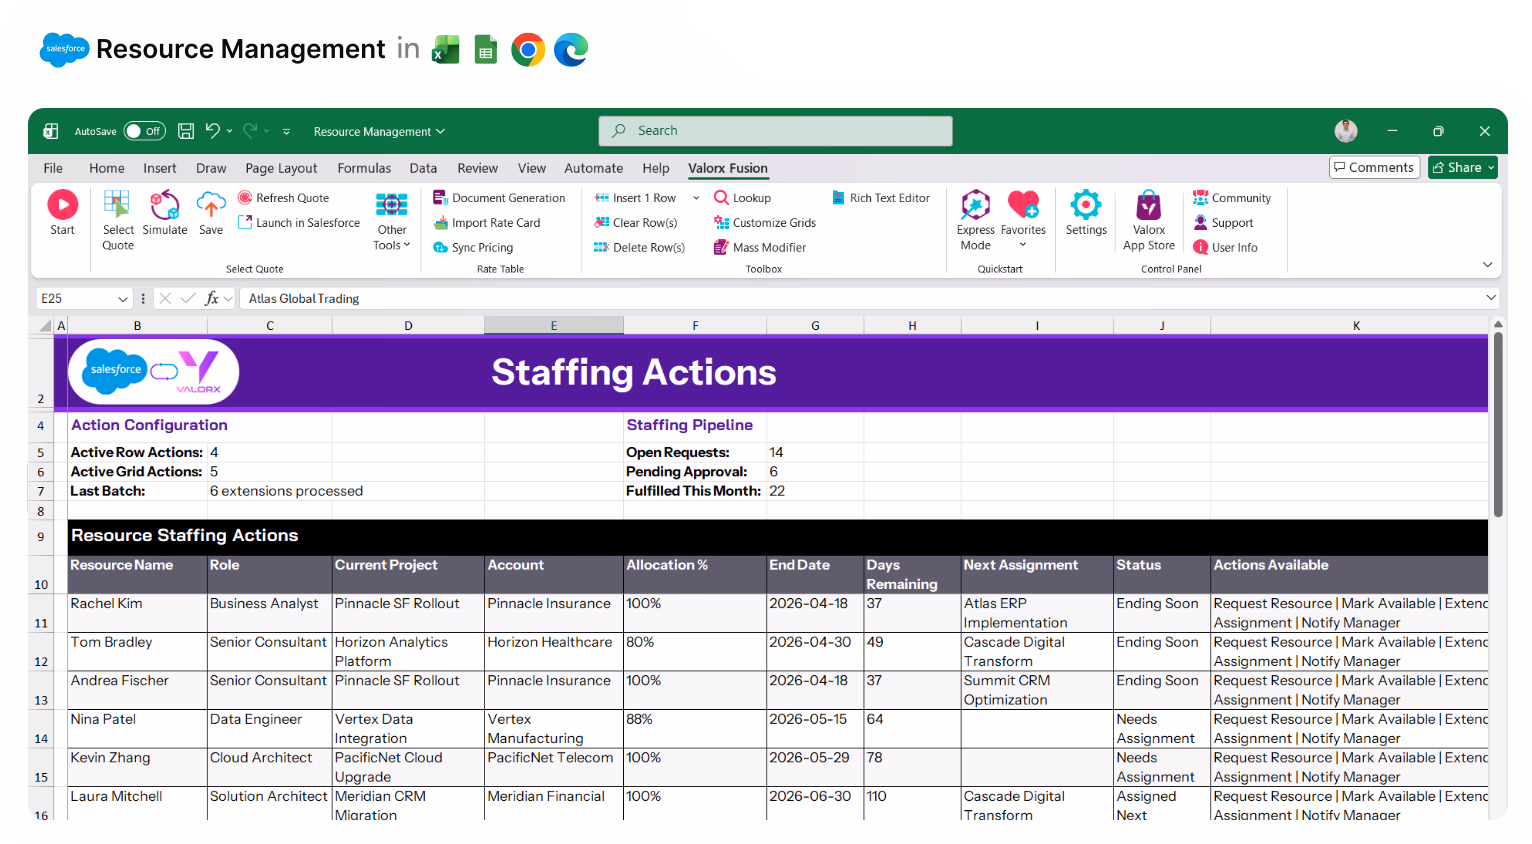
Trigger staffing workflows from the grid

I Request resources, update availability, or run Flows on selected assignments from the grid.
Valorx Wave CRM dashboard displaying a table of opportunity records with columns for Name, Stage, Amount, Close Date, Owner, Opportunity Type, and Account.
Sales agreement table in Valorx Wave showing account details, products, planned quantities, sales prices, and discount percentages for October 25 and November 25.
Valorx Wave sales dashboard showing account details like name, phone, type, and owner, alongside a circular KPI chart with case status breakdown and 147 record count.

Real results from enterprise teams   

Book a demo

100%

data stays in Salesforce

10 x

Faster resource updates

50%

savings in staffing admin
Abstract soft pastel-colored gradient background with blurred lavender, blue, and pink hues.

See what Valorx adds to resource management in Salesforce

Without Valorx
Edit resource assignments one at a time
Utilization data in separate reports
Capacity data in spreadsheets
Related data across tabs
With Valorx
Bulk update allocations across projects
Overloaded resources highlighted in the grid
Capacity vs. demand side-by-side
Resources + Projects + Skills in one grid
Smiling young man with glasses and a beard wearing a black shirt on a light gray circular background with a small purple circle in the top right.
Eric Winston
Service Supervisor
Book a demo
Soft gradient background fading from light gray to pale blue and white.

Built for teams managing resources in Salesforce

Three stylized human figures standing side by side, with gradient blue and green colors on a rounded square white background.

Professional Services

Consultant staffing, billable utilization, project allocation.
Circular silicon wafer with a grid pattern, displaying a gradient of colors from purple to green.

Technology & IT Services

Developer assignments, skill matching, capacity planning.
Icon of a robotic arm with a gradient blue, purple, and green color on a rounded white square background.

Marketing Agencies

Creative team allocation, campaign staffing, workload balancing.
Icon of a translucent cloud with a glowing server stack inside, symbolizing cloud computing or cloud storage.

Field Services

Technician scheduling, territory management, appointment allocation.

Two ways to manage resources in Salesforce

Choose the approach that fits your workflow.
Abstract purple outline of four connected circles inside a rounded square frame on a black background.
Abstract geometric logo featuring a circle above layered semicircles within a rounded square border.
Venn diagram with three overlapping purple circles on a black background.
Purple crescent shapes forming a circle on a black square background with rounded corners.
Purple outline icon of a briefcase inside a rounded square border on a black background.
Abstract black and purple geometric design with layered squares and rounded corners.
Green spreadsheet file icon representing an Excel document on a light background.
Abstract black and purple geometric design with layered squares and rounded corners.
Smiling young man with glasses and a beard wearing a black shirt on a light gray circular background with a small purple circle in the top right.
Eric Winston
Service Supervisor
Book a demo
Icon with three nested rectangles inside a rounded square outline, representing a scaling or resizing concept.
Microsoft Excel app icon with an overlapping white X on a green abstract background.
Purple geometric icon with three nested diamond shapes on a black background.
Three purple abstract human figures representing a group or team on a light background.
Icon with three stacked rounded rectangles in purple outline on a black background.
Abstract purple outline of four connected circles inside a rounded square frame on a black background.
Icon showing four interconnected circles forming a square with a horizontal line extending from the right circle.
Google Chrome web browser logo.
Salesforce logo with white text inside a blue cloud shape.
Abstract geometric design with multiple rounded squares outlined in purple on a black background.
Purple circular abstract icon with overlapping partial rings on a black square background with rounded corners.
Three overlapping purple circles forming a triangular Venn diagram on a black background.
Abstract geometric logo featuring a circle above layered semicircles within a rounded square border.