Salesforce Data Management

Update thousands of records in minutes, not hours. With spreadsheet-style editing that keeps everything in Salesforce.
Excel-based Data Management Dashboard displaying KPIs, records by object in a table and donut chart, and recent operations with user and status details.
CRM Data
USE CASES

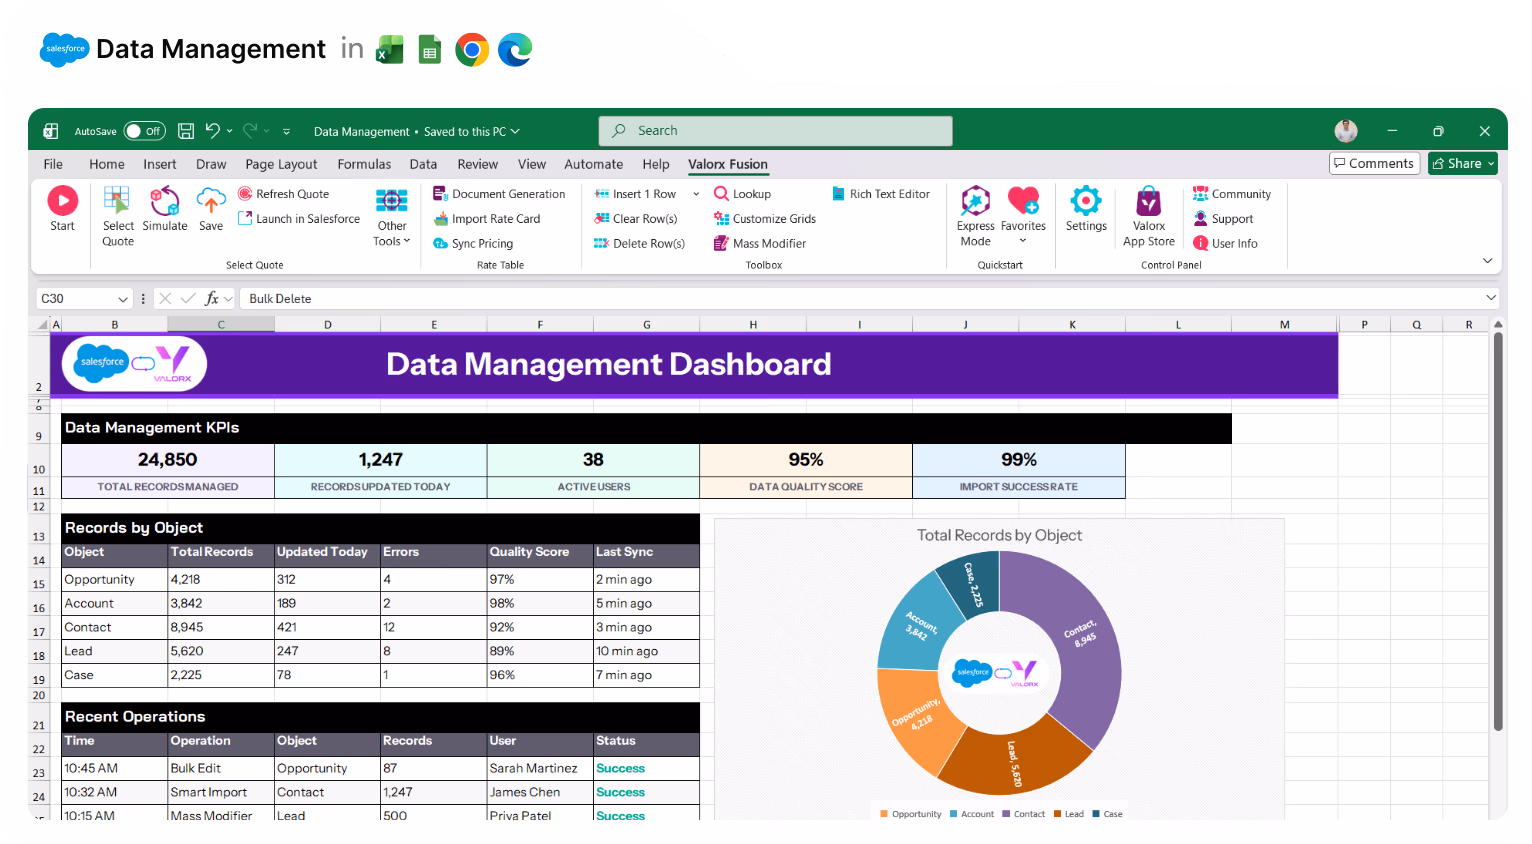
What your Salesforce data management has been missing

Spend less time wrestling with data and more time using it.
Excel spreadsheet titled Bulk Opportunity Editing showing a Salesforce and Valorx integration with data on opportunities, accounts, stages, amounts, close dates, owners, probabilities, next steps, types, lead sources, and last modified dates.

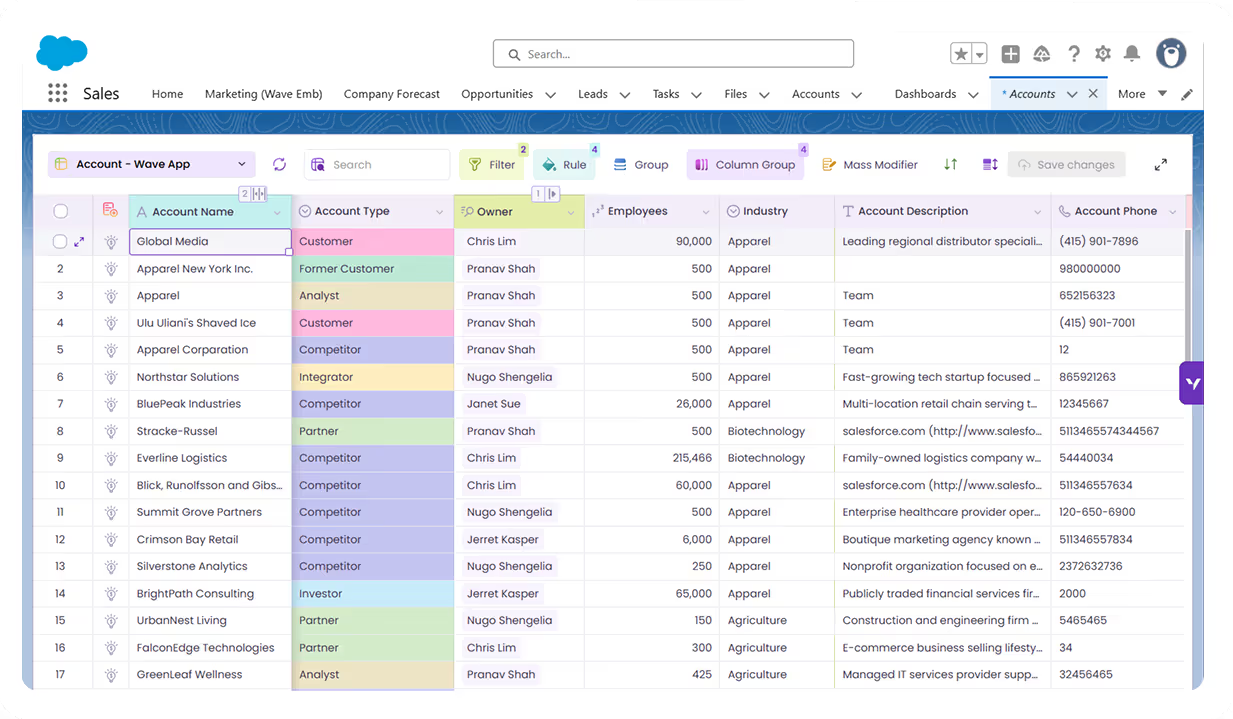
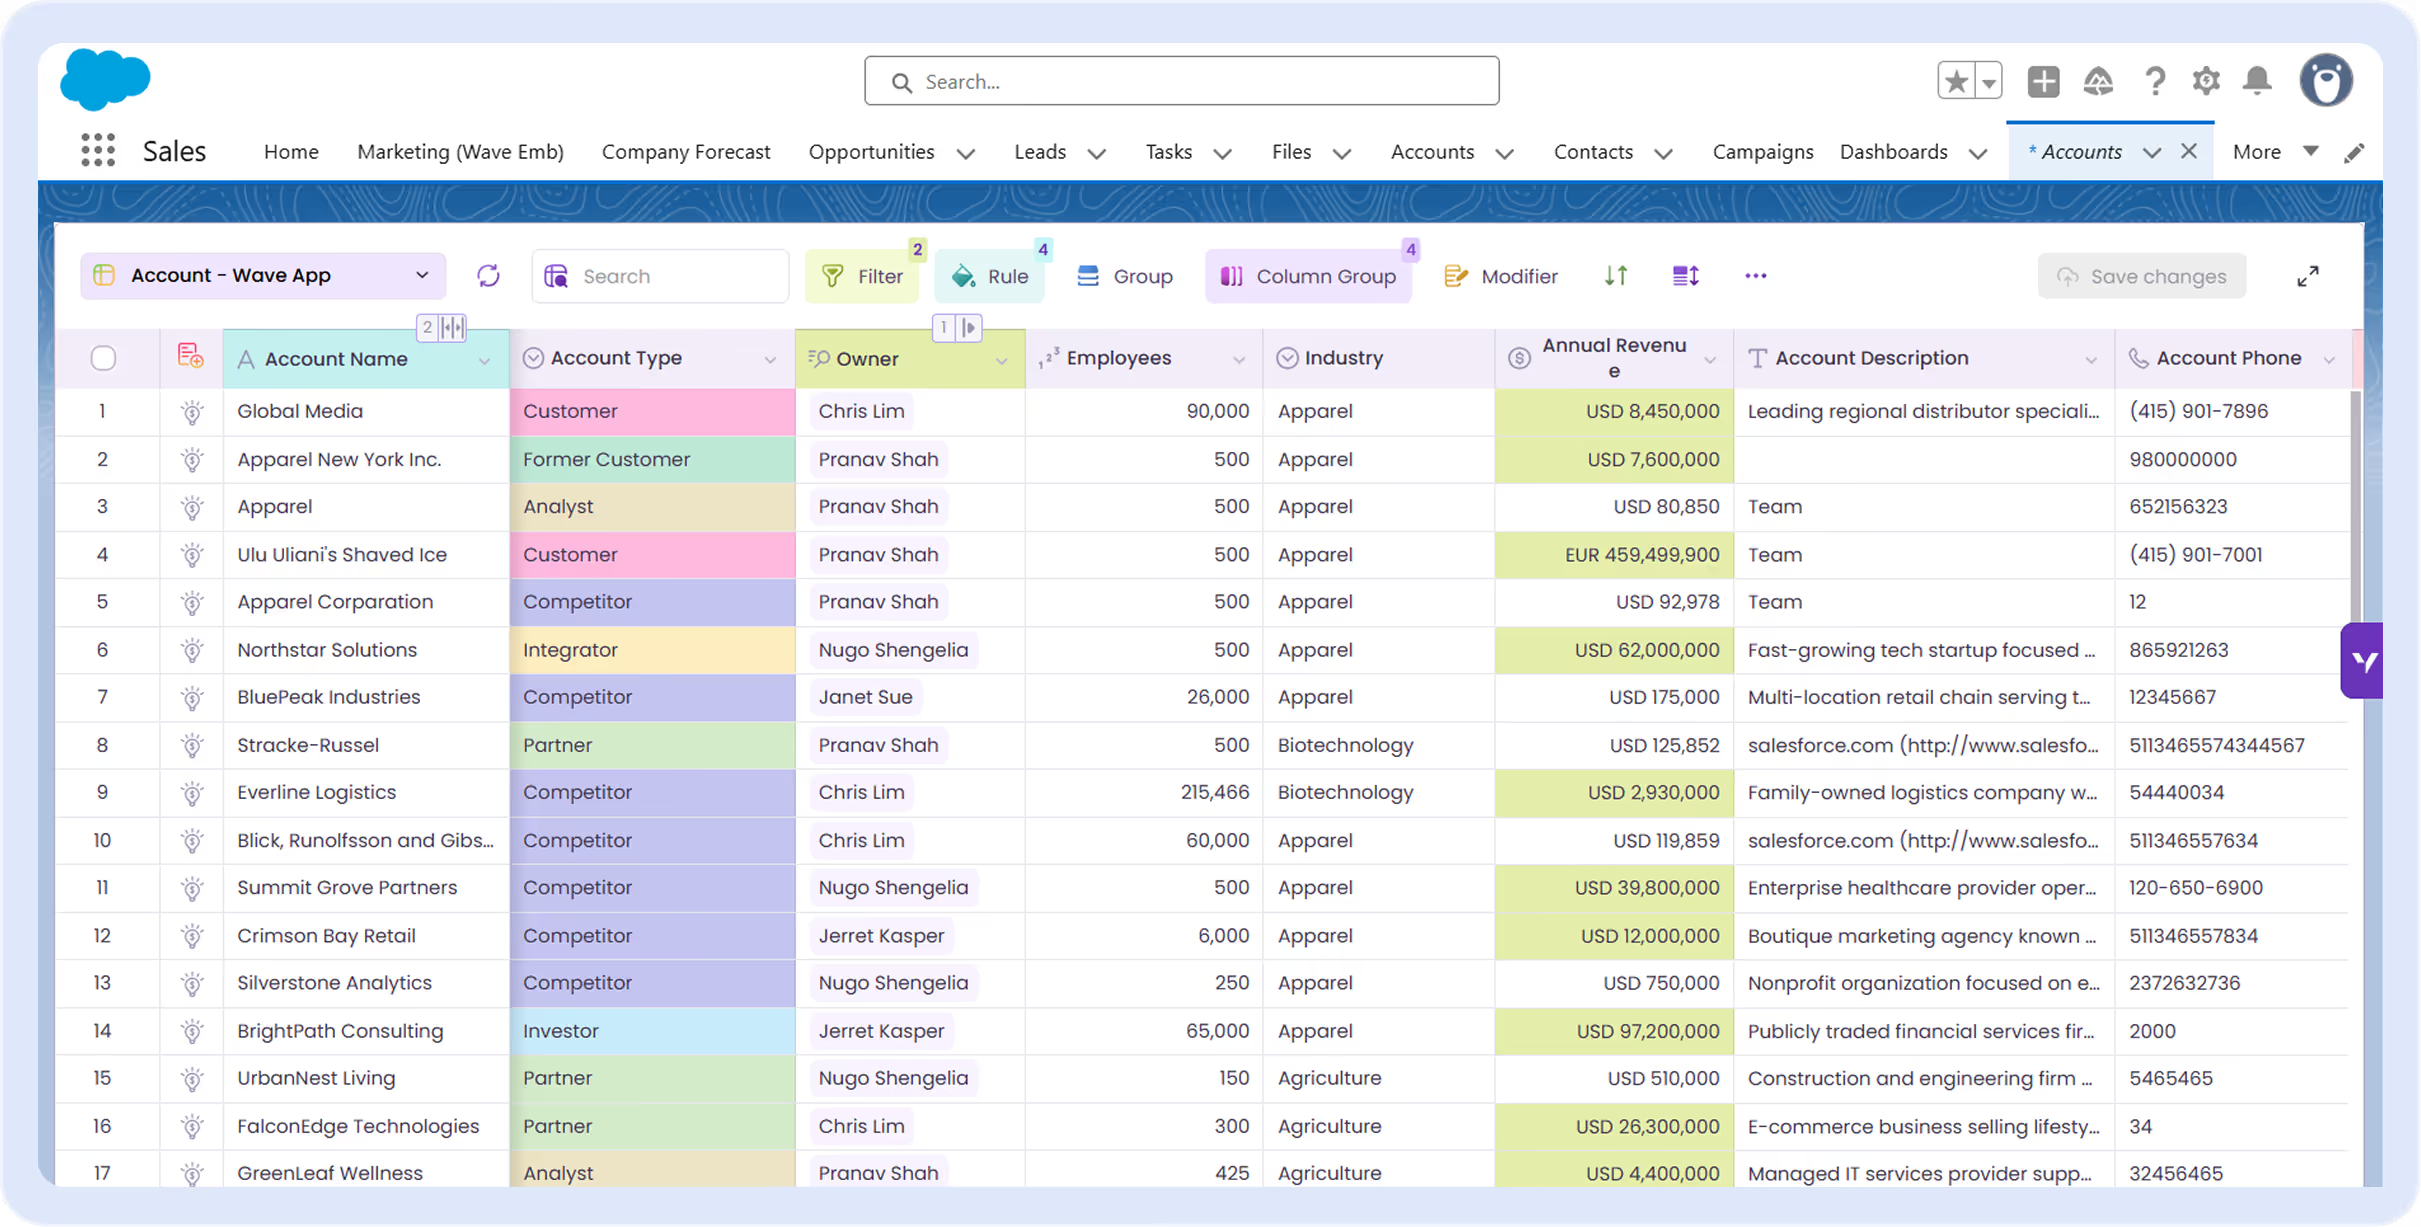
Eliminate shadow spreadsheets

Reps get the spreadsheet experience they want—inside Salesforce, where leadership can see the data. No more pipeline updates stuck in Google Sheets.
Excel spreadsheet titled Mass Modifier showing batch updates for sales opportunities including account names, stages, amounts, close dates, owners, and update statuses.

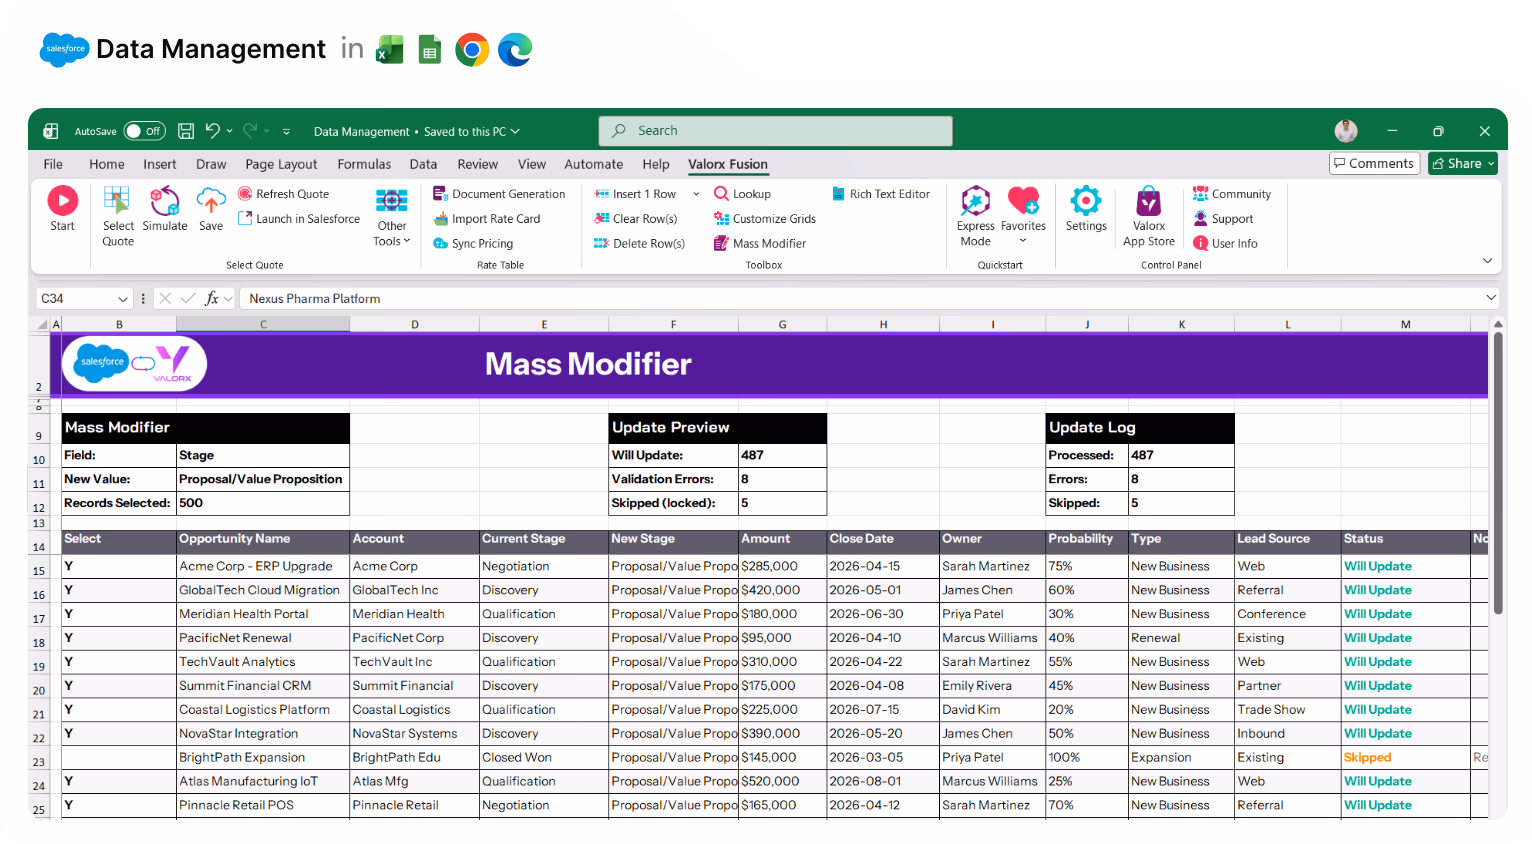
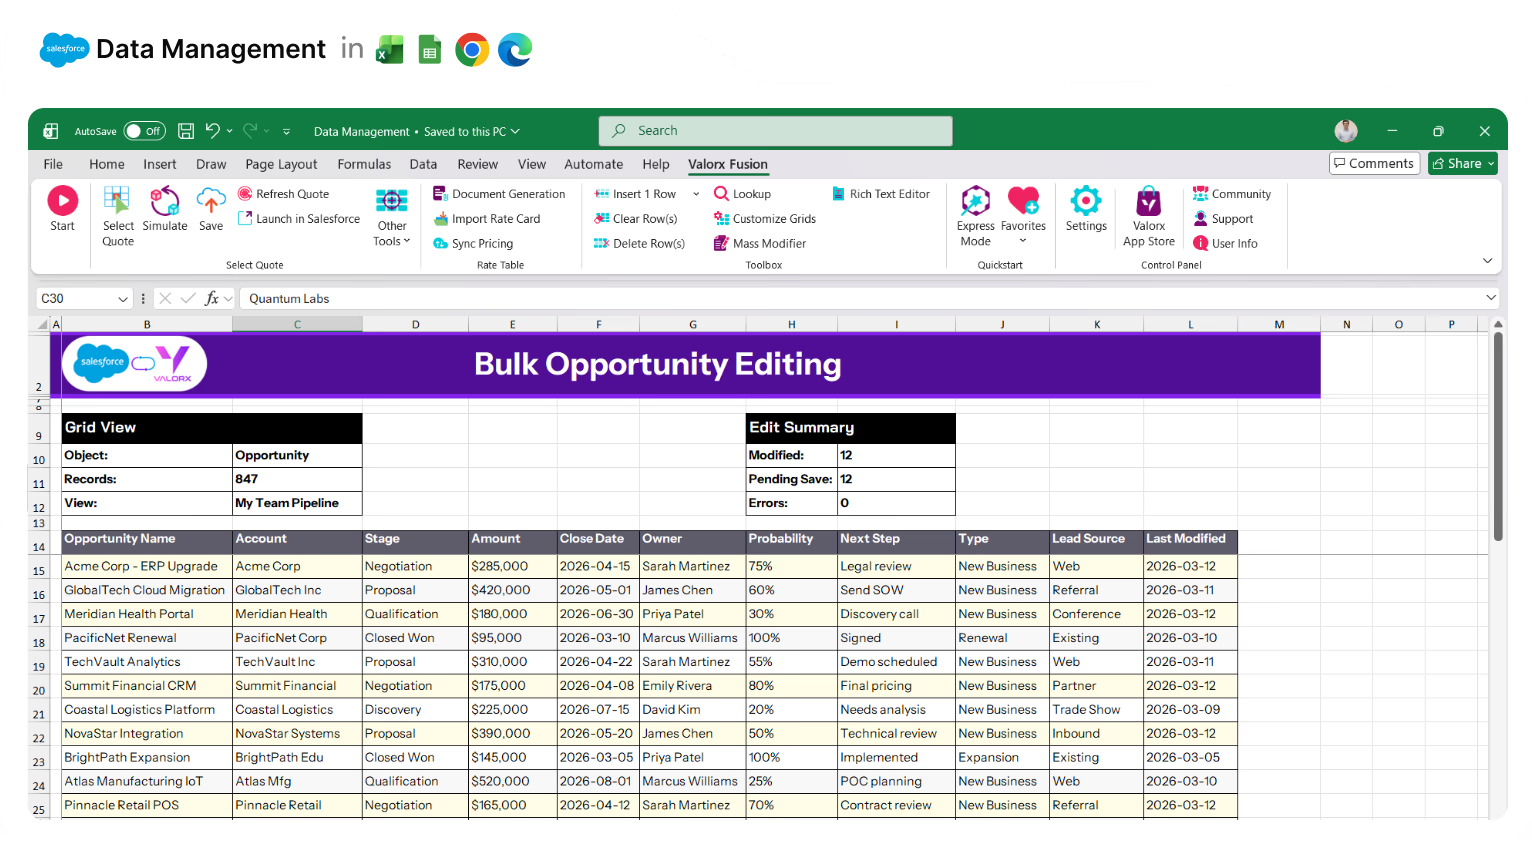
Update records as fast as Excel

Copy/paste, drag to autofill, keyboard shortcuts. Select 500 records and update them all with Mass Modifier—including long text, dependent picklists, and lookups that Salesforce blocks from inline editing.
Excel spreadsheet titled Data Quality Grid showing contact data quality analysis with colored rows indicating clean, duplicate email, missing phone or title, and missing email issues.

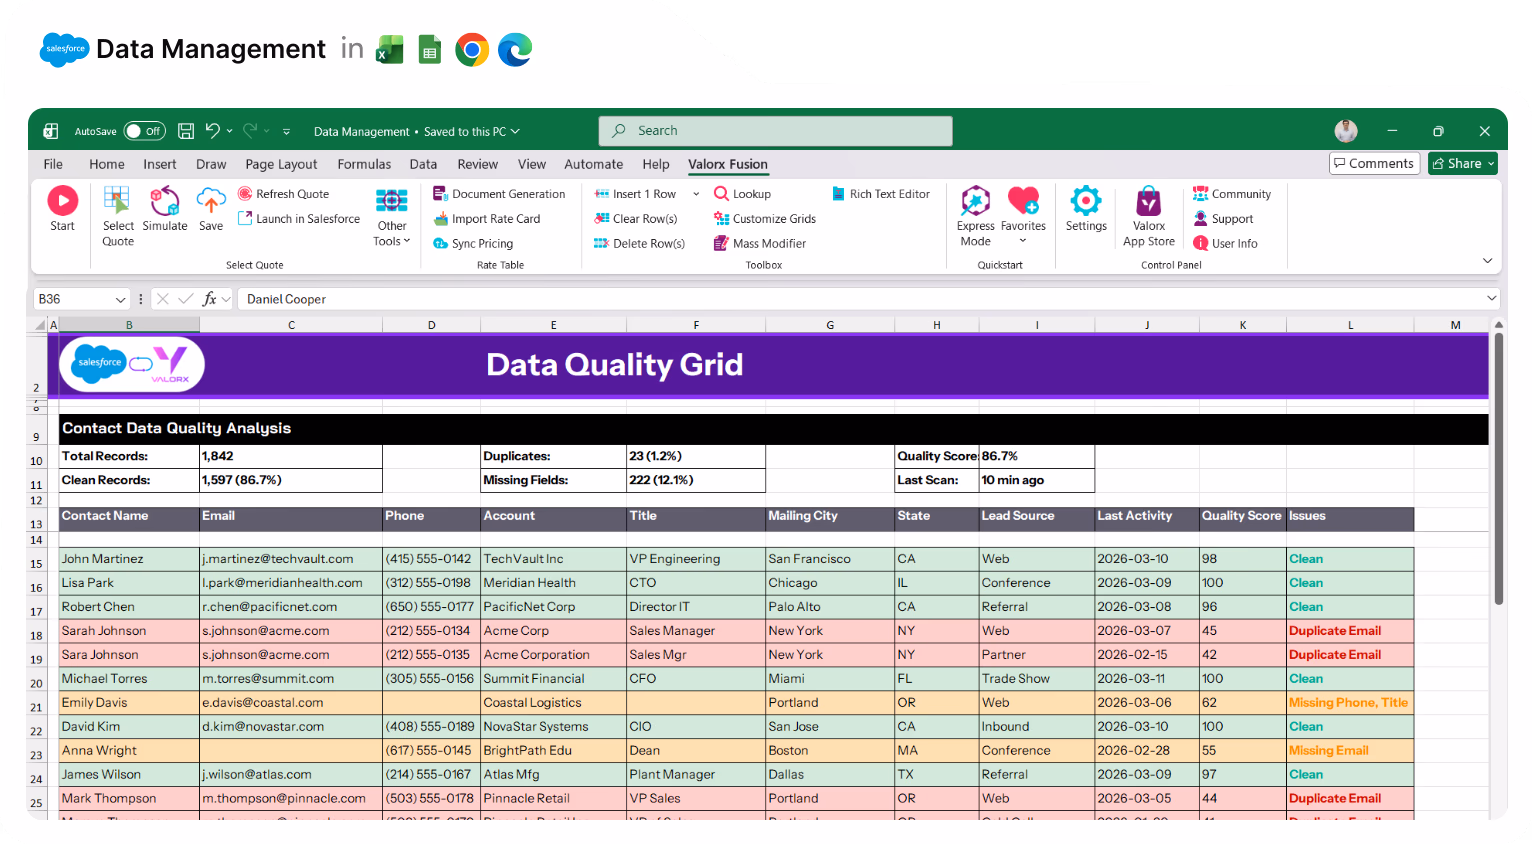
Clean data without the export/import cycle

Spot duplicates and missing fields with conditional formatting. Fix issues inline—no exporting to Excel, cleaning manually, and praying the re-import works.
Excel spreadsheet titled Smart Import showing import configuration, duplicate detection summary, and a table of contacts with columns for first name, last name, email, company, phone, title, city, state, match status, and action.

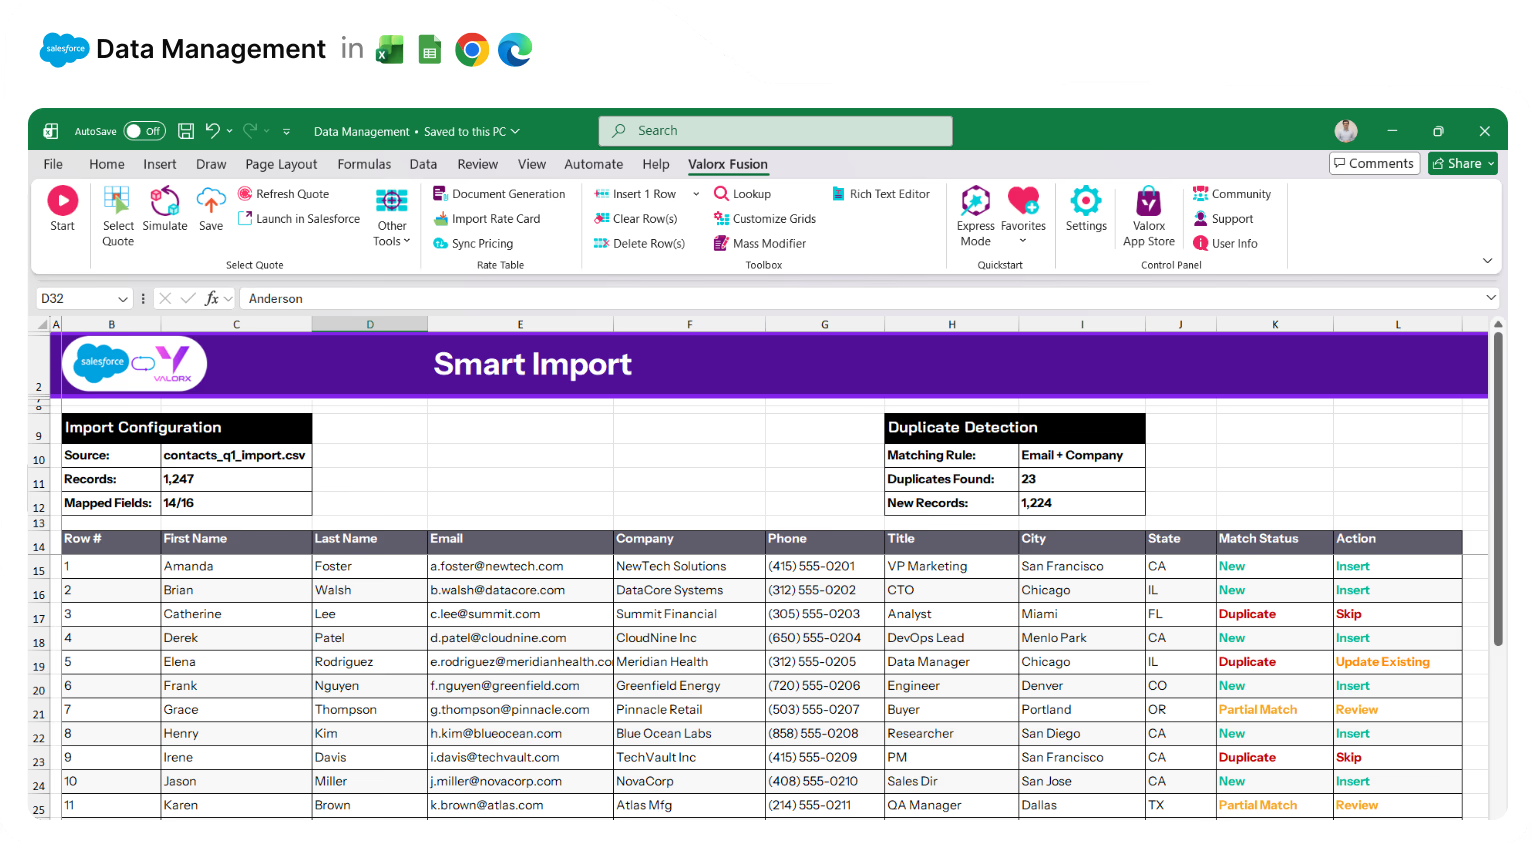
Import data without Data Loader pain

Auto-map fields, preview errors before import, catch duplicates with configurable matching rules. Save mappings for recurring imports. No more fixing error files after the fact.
Excel spreadsheet titled 'Related Records View' showing parent accounts with their industry, annual revenue, employees, owner, rating, and billing city, plus related contacts with contact details, title, department, account name, last activity, and mailing city.

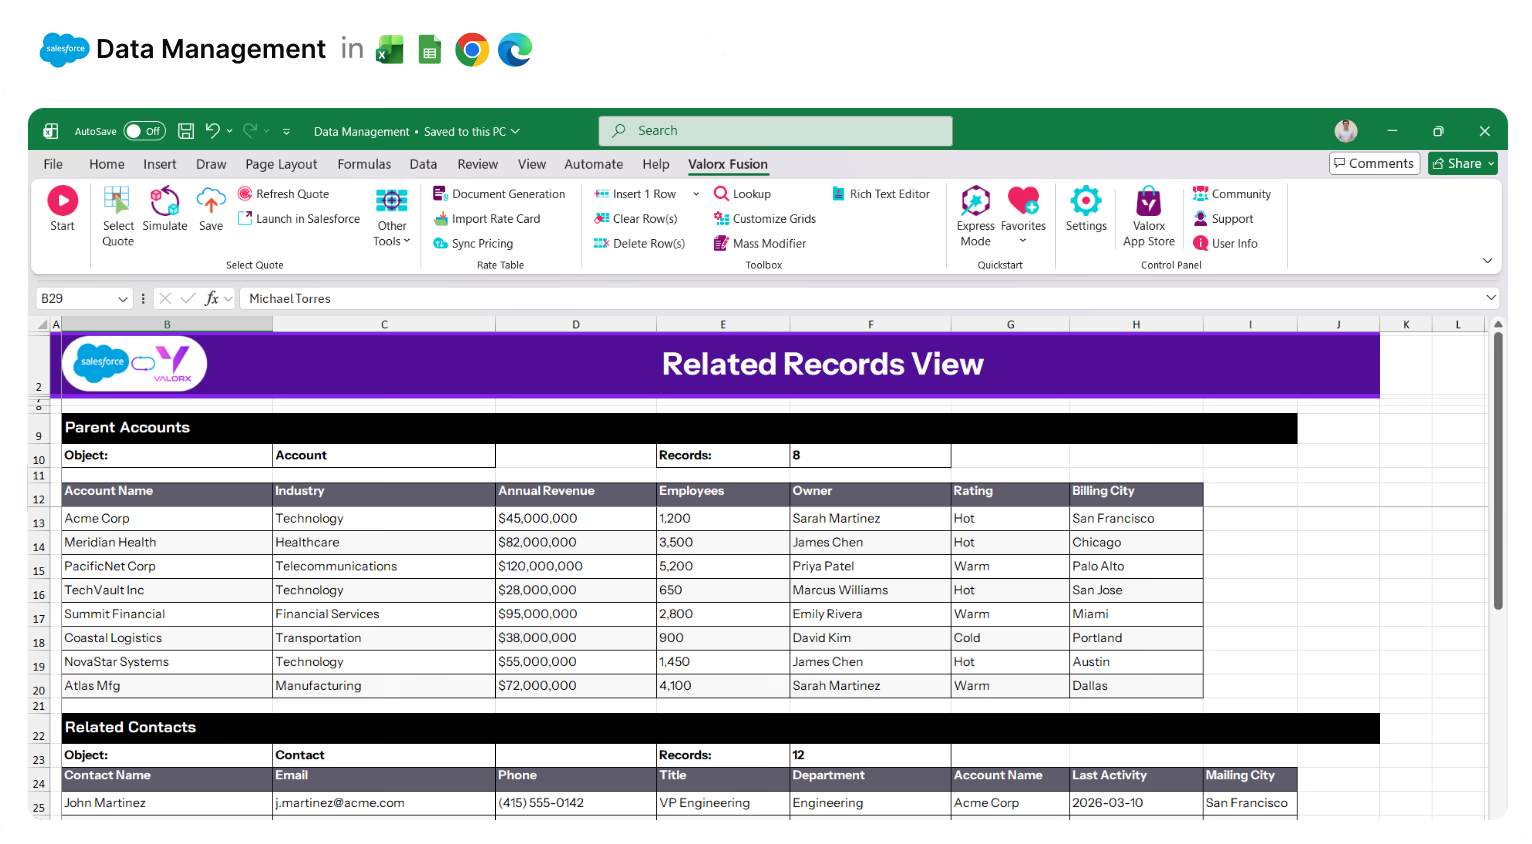
See related records in one view

Accounts, Contacts, and Opportunities together—not spread across tabs. Matrix views connect up to 3 objects. Edit parent and child records without losing context.
Excel spreadsheet showing Multi-Org View with Salesforce and Valorx integration, listing records with account names, industries, annual revenue, employees, owners, org types, last synced dates, and sync statuses including In Sync, Conflict, and Pending.

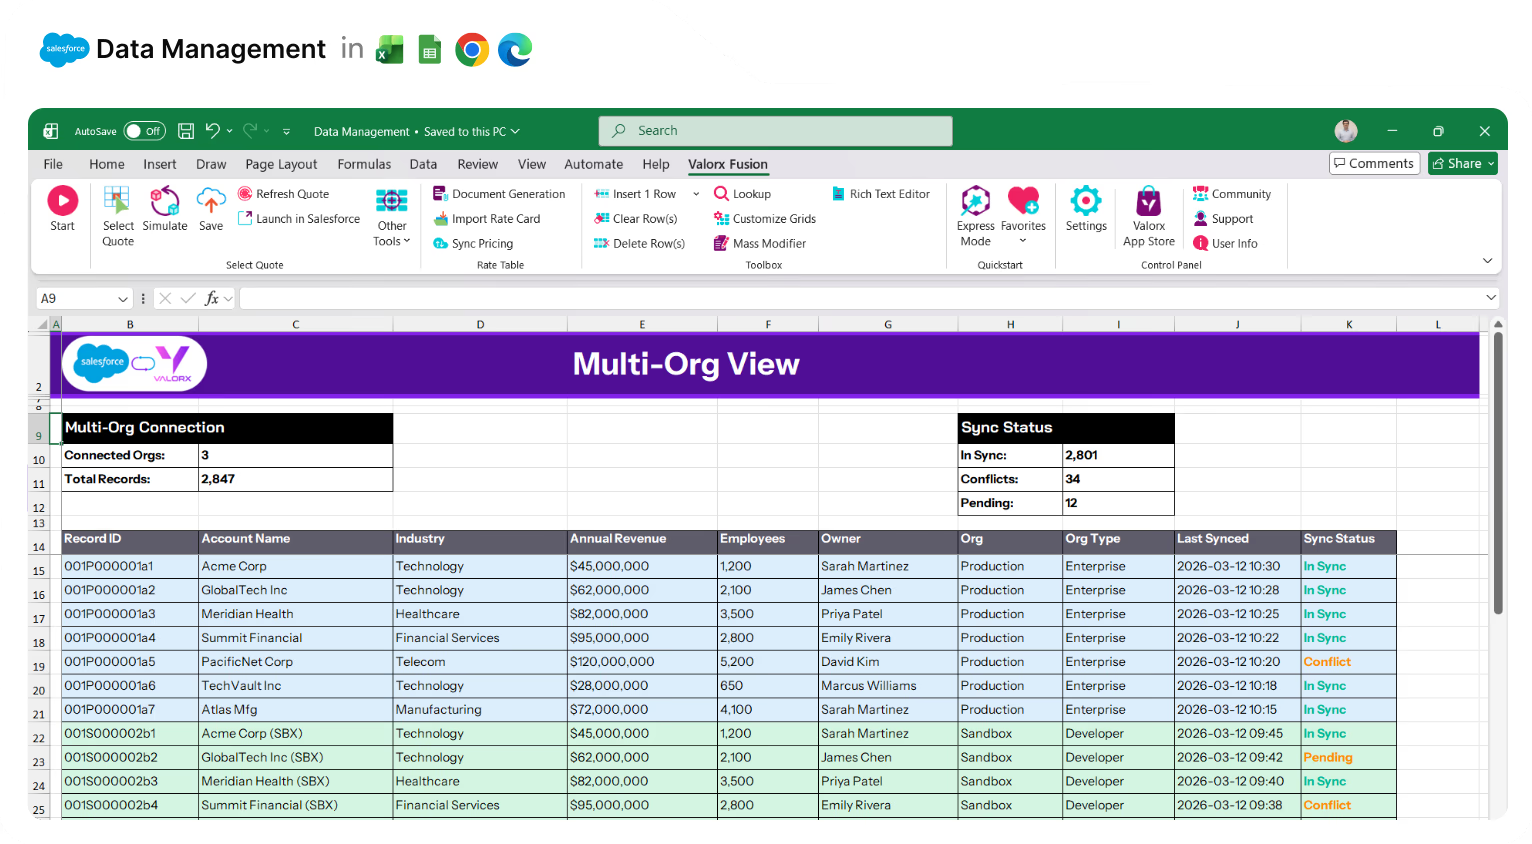
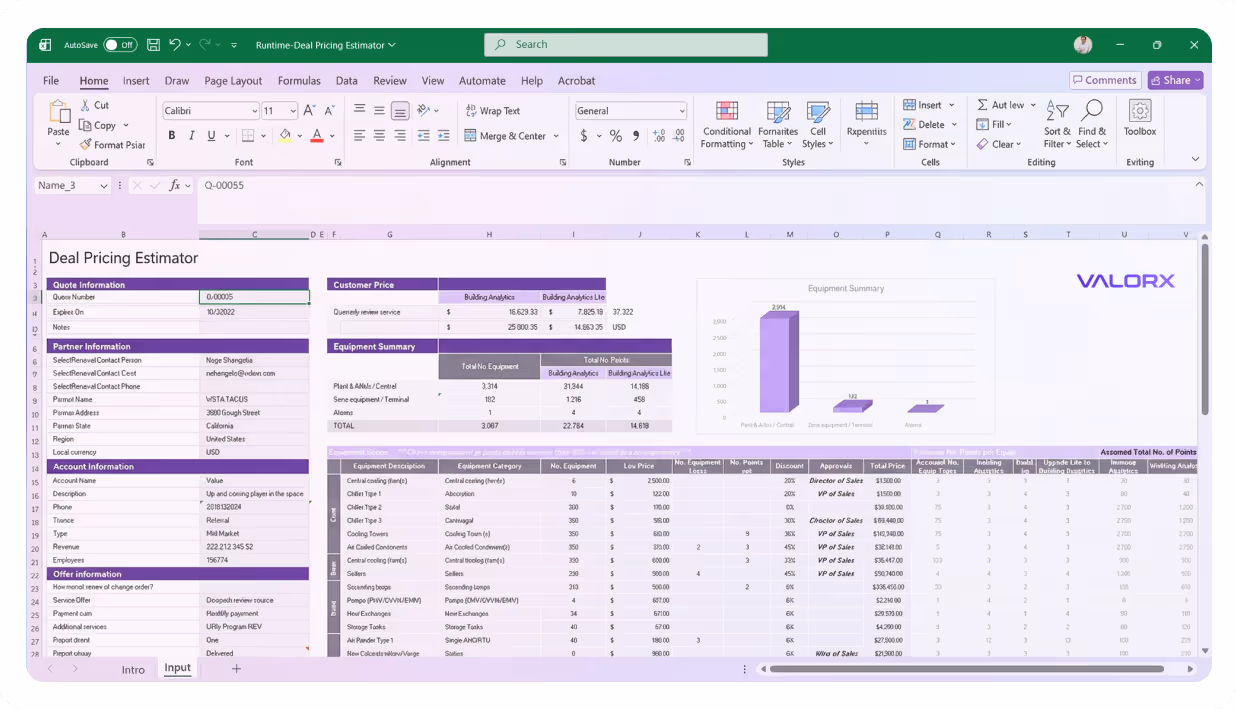
Manage data across multiple orgs

Connect multiple Salesforce instances to one Excel workbook. View, compare, and update data across orgs without middleware or manual consolidation.
Excel spreadsheet with Salesforce and Valorx Fusion integration showing a High-Volume Grid for Opportunity data including columns for Stage, Amount, Close Date, Probability, Owner, and Forecast Category.

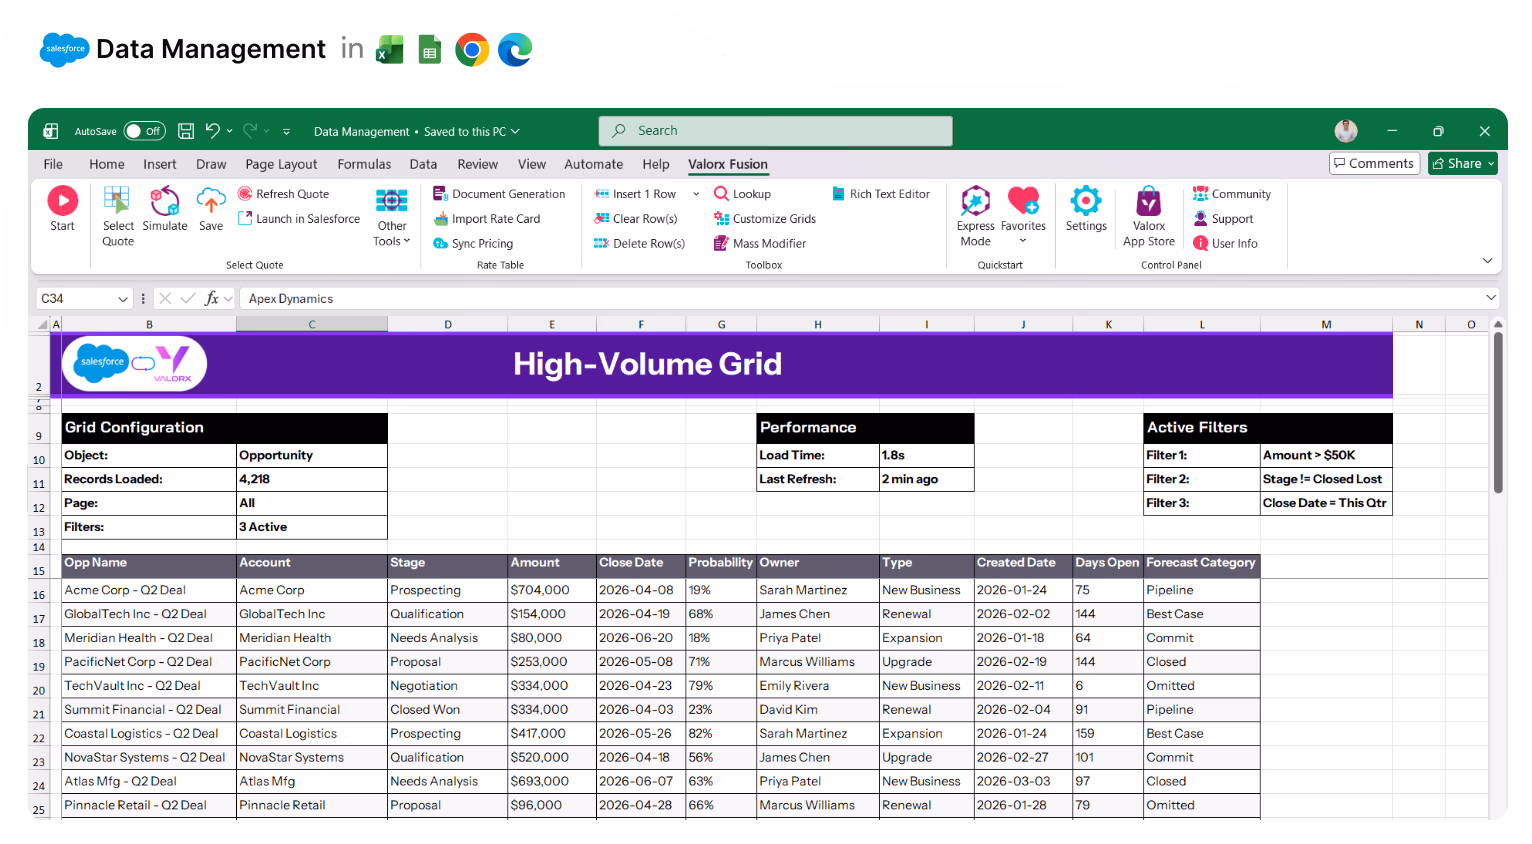
Work with thousands of records at once

No pagination. No 50-record limits. Load the full dataset and work at the scale your business actually requires.
Excel spreadsheet titled 'Grid Permissions' showing a global grid permissions panel with 15 total grids, 38 users, and permission details for various grids including Pipeline Manager, Account Overview, Contact Directory, and others with columns for permission level, add, delete, edit filters, export, creator, and last modified date.

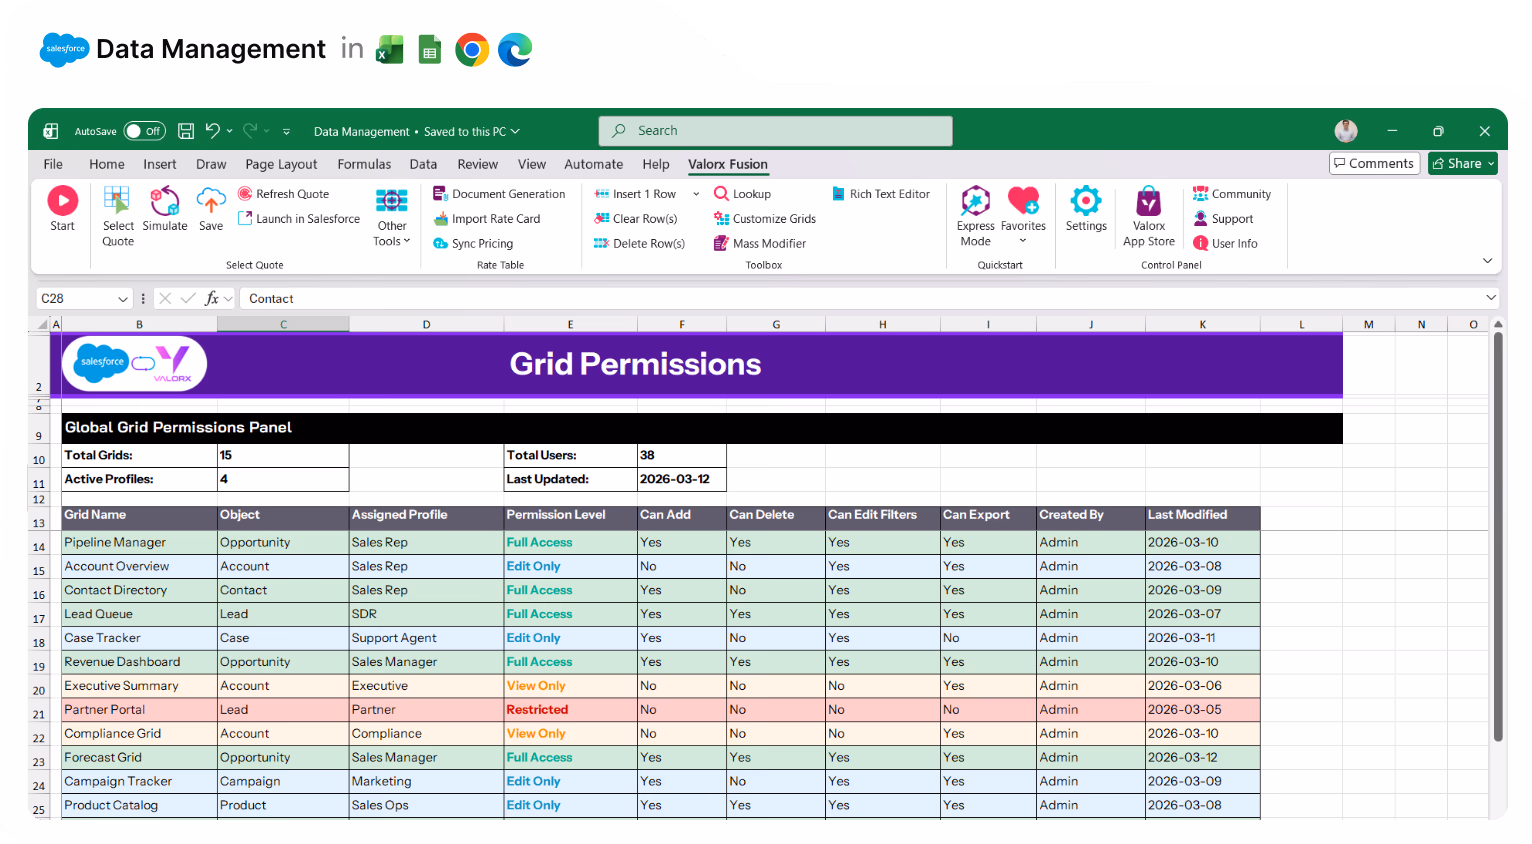
Create governed views for every team

Build a grid once, share it with the right users. Assign by profile or permission set. Control who can edit, delete, or just view—on top of existing Salesforce security.
Excel spreadsheet interface showing Valorx Fusion add-in for Salesforce data management with a table of opportunity records listing account, stage, amount, owner, close date, and available grid actions like Send Quote, Request Approval, Create Task, and Log Call.

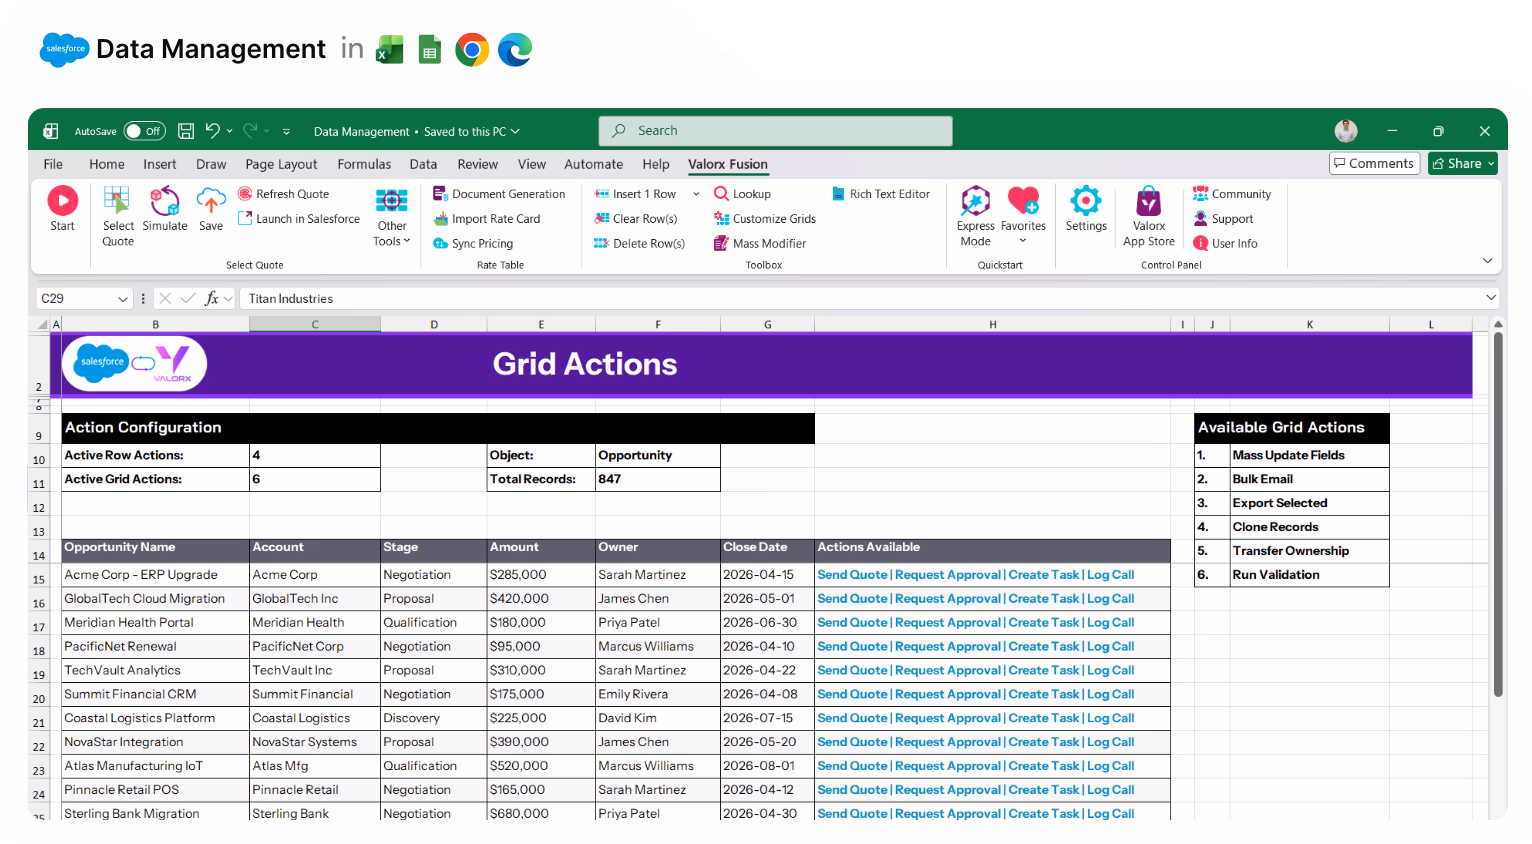
Trigger workflows from the grid

Add Row Actions and Grid Actions that trigger Flows, LWC, or Aura components. Run automations on one record or many—directly from the list view.
Spreadsheet interface showing Salesforce and Valorx integration with a report-to-grid displaying sales opportunities by rep, including details like account, stage, amount, close date, and forecast category.

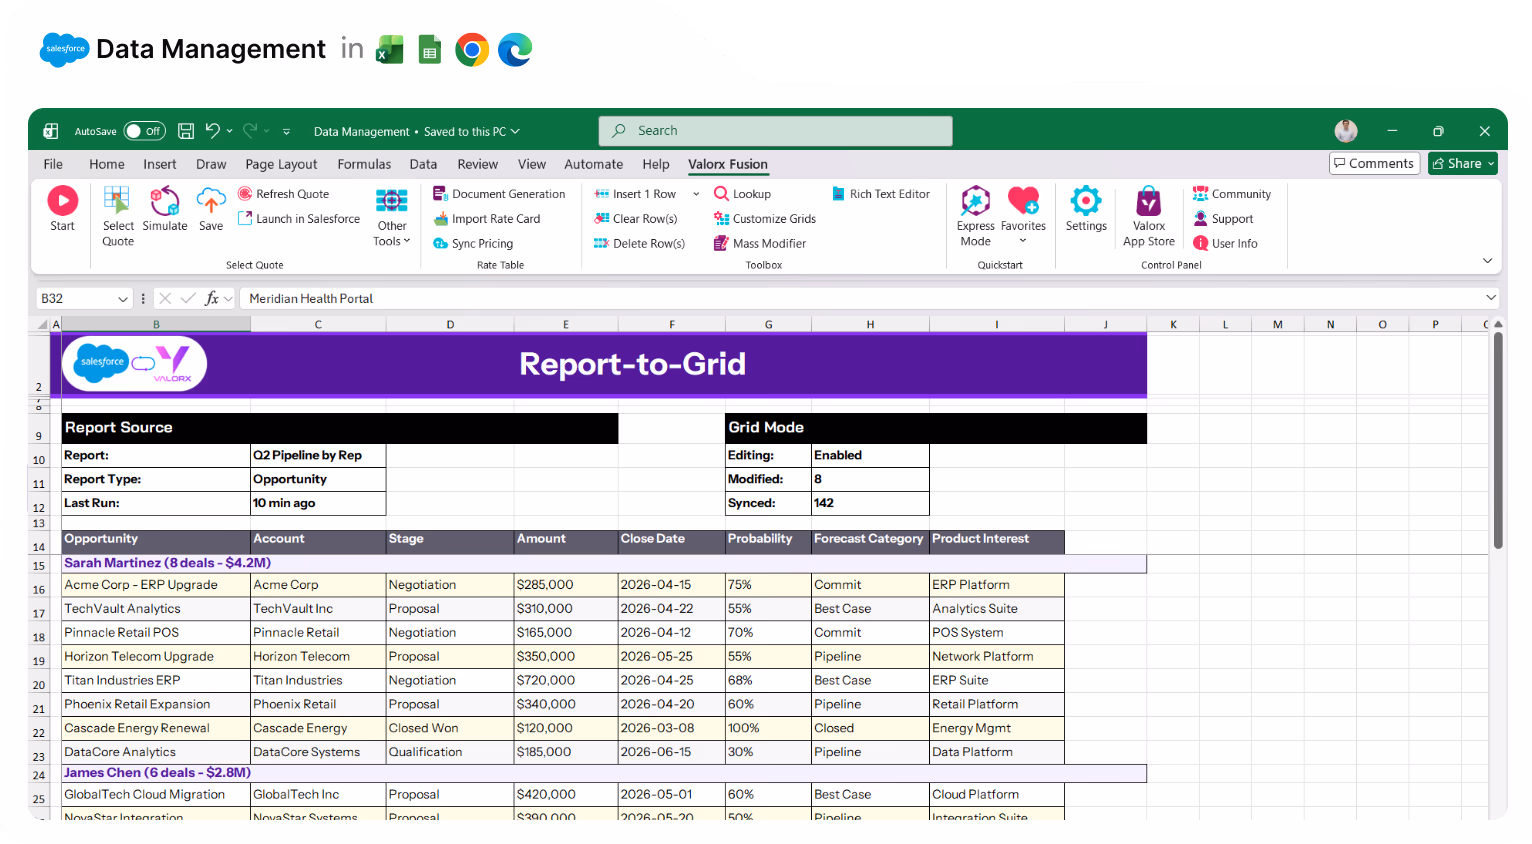
Edit records directly from reports

Turn any Salesforce report into an editable grid. Find the problem records and fix them in place—no drilling into each one.
Valorx Wave CRM dashboard displaying a table of opportunity records with columns for Name, Stage, Amount, Close Date, Owner, Opportunity Type, and Account.
Sales agreement table in Valorx Wave showing account details, products, planned quantities, sales prices, and discount percentages for October 25 and November 25.
Valorx Wave sales dashboard showing account details like name, phone, type, and owner, alongside a circular KPI chart with case status breakdown and 147 record count.

Real results from enterprise teams   

Book a demo

<=14 days

from contract to production

5-10x

Faster data updates

0

shadow spreadsheets
Abstract soft pastel-colored gradient background with blurred lavender, blue, and pink hues.

See what Valorx adds to Salesforce data management

Everything you wish Salesforce list views could do.
Without Valorx
Spreadsheets outside Salesforce
Record-by-record editing
Export → clean → re-import
Data Loader errors after import
With Valorx
Spreadsheet experience inside Salesforce
Bulk edit hundreds at once
Fix inline with conditional formatting
Preview errors before save
Smiling young man with glasses and a beard wearing a black shirt on a light gray circular background with a small purple circle in the top right.
Eric Winston
Service Supervisor
Book a demo
Soft gradient background fading from light gray to pale blue and white.

Two ways to work, one goal: better data in Salesforce

Choose the approach that fits your workflow.
Abstract purple outline of four connected circles inside a rounded square frame on a black background.
Abstract geometric logo featuring a circle above layered semicircles within a rounded square border.
Venn diagram with three overlapping purple circles on a black background.
Purple crescent shapes forming a circle on a black square background with rounded corners.
Purple outline icon of a briefcase inside a rounded square border on a black background.
Abstract black and purple geometric design with layered squares and rounded corners.
Green spreadsheet file icon representing an Excel document on a light background.
Abstract black and purple geometric design with layered squares and rounded corners.
Smiling young man with glasses and a beard wearing a black shirt on a light gray circular background with a small purple circle in the top right.
Eric Winston
Service Supervisor
Book a demo
Icon with three nested rectangles inside a rounded square outline, representing a scaling or resizing concept.
Microsoft Excel app icon with an overlapping white X on a green abstract background.
Purple geometric icon with three nested diamond shapes on a black background.
Three purple abstract human figures representing a group or team on a light background.
Icon with three stacked rounded rectangles in purple outline on a black background.
Abstract purple outline of four connected circles inside a rounded square frame on a black background.
Icon showing four interconnected circles forming a square with a horizontal line extending from the right circle.
Google Chrome web browser logo.
Salesforce logo with white text inside a blue cloud shape.
Abstract geometric design with multiple rounded squares outlined in purple on a black background.
Purple circular abstract icon with overlapping partial rings on a black square background with rounded corners.
Three overlapping purple circles forming a triangular Venn diagram on a black background.
Abstract geometric logo featuring a circle above layered semicircles within a rounded square border.