The spreadsheets you love meets the Salesforce data you need
Build pricing models, forecasts, and use your existing spreadsheets - connected directly to Salesforce.
Enhancing Salesforce for industry leaders


USE CASES
Why Fusion?
Bridge the gap between CRM and spreadsheets for seamless workflows.

35+
Fortune 500 Customers

One
Source of Truth

100%
Data Stays in Salesforce

10x
Faster Forecast Updates
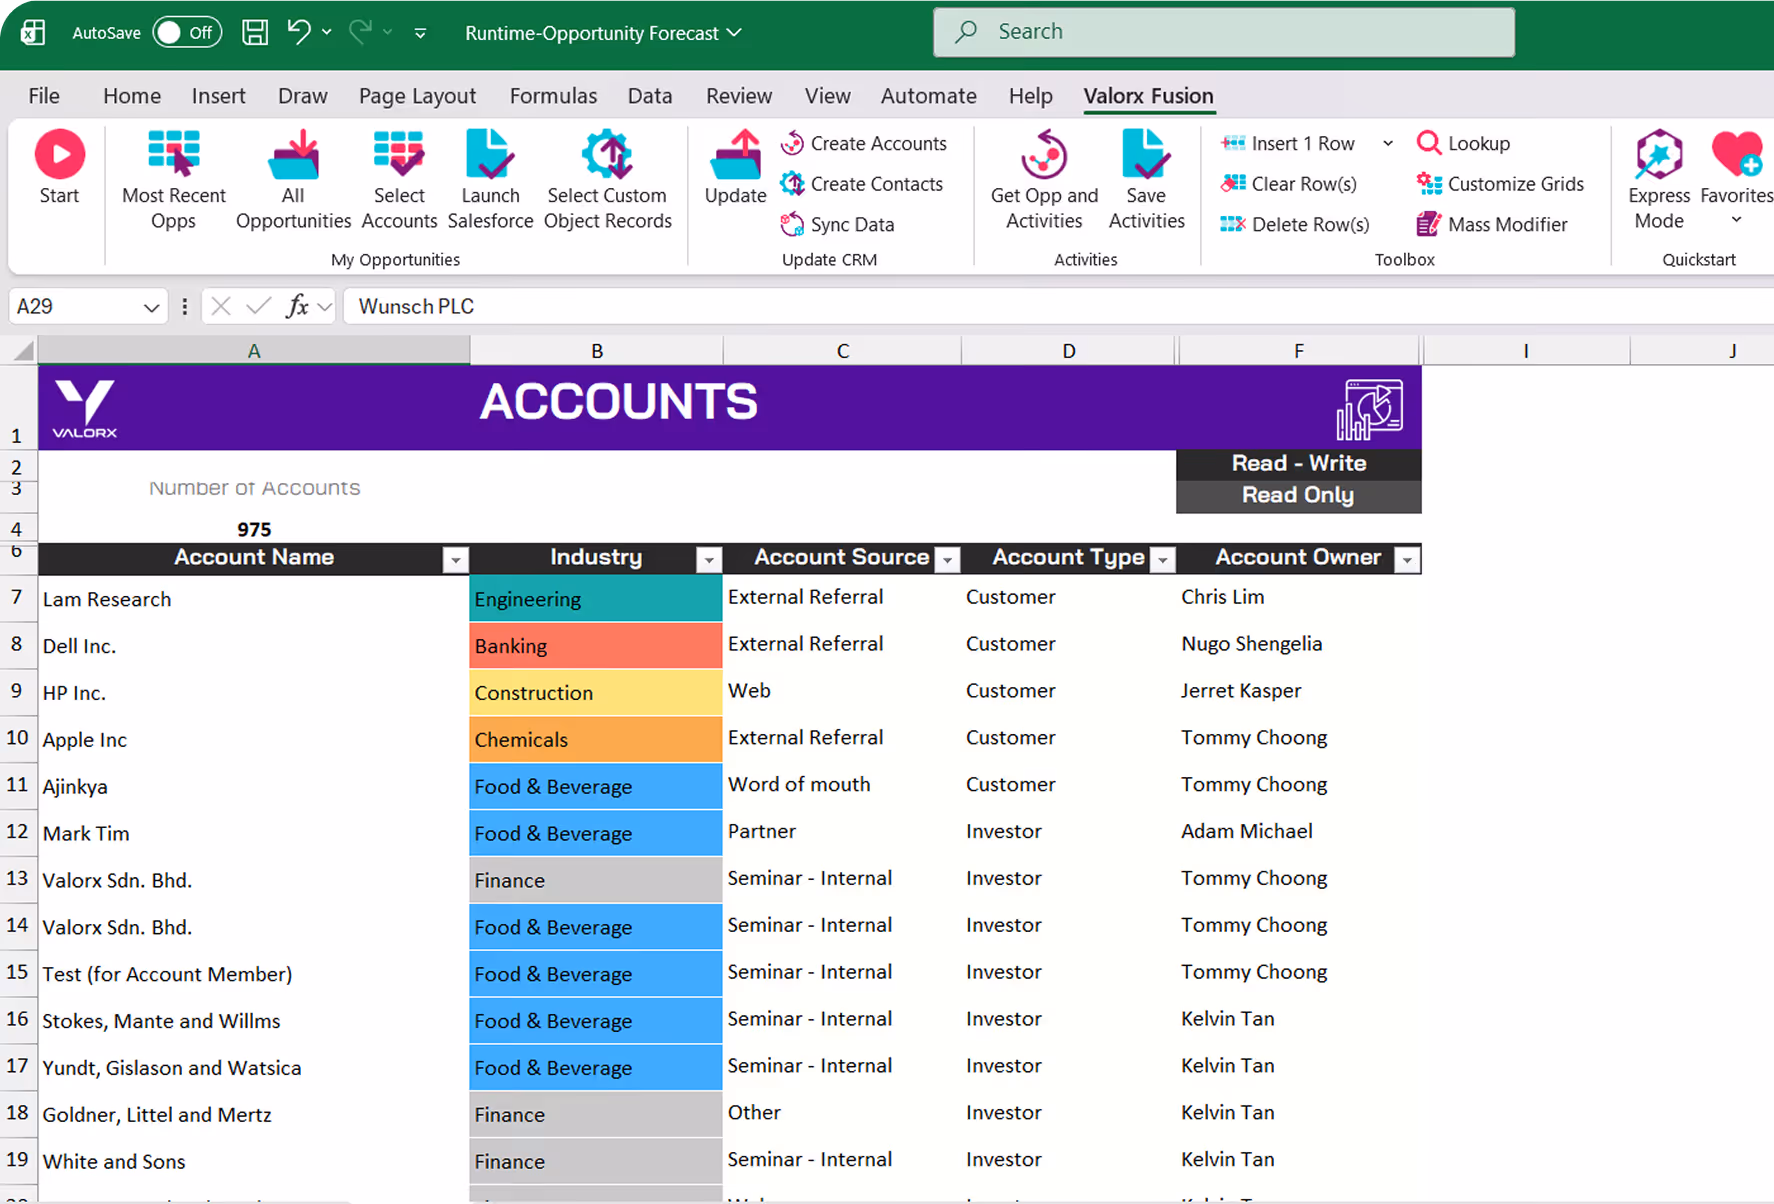
Live Salesforce Data in Your Spreadsheets
Update, analyze, and save Salesforce records without leaving your existing spreadsheets. Maintain full Salesforce security.
Learn more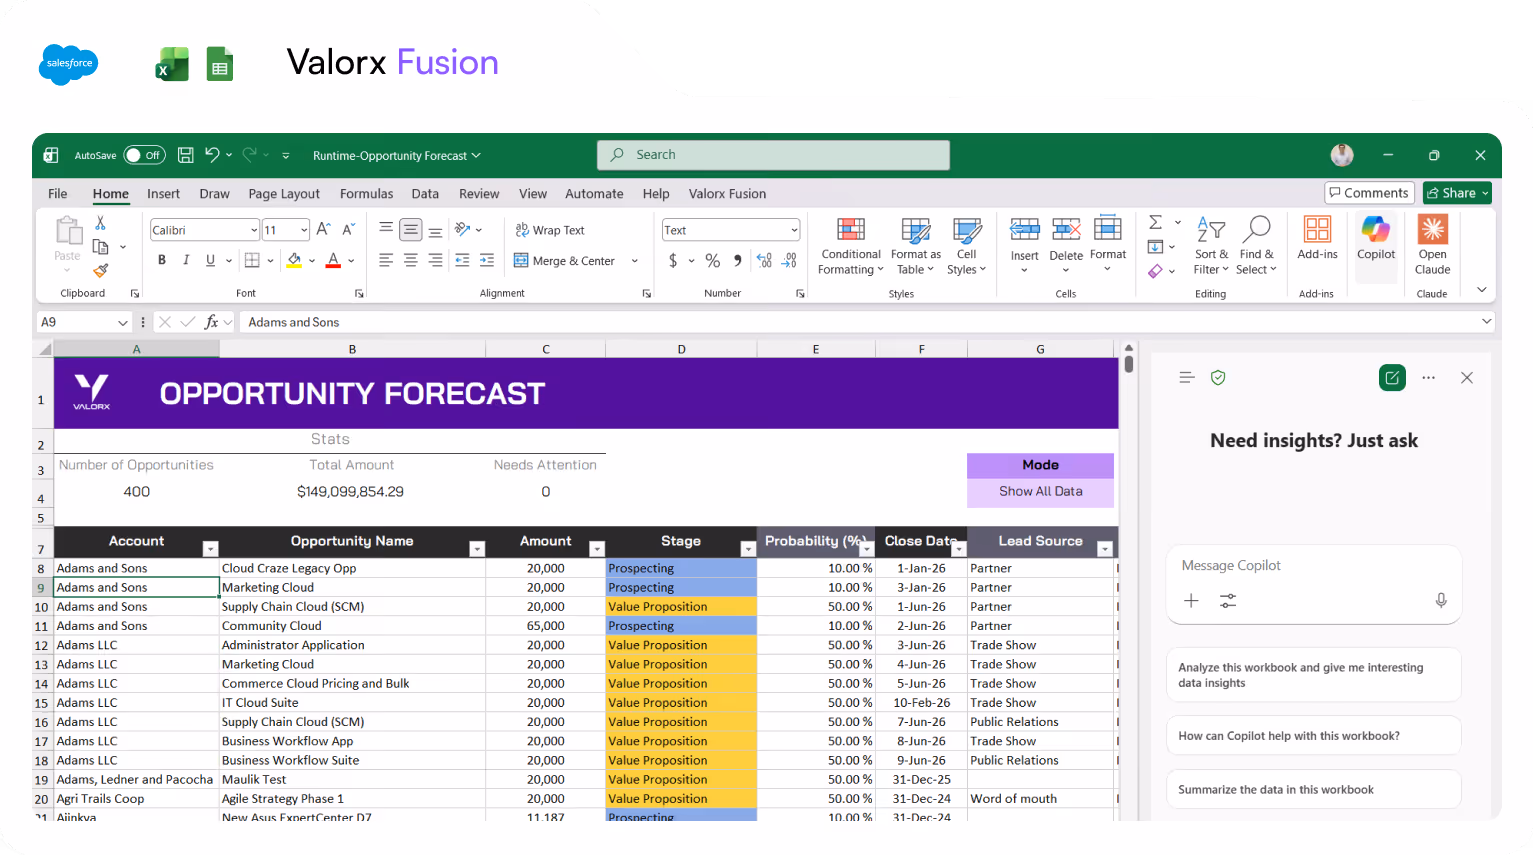
Familiar Excel Interface
Meet users where they are in Excel to eliminate training and change management while keeping admin control intact.
Learn more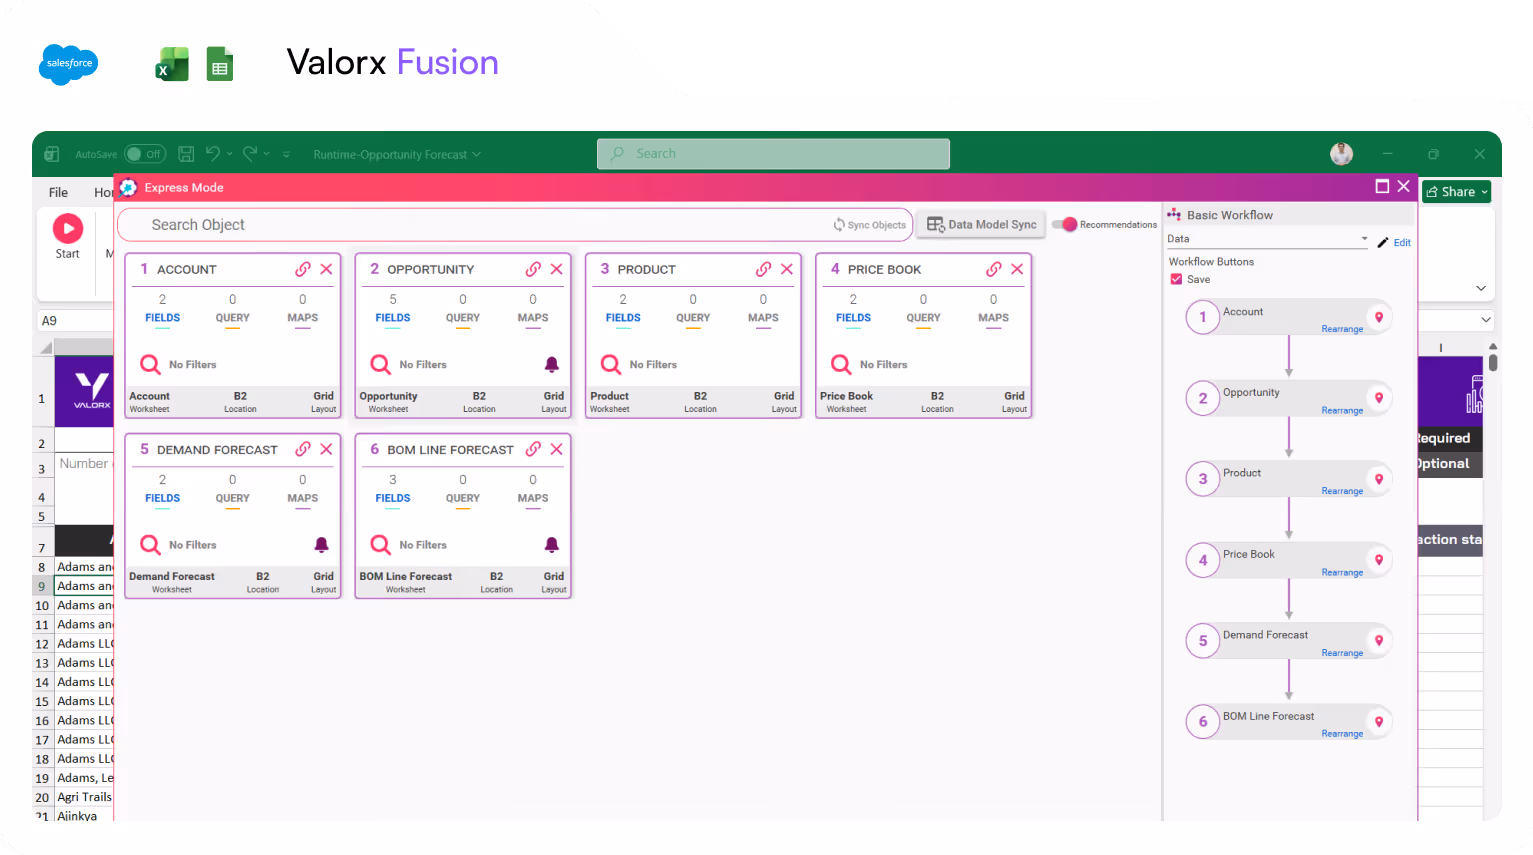
Built for Complex Workflows
Work on quoting, pricing, forecasting, and deal models directly in Excel, all while staying connected to live Salesforce data.
Learn more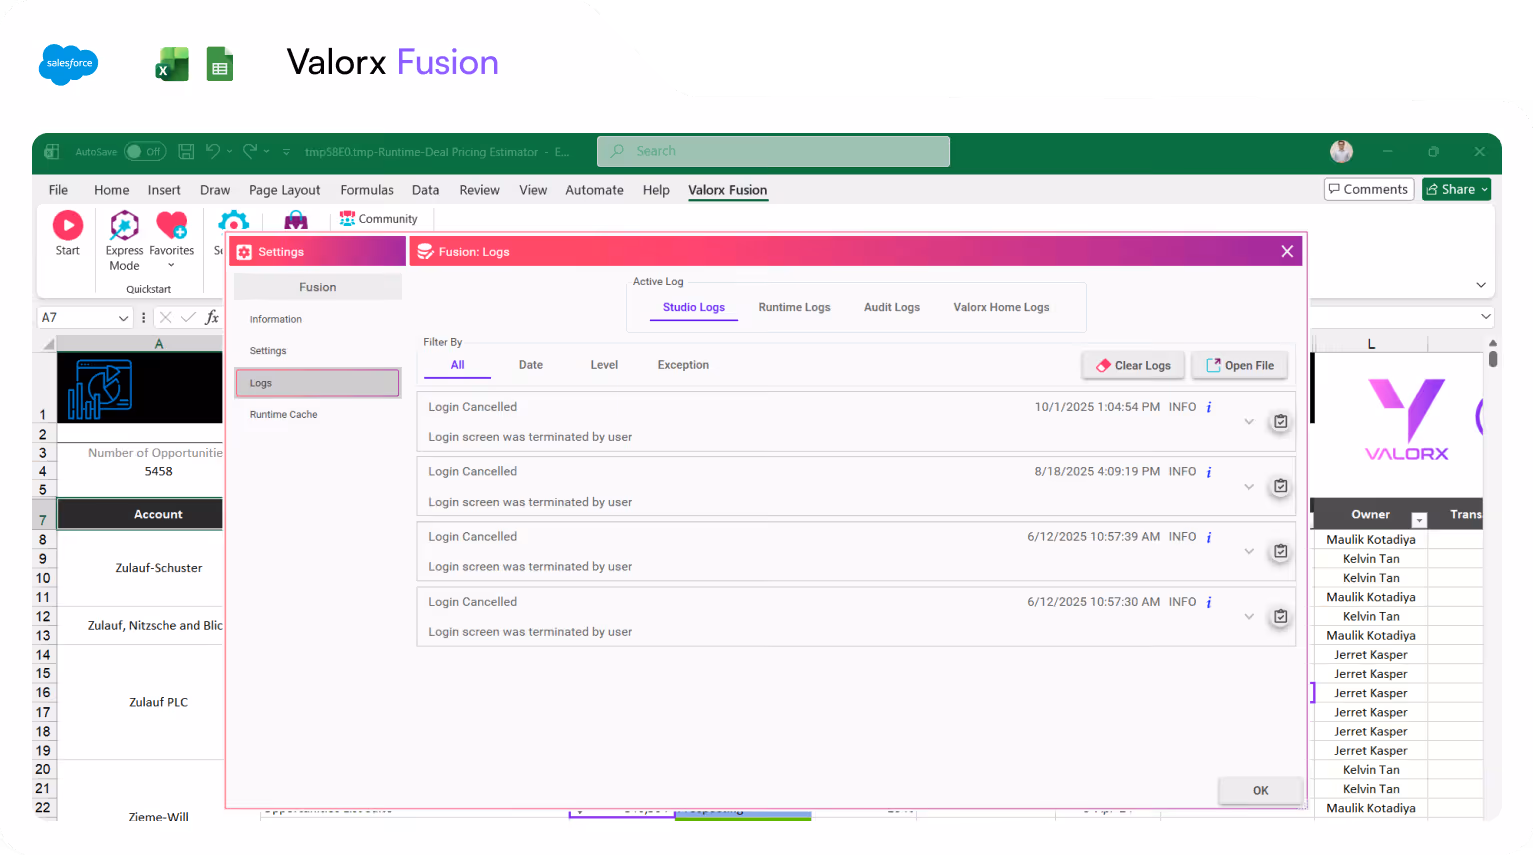
No Version Chaos
Fusion apps live inside Salesforce, ensuring everyone works from secure, up-to-date data. No offline files or data silos—just live, controlled CRM access.
Learn more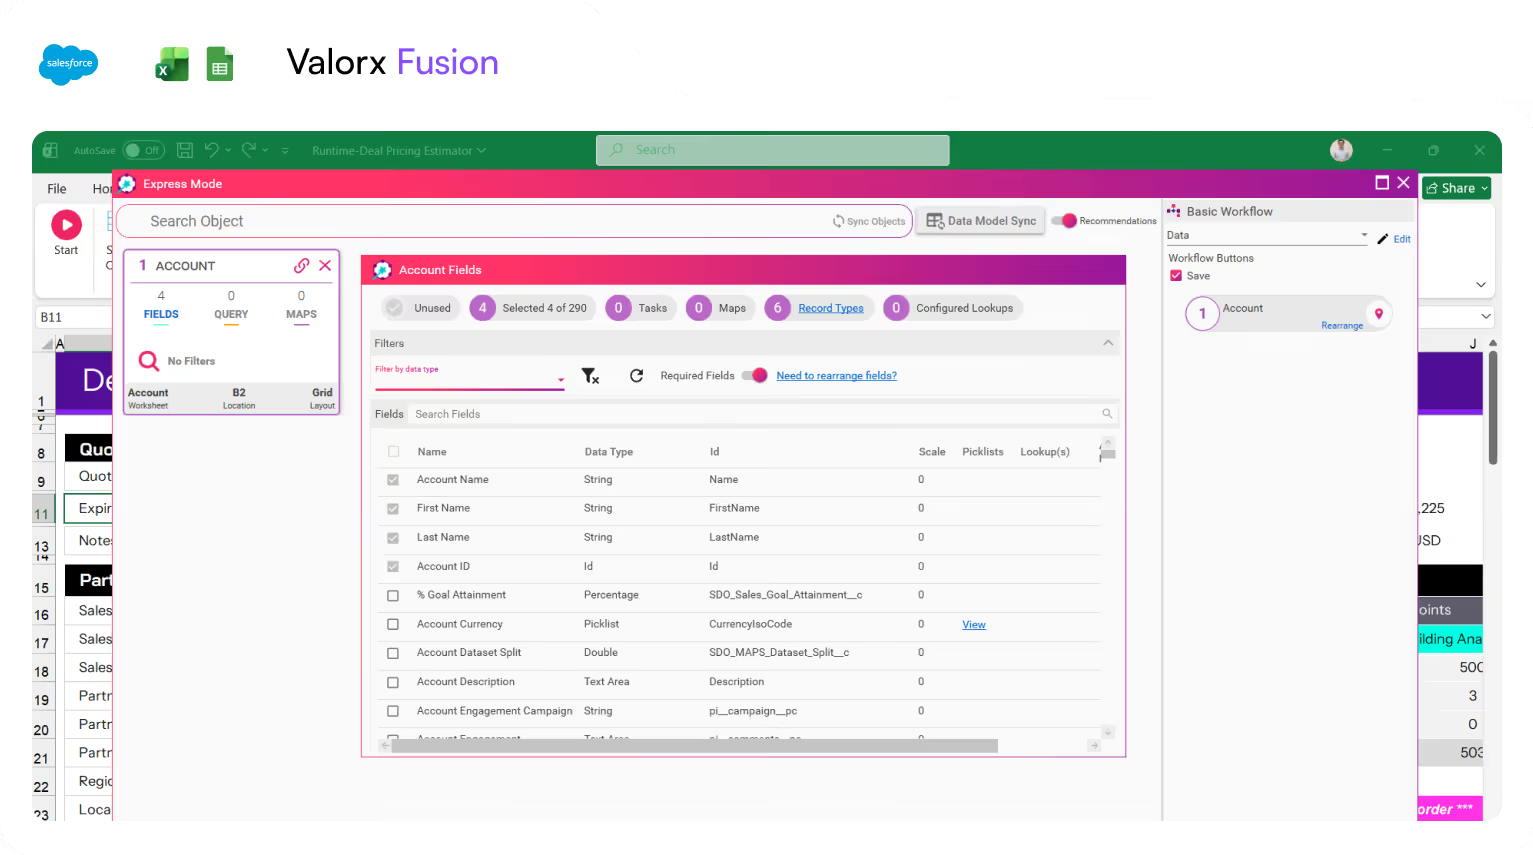
Work with Any Salesforce Data Model
Bring any standard or custom field into your spreadsheet, apply formulas, and sync changes back to Salesforce instantly.
Learn moreThe functionality Salesforce left out
Fusion plugs the gaps in Salesforce's costing, pricing, modeling, quoting, and forecasting workflows.
Manufacturing Cloud

Advanced production scheduling

Aggregated and disaggregated forecasting

Flexible scenario planning

Cross-system data integration

Multi-dimensional insights
Fusion + Revenue Cloud
High-volume quote management
Multi-dimensional quoting
Professional services quoting
Deal comparison and modeling
Complex pricing calculations
Fusion + Sales Cloud
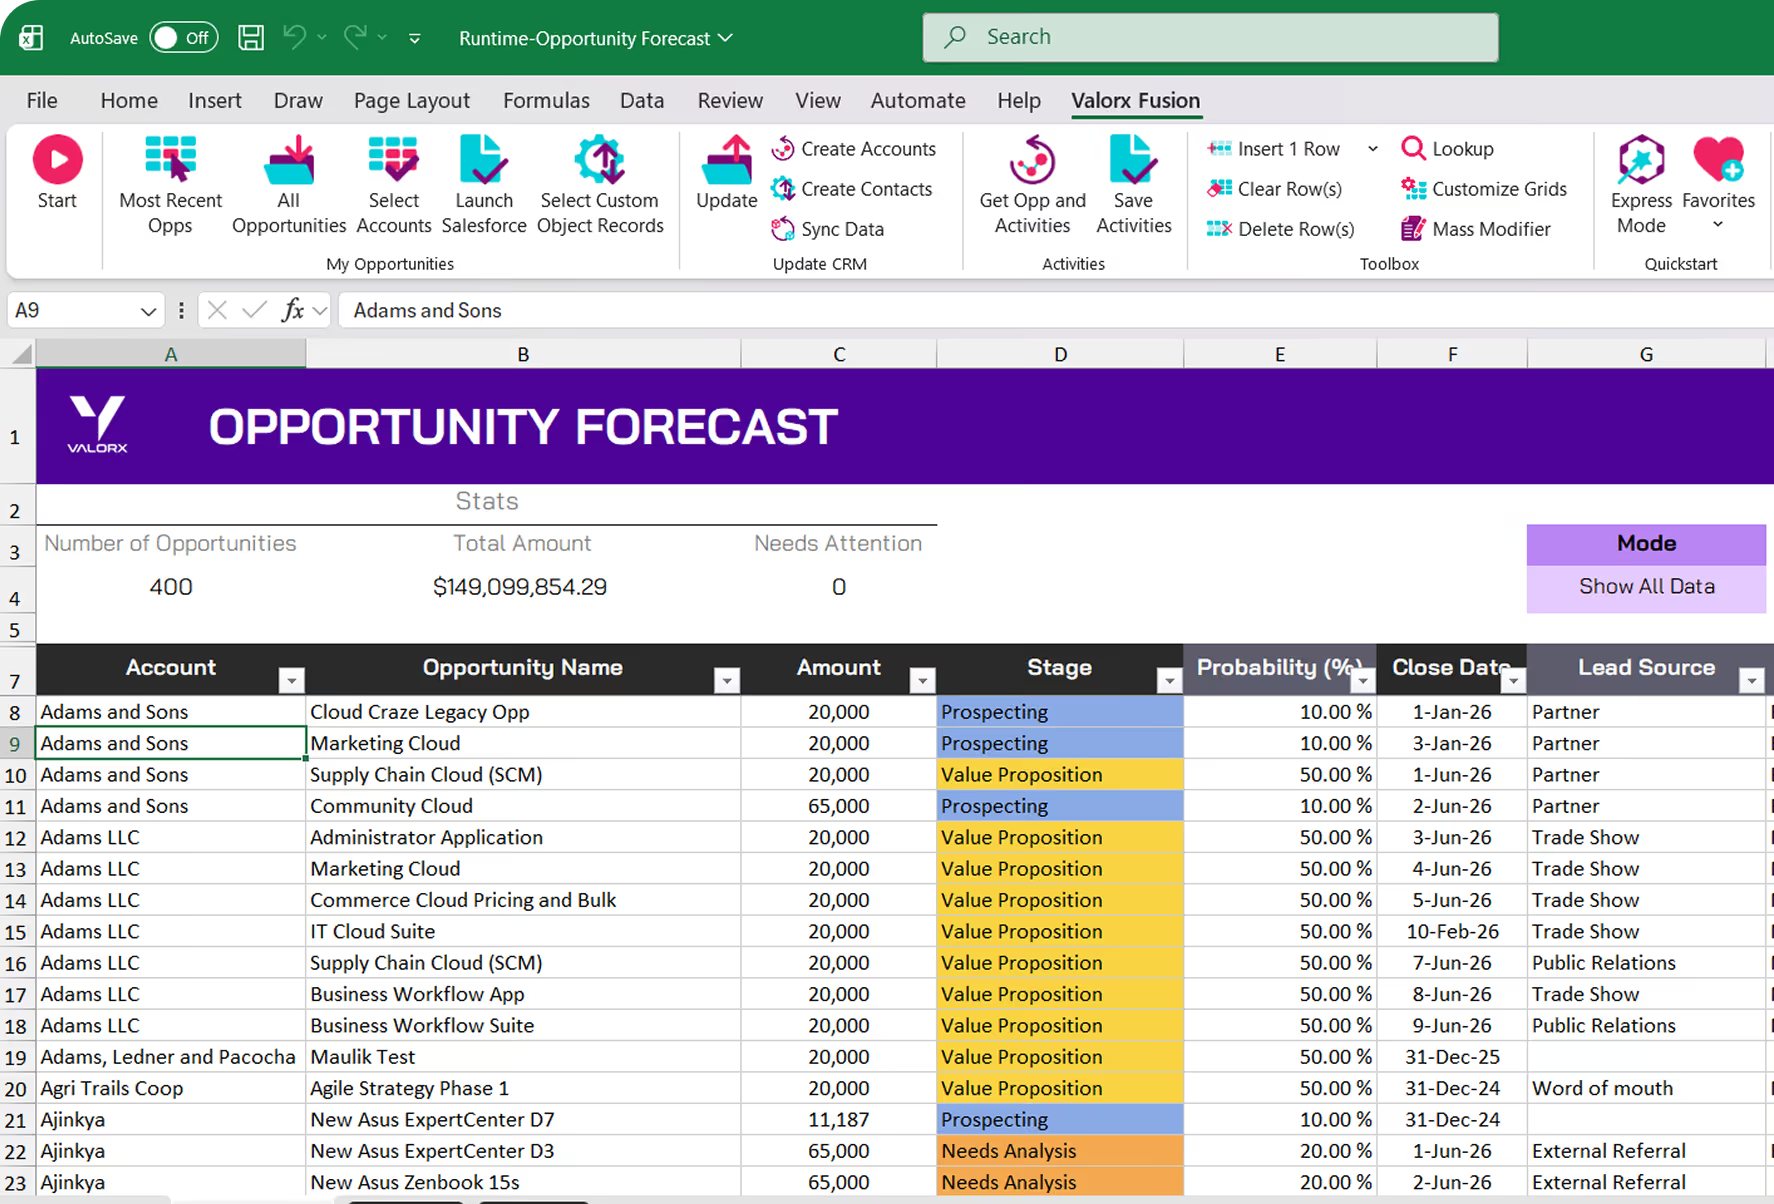
Mass updates to opportunities
Formula-driven sales analytics
Territory and quota planning
Pipeline forecasting
Cross-object sales reporting
Salesforce can't replace spreadsheets, but they can work together
Without Valorx
Click through Opportunity → Quote → Line Items → Products
Toggle between 10 browser tabs to compare records
Learn Salesforce formula limits, then simplify your logic
Click record → edit → save → next record → repeat 200x
Can't use existing spreadsheet
With Valorx
Edit row in Excel - Fusion handles the objects behind
One view in Excel of every record, always current
Keep your Excel logic—connect it, don't rebuild it
Work in Excel, click save, Done
Use your existing spreadsheet with Salesforce, and it just works

Built for every team

Sales Operations

Revenue Operations
Finance & FP&A
Deal Desk / Pricing

Demand Planning

Salesforce Admins
three simple steps
How It Works
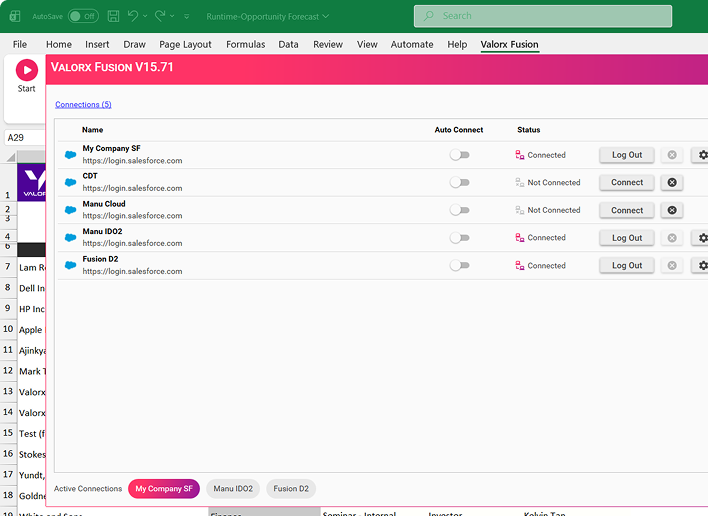
1
Connect
Install the Excel add-in or Google Sheets extension. Authenticate with Salesforce OAuth. Your credentials stay secure.
2
Build
Use your existing workbooks. Add formulas, pivots, and charts. Select any Salesforce object and fields you need.
3
Work
One click saves all changes to Salesforce. Full audit trail. Field-level security automatically enforced.
Real Excel features - now with live CRM data
USE CASES
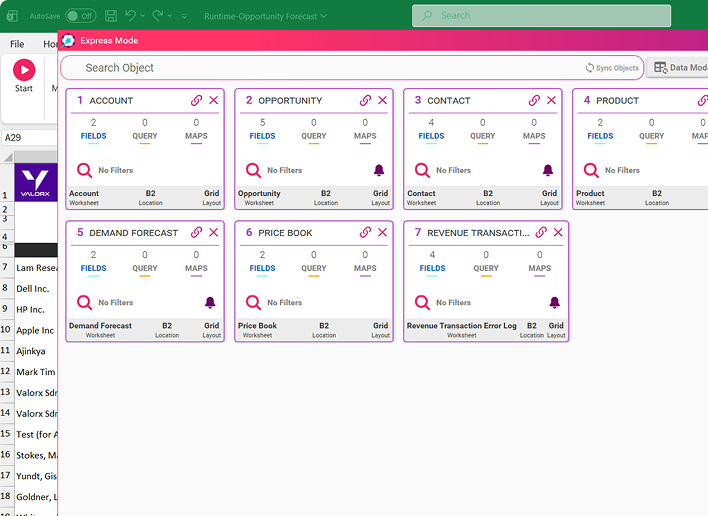
Make Salesforce work the way you want
Bring the power of a familiar spreadsheet experience to Salesforce — edit, analyze, and manage your CRM data the way you already know.
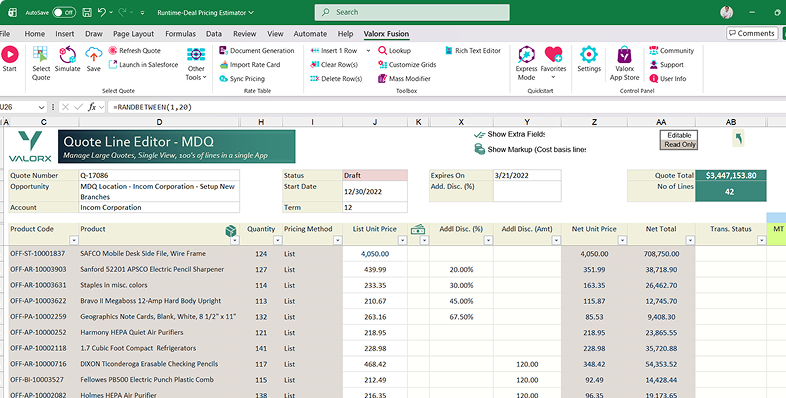
Multi-Dimensional Quoting
$3.4M quotes with 42+ lines, multi-location allocation
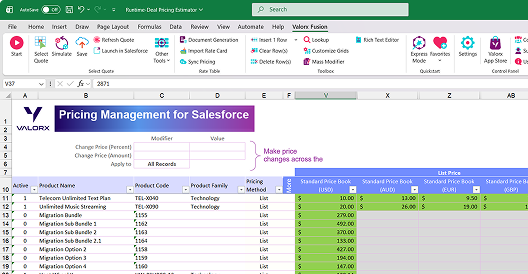
Multi-Currency Pricebooks
USD, EUR, GBP, AUD, NZD—all in one view
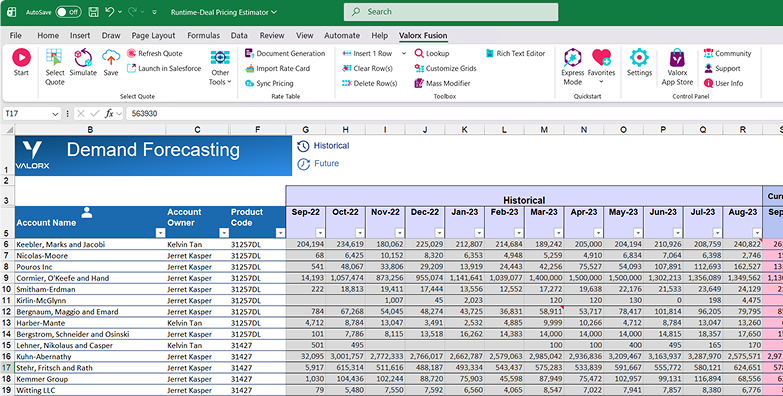
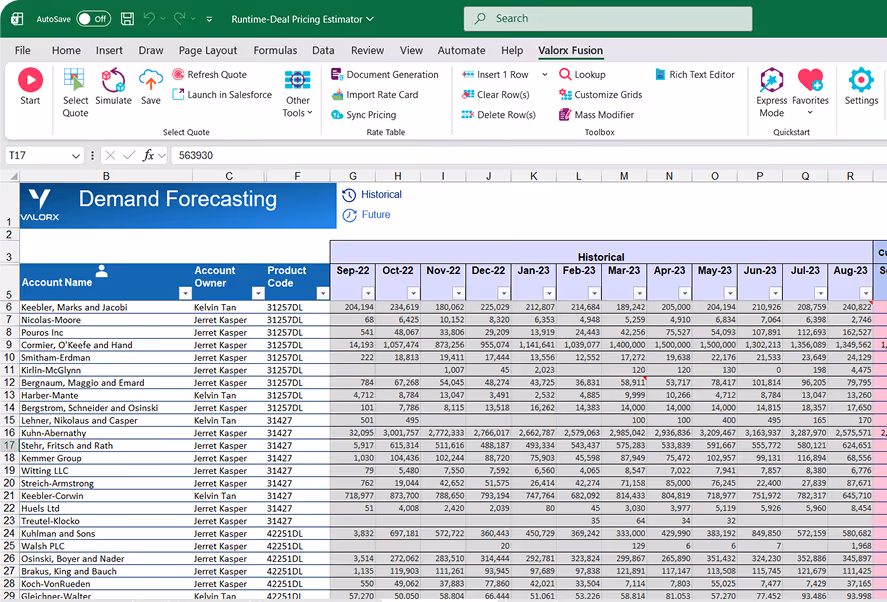
Demand Forecasting
Historical + future months with M+1/M+2/M+3 overrides
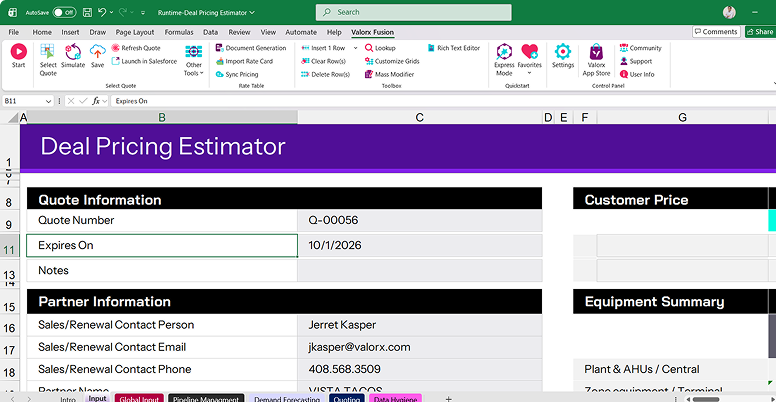
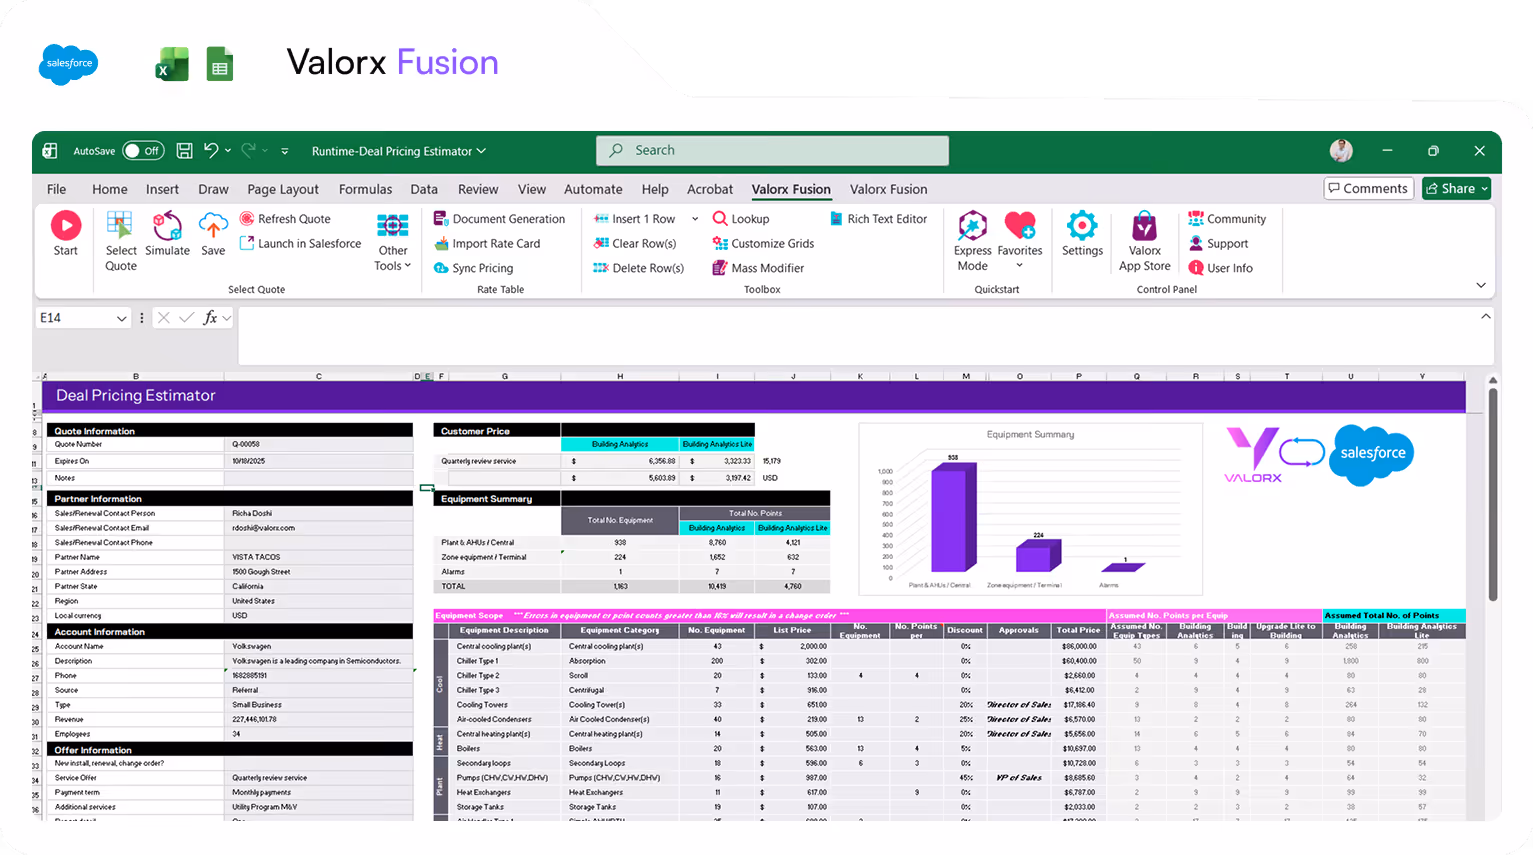
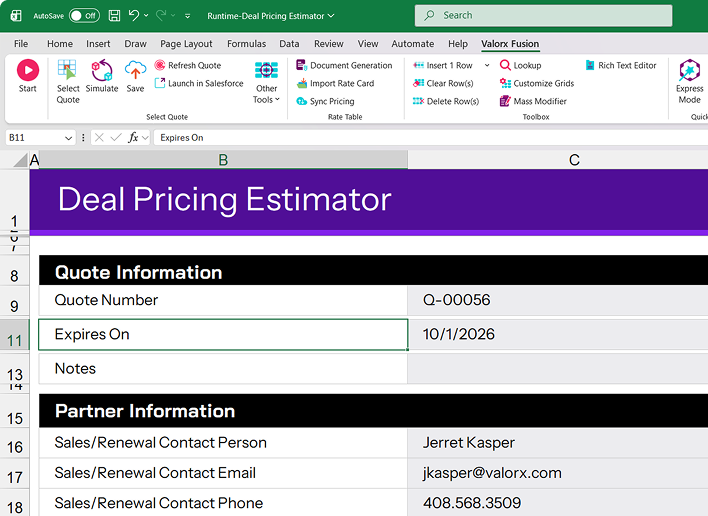
Deal Pricing Estimator
Complex quotes with charts and equipment summaries
and more
Access all your favorite Excel features
From simple drag-and-drop to powerful formulas, enjoy all your go-to spreadsheet tools while working directly with your data.
Copy & Paste

Filter Columns

Drag & Drop
Sort Columns

Pivot Table

Macros
Column Grouping

Layout

Freeze Columns

Global Search
Smart Import

VLOOKUP
Mass Modifier

Auto Fill

Formulas

Conditional Format
Enterprise Controls

Offline Mode
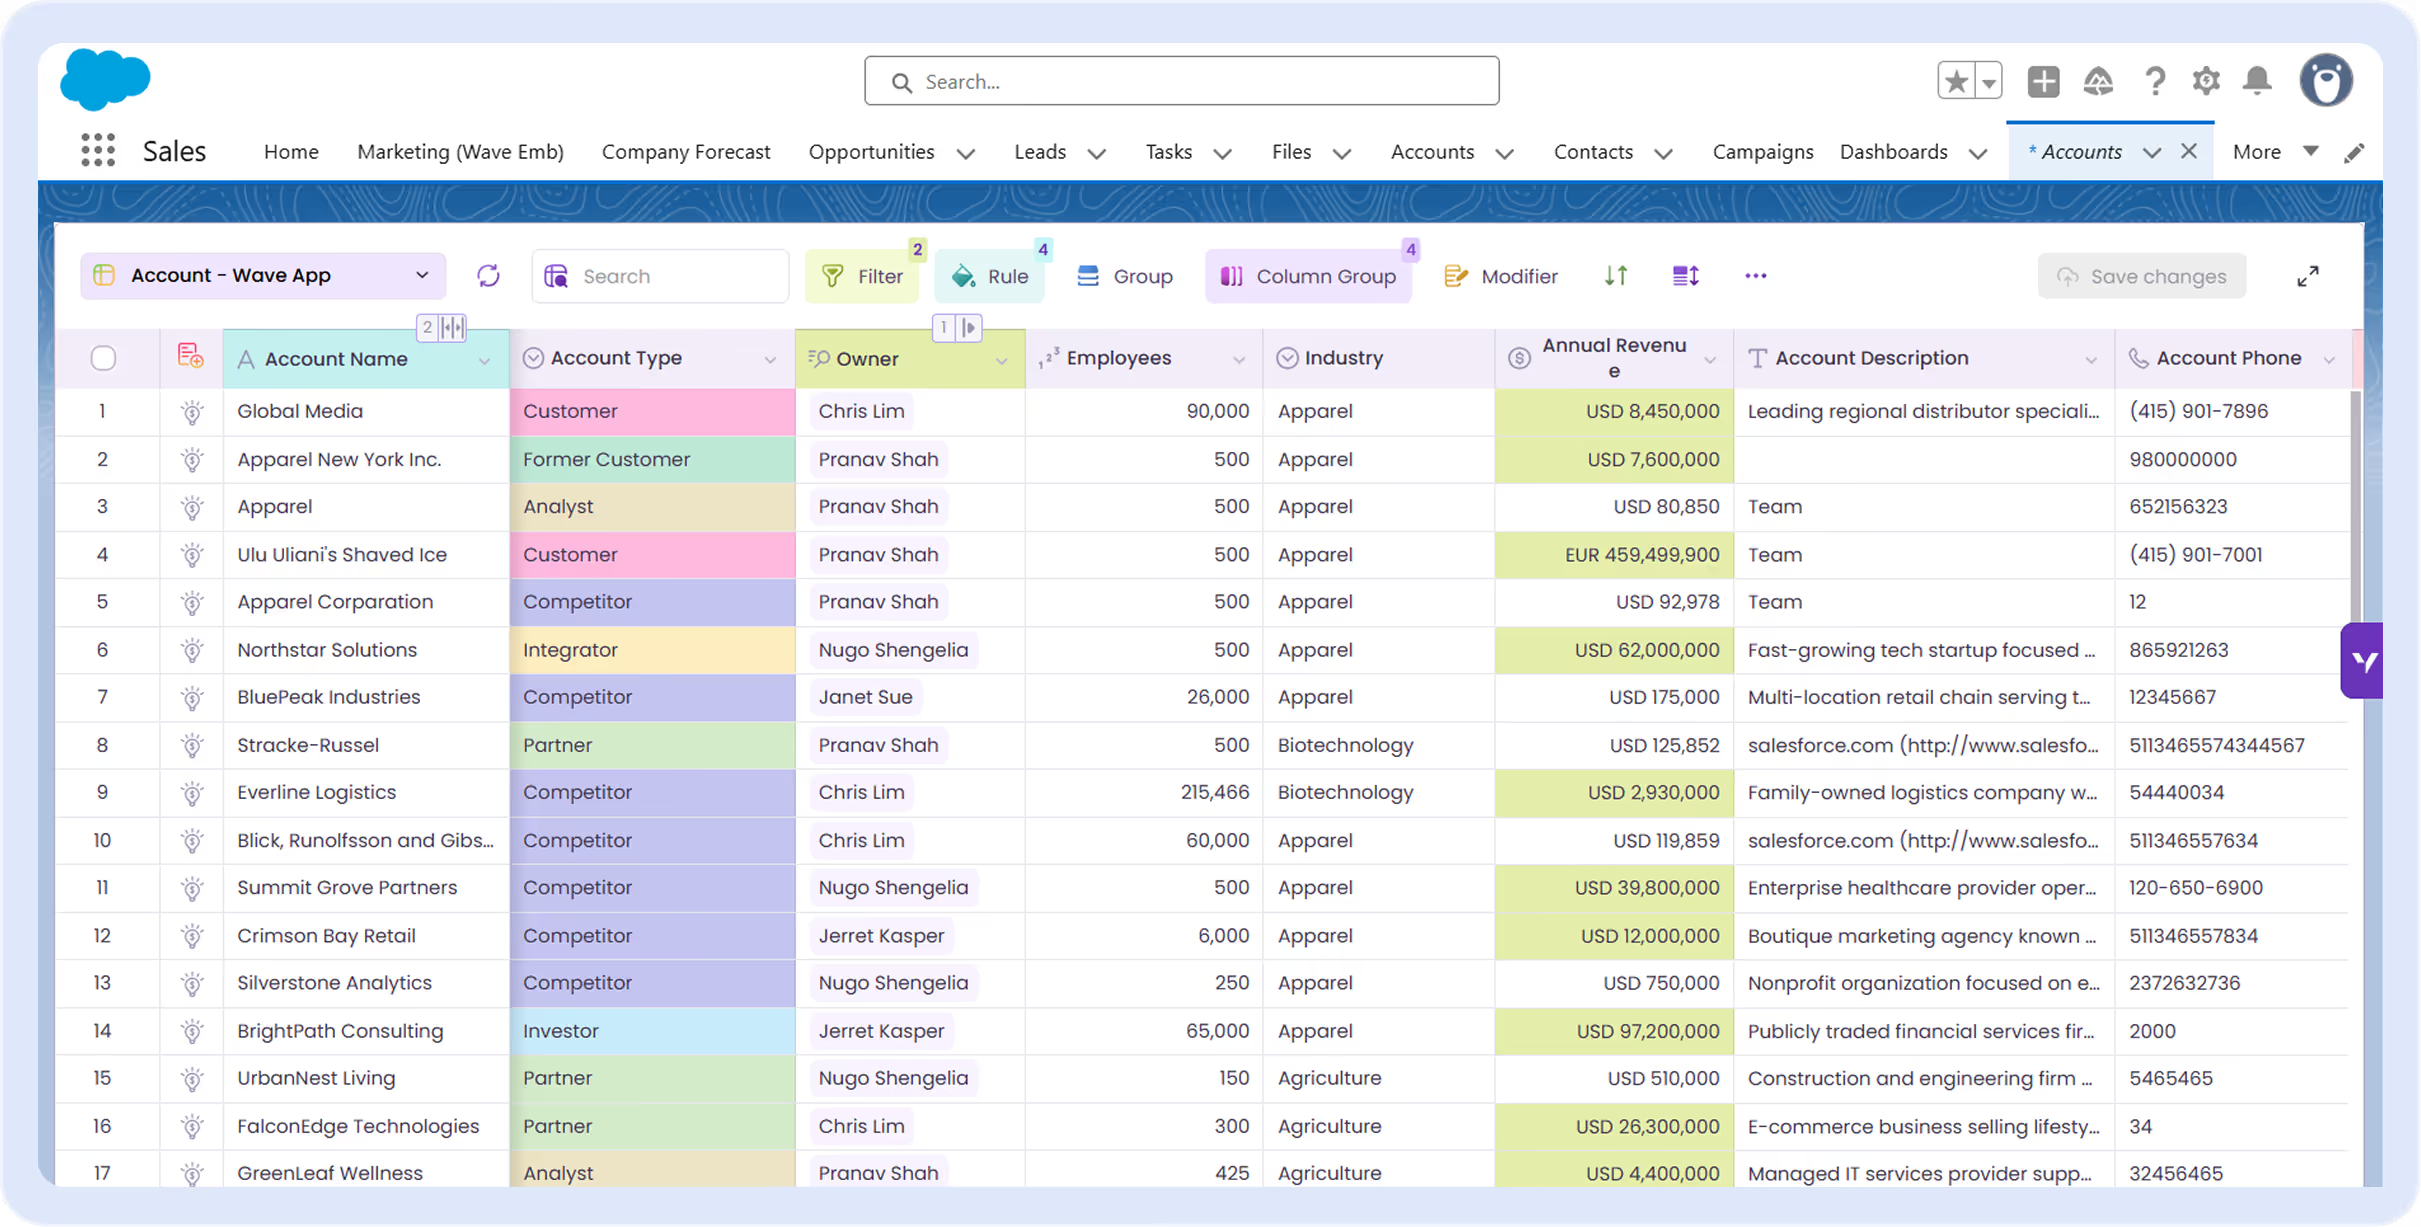
Plans start at $0.
Valorx Wave brings a true spreadsheet UI to Salesforce, making complex data management intuitive and lightning fast.
Real results with Valorx
Show your customers what's possible when they combine Salesforce with spreadsheet-native workflows.


Wondering about Fusion?
Everything you need to know about Valorx Fusion
How does Fusion connect to Salesforce?
Excel add-in connects via Salesforce API using OAuth. No passwords stored. Your Salesforce login controls access.
What Salesforce objects can I connect?
Any standard or custom object your profile has access to. If you can see it in Salesforce, you can connect it to Fusion.
Is my data secure?
All data remains in Salesforce, governed by your existing permissions, profiles, and field-level security. Fusion doesn't store your data.
How is Fusion different from Data Loader?
Data Loader is one-way (export/import). Fusion is bidirectional and live — edit in Excel, save to Salesforce instantly. No CSV mapping required.
How quickly can we deploy?
Most teams are productive in days. Install from AppExchange, connect via OAuth, start building. No integration project required.


Choose the workflow you need:
Try Wave in browser Extension
Connect Wave directly with your browser

Try Wave in Salesforce
Integrate Wave in Salesforce

Try Fusion In Excel
Easily use Fusion within Excel

Excel
Salesforce
Browser