Retail in Salesforce

From loyalty to locations—manage millions of products, thousands of stores, and complex supplier relationships at scale in Salesforce.
Screenshot of Valorx Wave sales dashboard showing account sales agreements with columns for product, planned quantity, sales price, and discount percentage for October 25 and November 25.
Valorx Fusion interface showing an Excel sheet titled Deal Pricing Estimator with sections for Quote Information, Partner Information, Account Information, Customer Price, and Equipment Summary.
Catalog

Catalog & pricing

Thousands of SKUs across categories, sizes, and variants. Multiple price books for retail, wholesale, regional, and promotional pricing. Manage product data at retail speed.

View and update products in bulk

See your entire catalog in one grid—category, status, price, inventory flag. Filter by department, brand, or season. Update attributes across thousands of products without clicking into each record.

Update prices across multiple books

Manage retail, wholesale, and promotional price books in one view. Apply percentage increases, seasonal discounts, or clearance pricing across product groups.

Spot margin issues before they go live

Conditional formatting highlights low-margin products and pricing errors. Red for margin below threshold, yellow for cost increases not reflected in price—see profitability risks across the catalog.

Import pricing from merchandising sheets

Use Fusion when merchandising sends price changes in Excel. Map columns to Salesforce fields, validate against existing products, apply updates across price books.
Forecasting

Forecasting & planning

Revenue projections across categories, regions, and channels. Seasonal planning and promotional impact modeling with live Salesforce data—no spreadsheet exports.

View pipeline and forecasts in one grid

See all opportunities and forecast data in one view—by region, category, or channel. Filter by quarter, stage, or rep. Update amounts, close dates, and categories without clicking into each record.

Spot at-risk deals and gaps

Conditional formatting highlights stalled opportunities, slipped close dates, and forecast shortfalls. Red for overdue, yellow for at-risk—see revenue gaps without running reports.

Update forecasts across regions in bulk

Adjust forecast categories, amounts, and close dates across opportunities. Process end-of-quarter updates, category corrections, or stage changes—all in one grid.

Model scenarios with Excel formulas

Pull pipeline into Excel. Apply probability weighting, seasonal adjustments, and what-if scenarios. Compare best case, expected, and conservative projections—push back to Salesforce.
Stores

Stores & locations

Hundreds or thousands of store locations across regions and formats. Manage operating hours, territory assignments, and performance metrics at scale.

View all stores across your network

See every location in one grid—format, region, district manager, status. Filter by state, format type, or performance tier. Bulk update attributes without navigating to each record.

Spot stores needing attention

Conditional formatting highlights underperforming stores, compliance issues, and missing data. Red for performance below threshold, yellow for incomplete profiles—see operational risks at a glance.

Update territory assignments in bulk

Reassign district managers, update regions, change territory ownership across hundreds of stores. Select by current assignment and update in one action—no manual record-by-record changes.

See store with account & performance

Multi-object views show store location alongside parent account, store manager contact, and performance metrics. Get the full picture without clicking through related lists.
Suppliers

Suppliers & vendors

Thousands of suppliers with certifications, contracts, and performance metrics. Manage quality standards, trading terms, and compliance at scale.

View all suppliers in one grid

See every supplier in one view—category, certification status, contract dates, performance score. Filter by product category, compliance status, or region. Update terms and status in bulk.

Spot expiring certs and contracts

Conditional formatting highlights expiring certifications, contract renewals, and compliance gaps. Red for expired, yellow for expiring within 30 days—see risk across your supplier base instantly.

Update trading terms across suppliers

Select suppliers by category and update payment terms, delivery requirements, or contract status in bulk. Process annual term renewals across hundreds of suppliers—no one-by-one updates.

Analyze supplier performance in Excel

Use Fusion to pull supplier data into Excel. Calculate delivery accuracy, quality scores, and cost trends. Compare suppliers, model pricing scenarios, then push updated ratings back.
Loyalty

Loyalty programs

Millions of loyalty members across tiers and regions. Points balances, tier qualifications, partner redemptions. Manage the program without export-and-rerun.

Manage loyalty members at scale

View all members in one grid—tier, points, activity. Bulk update tiers during qualification periods. Conditional formatting spots at-risk members before they churn.

Bulk tier qualifications

Run end-of-year or end-of-quarter tier qualifications in one grid. Promote, maintain, or demote thousands of members based on spend and activity rules in a single action.

Analyze member segments in Excel

Use Fusion to model tier qualifications, calculate lifetime value, and segment members for campaigns. Push updated segments back to Salesforce.

Push targeted outreach lists back

Build at-risk or high-LTV segments in Excel, then push them back as Salesforce campaign members. Personalized reactivation and tier-up campaigns launch with live data.
Service

B2B & customer service

Business accounts with bulk orders and custom pricing. High-volume service cases across online, in-store, and loyalty channels. Handle both without record-by-record work.

Manage B2B accounts and bulk orders

View all business accounts with order history and credit status. Build bulk orders with 100+ line items in a spreadsheet grid. Update credit limits and terms across your customer base.

Import orders from customer sheets

Use Fusion when customers send orders in Excel. Map columns, validate data, apply account pricing. Push clean orders to Salesforce without manual re-entry.

Manage cases across channels at scale

View all cases in one grid—channel, type, status, owner. Conditional formatting spots SLA breaches instantly. Bulk reassign cases during team changes or escalation events

Bulk reassign during volume spikes

Select open cases by channel, type, or queue and redistribute across agents in one action. Respond to surge events or rota changes without manual ticket-by-ticket reassignment.

See how fast Salesforce
can actually feel.

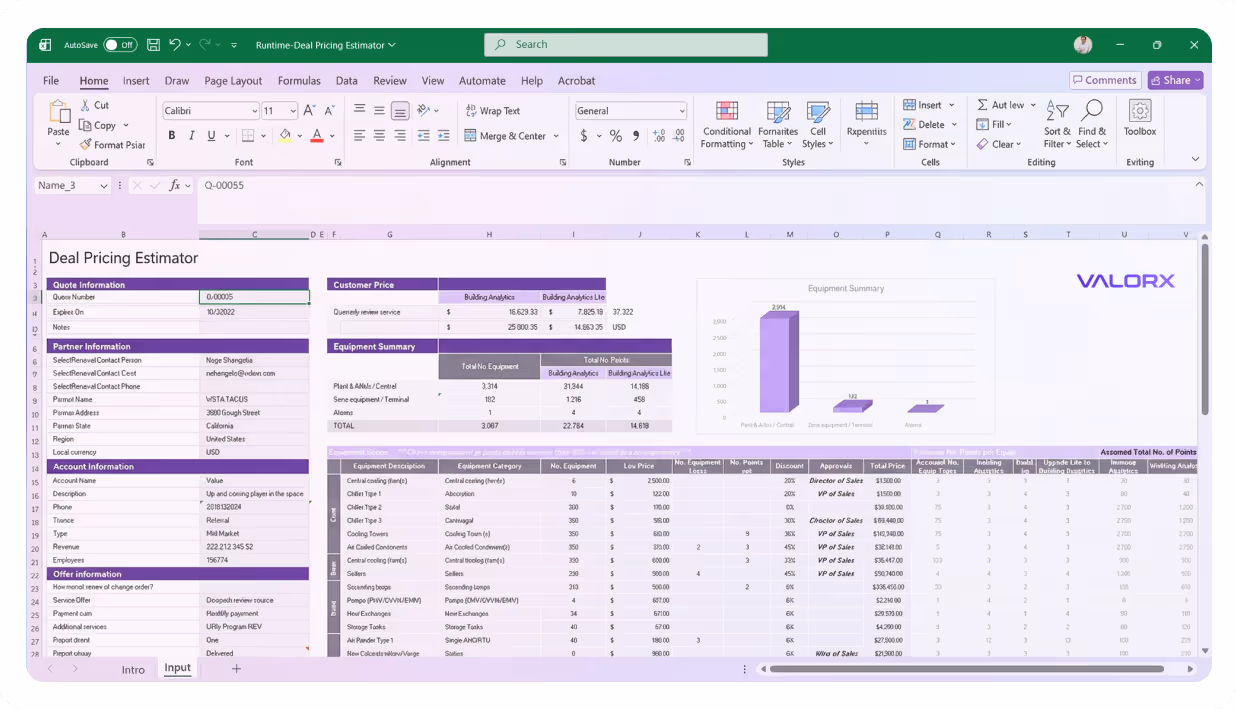
If you can do it in spreadsheet,
you can do it in Valorx.
Book a demo

<14 days

to production

10x

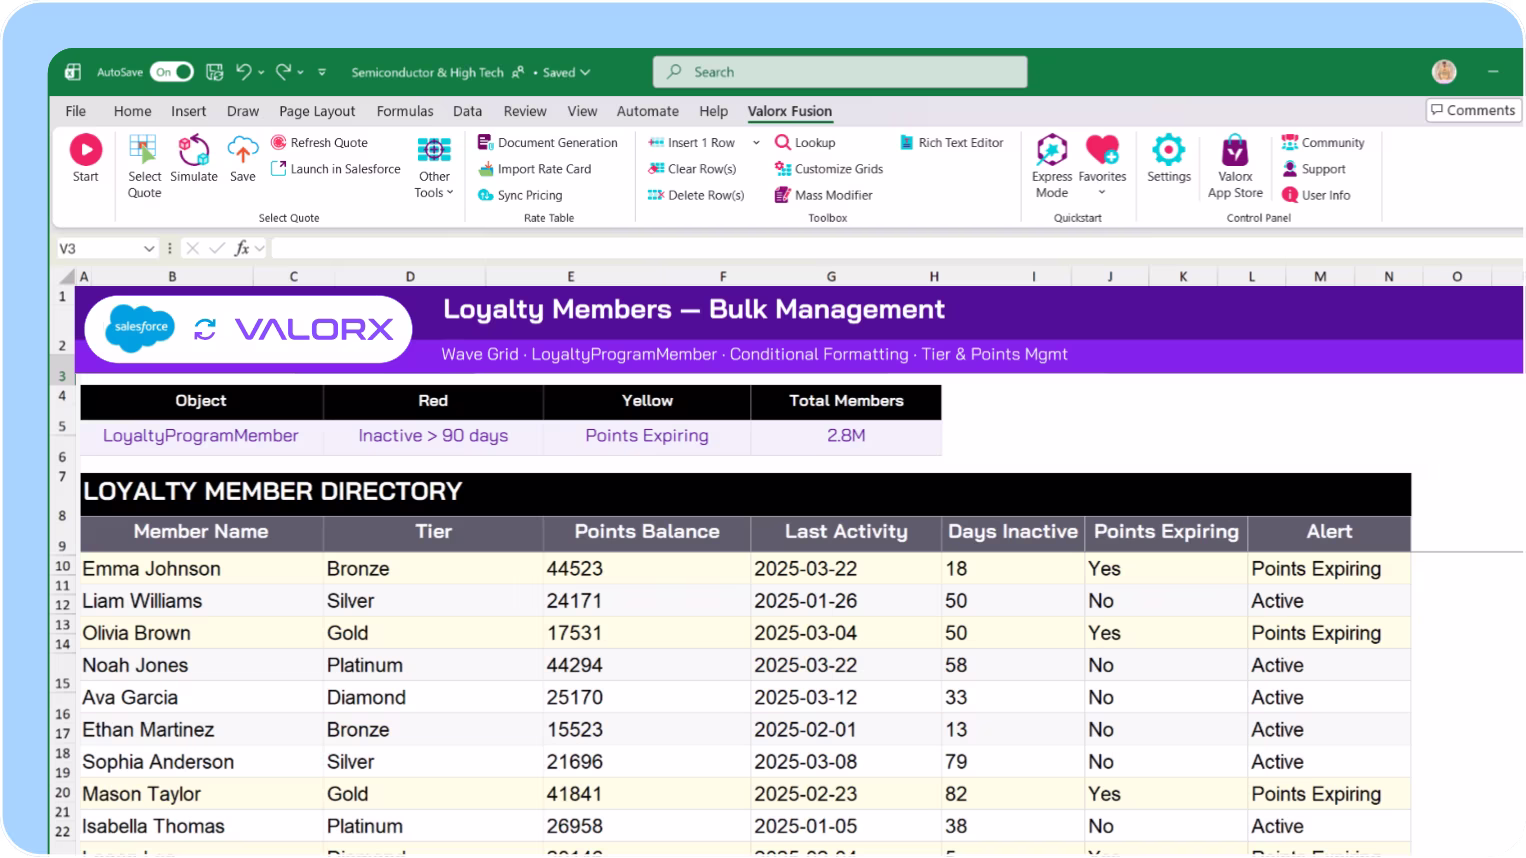
faster loyalty tier qualification runs

1000+

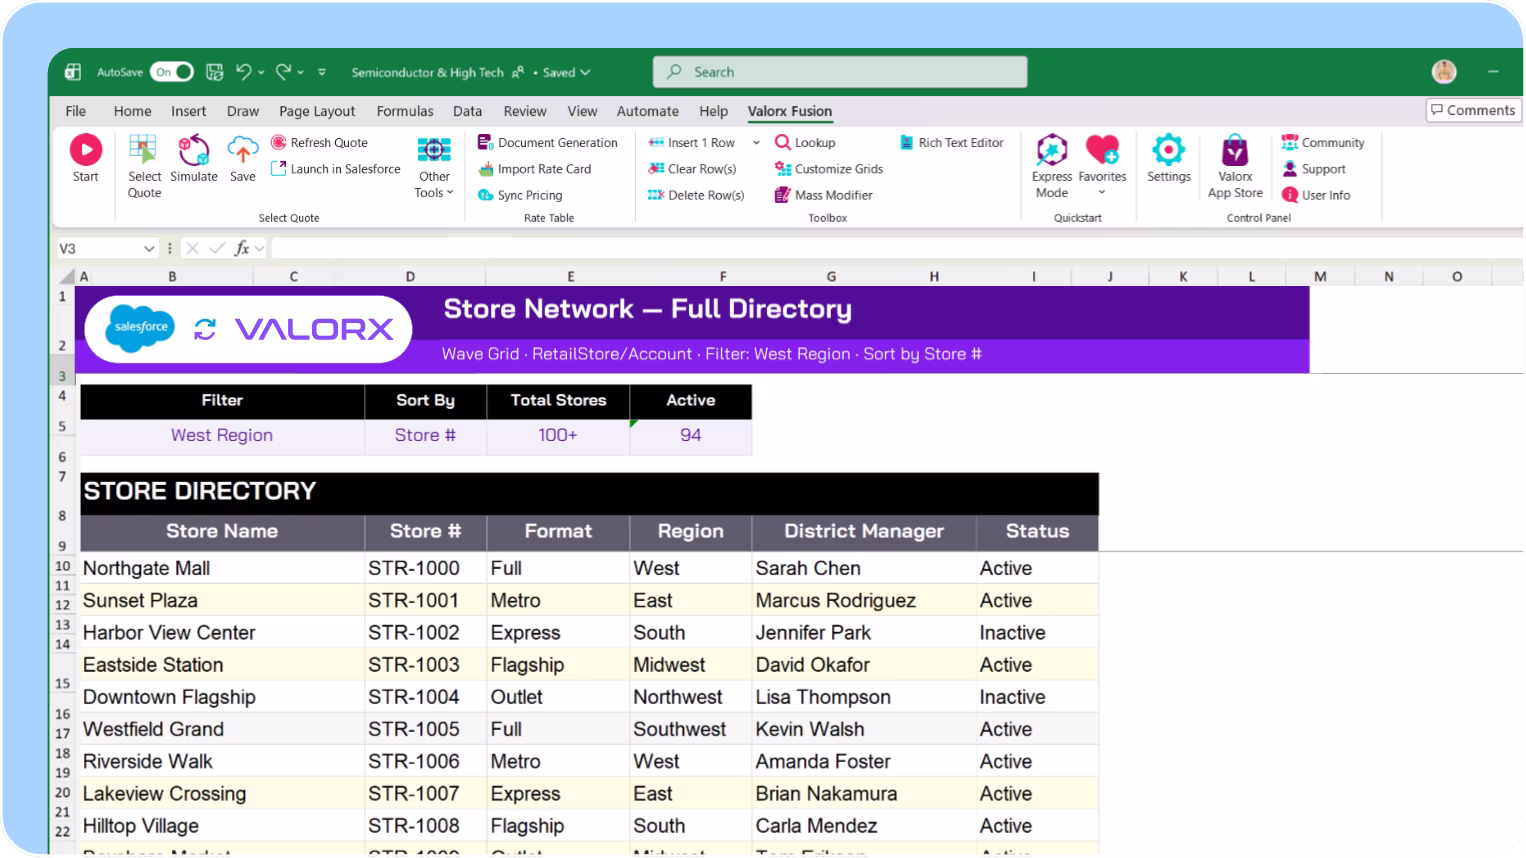
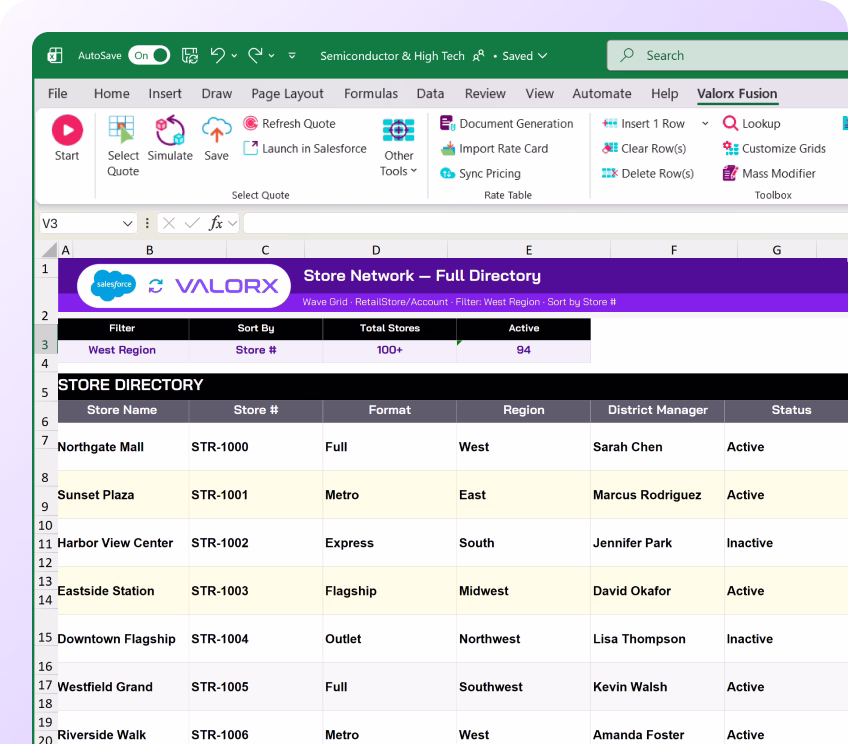
store locations managed in one grid
Abstract soft pastel-colored gradient background with blurred lavender, blue, and pink hues.

Built for retail teams

Valorx works across retail verticals using Salesforce
Abstract hexagonal molecular structure in purple and blue tones representing a chemical or scientific concept.
Blue and purple stylized automotive wheel icon with five spokes.

Grocery & Specialty Food

Supplier management, fresh pricing, loyalty at scale
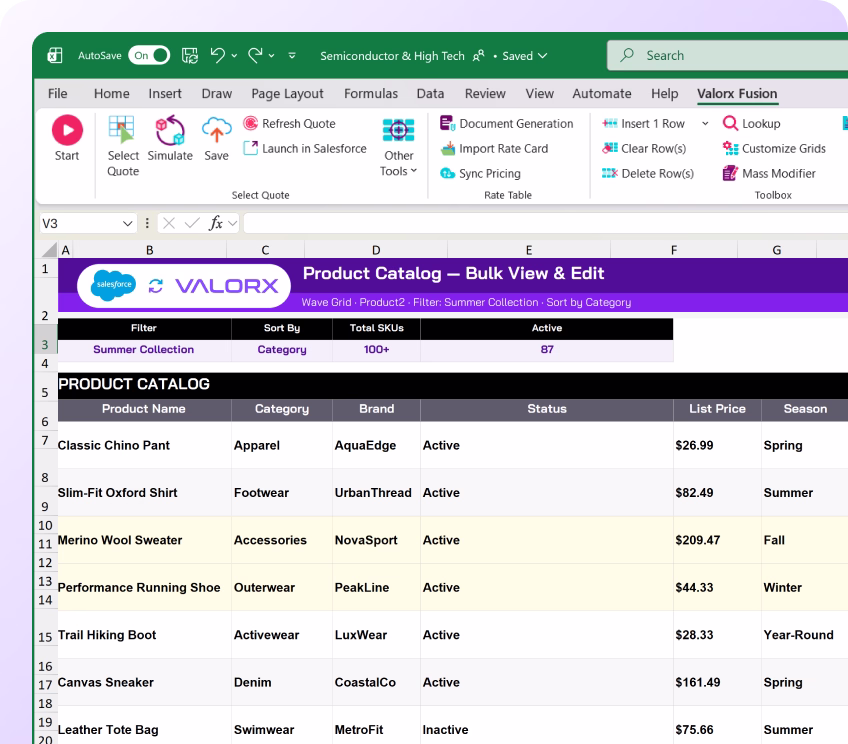
Abstract hexagonal molecular structure in purple and blue tones representing a chemical or scientific concept.
Illustration of a purple and blue microchip with circuit lines extending outward.

Apparel & Fashion

Seasonal catalogs, markdowns, omnichannel customers
Abstract hexagonal molecular structure in purple and blue tones representing a chemical or scientific concept.
Icon with a gear and a wrench crossed, symbolizing machinery or tools.

Consumer Electronics

SKU-heavy catalogs, B2B orders, warranty services
Abstract hexagonal molecular structure in purple and blue tones representing a chemical or scientific concept.
Abstract 3D cubes stacked with a gradient of pink and blue hues inside a white circular frame.

Department & Mass

Multi-format stores, region pricing, high-volume service

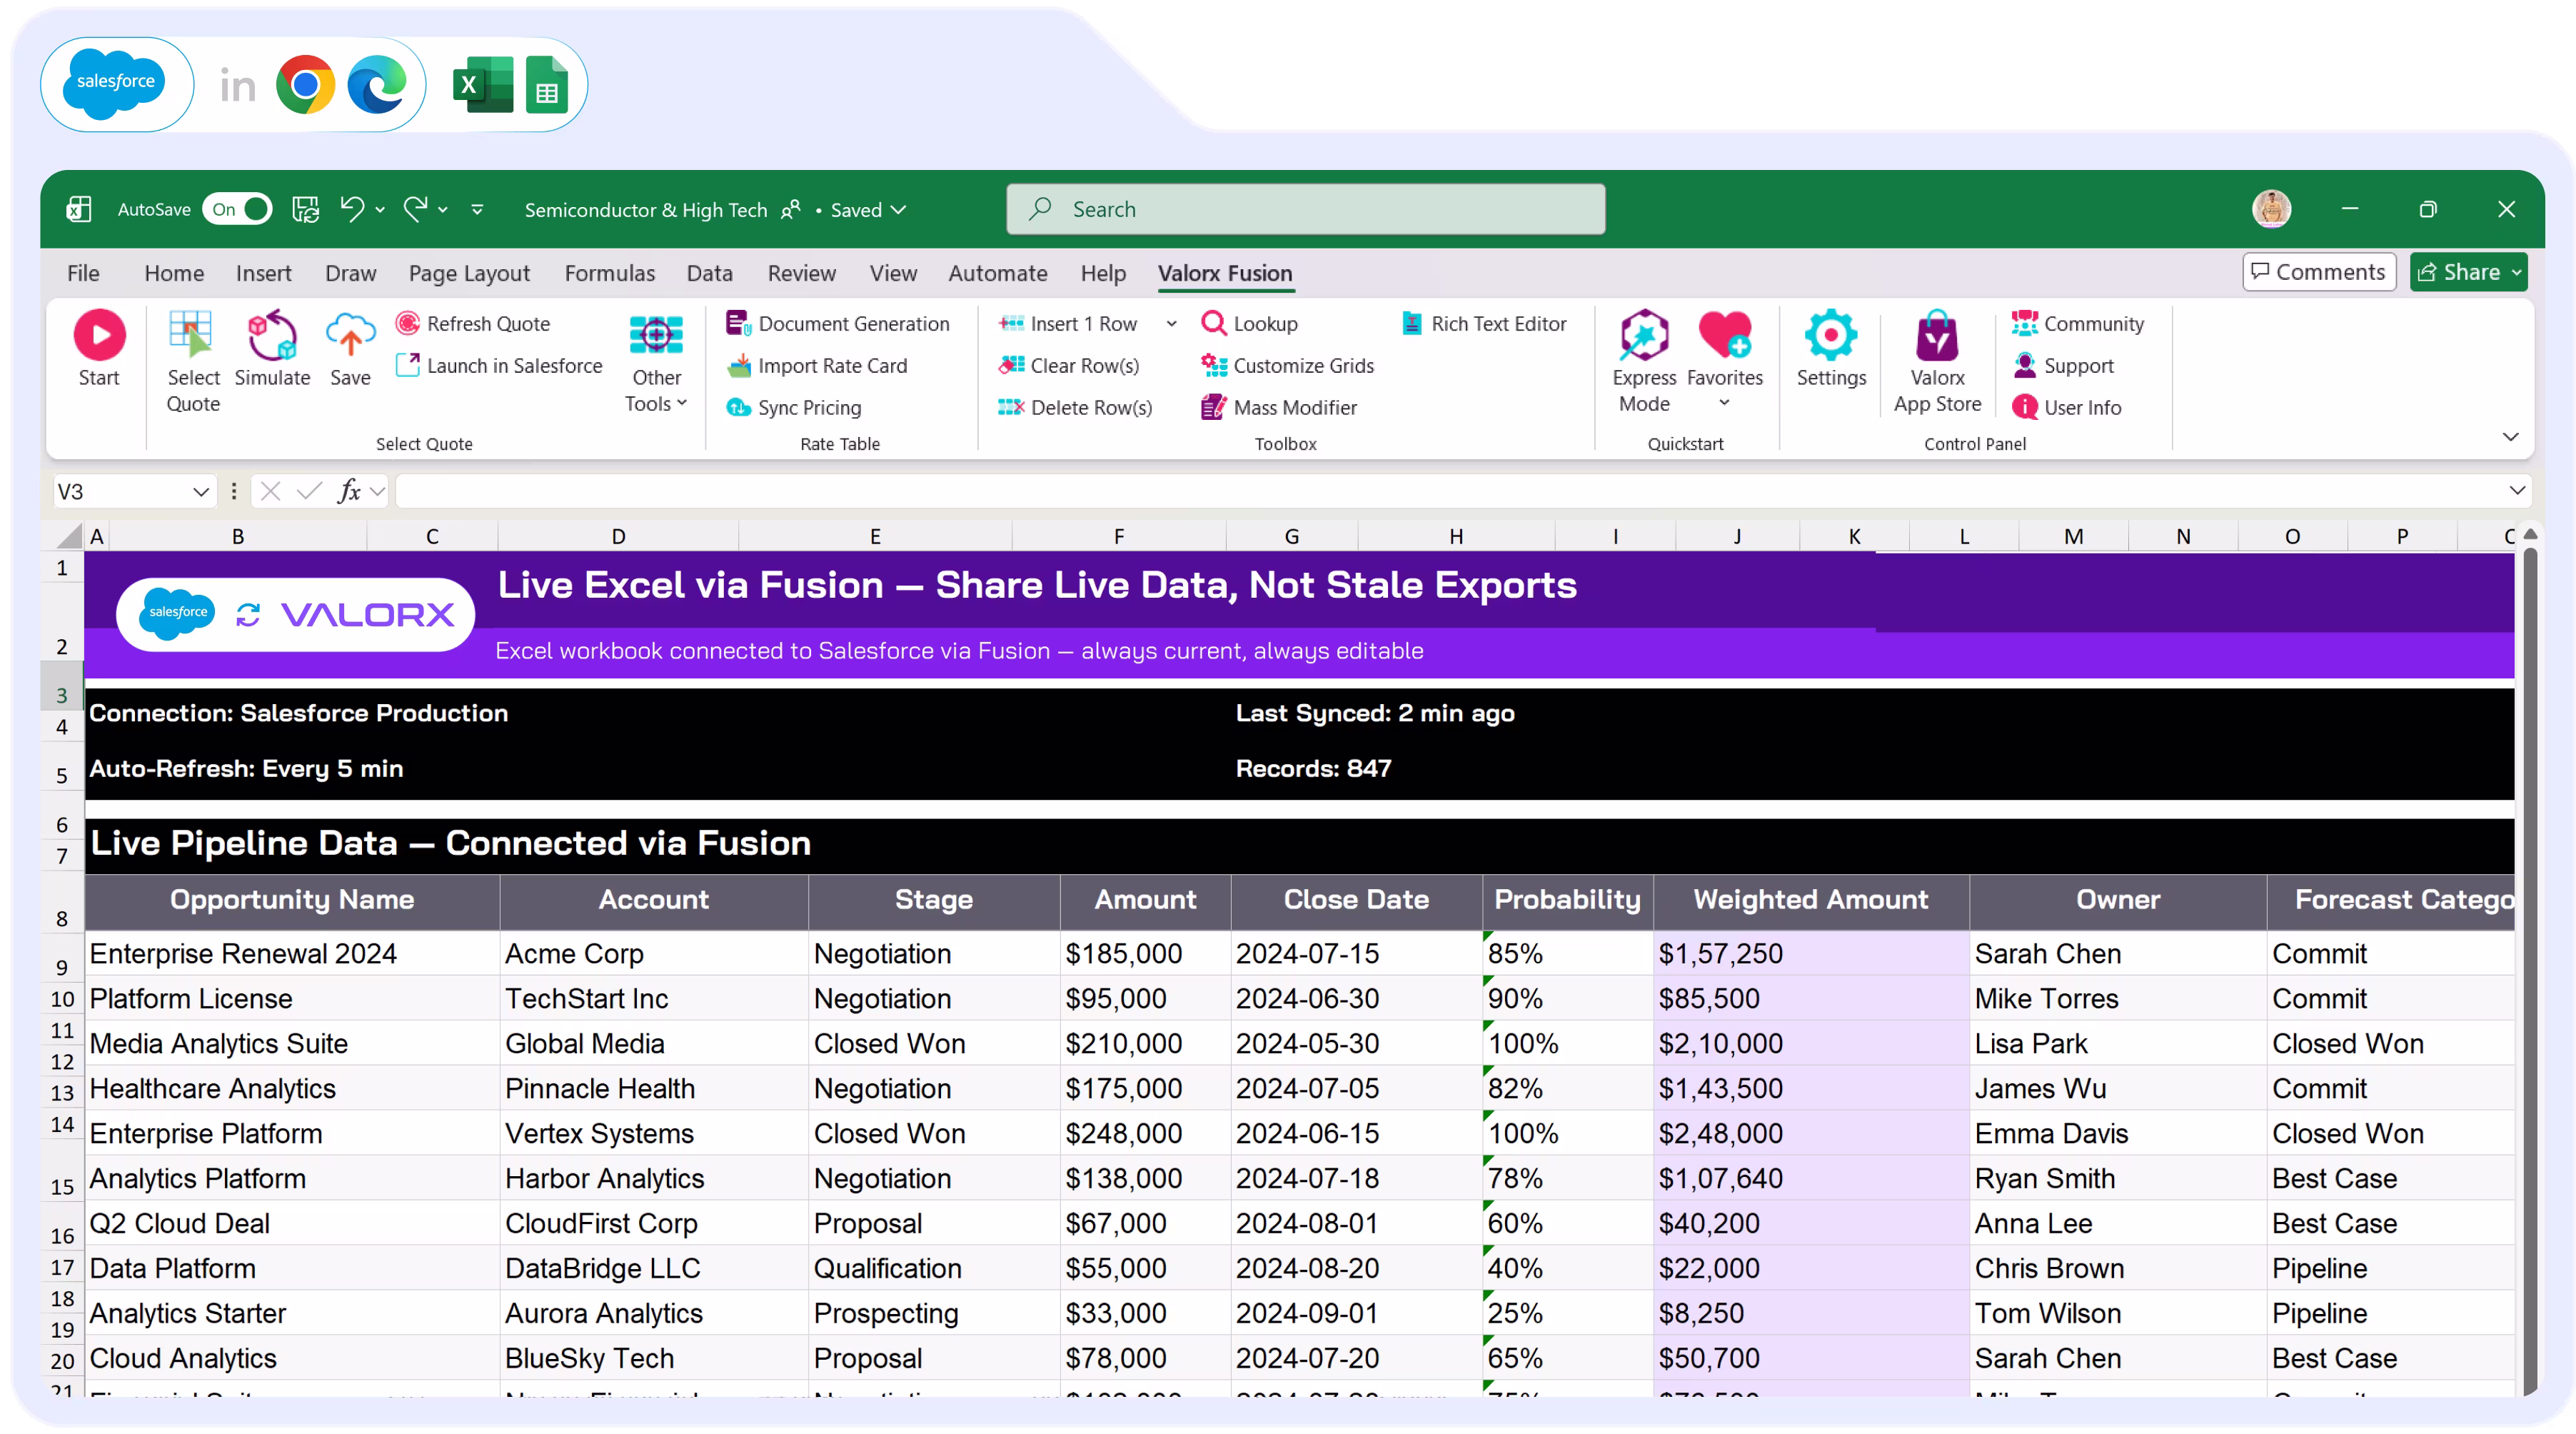
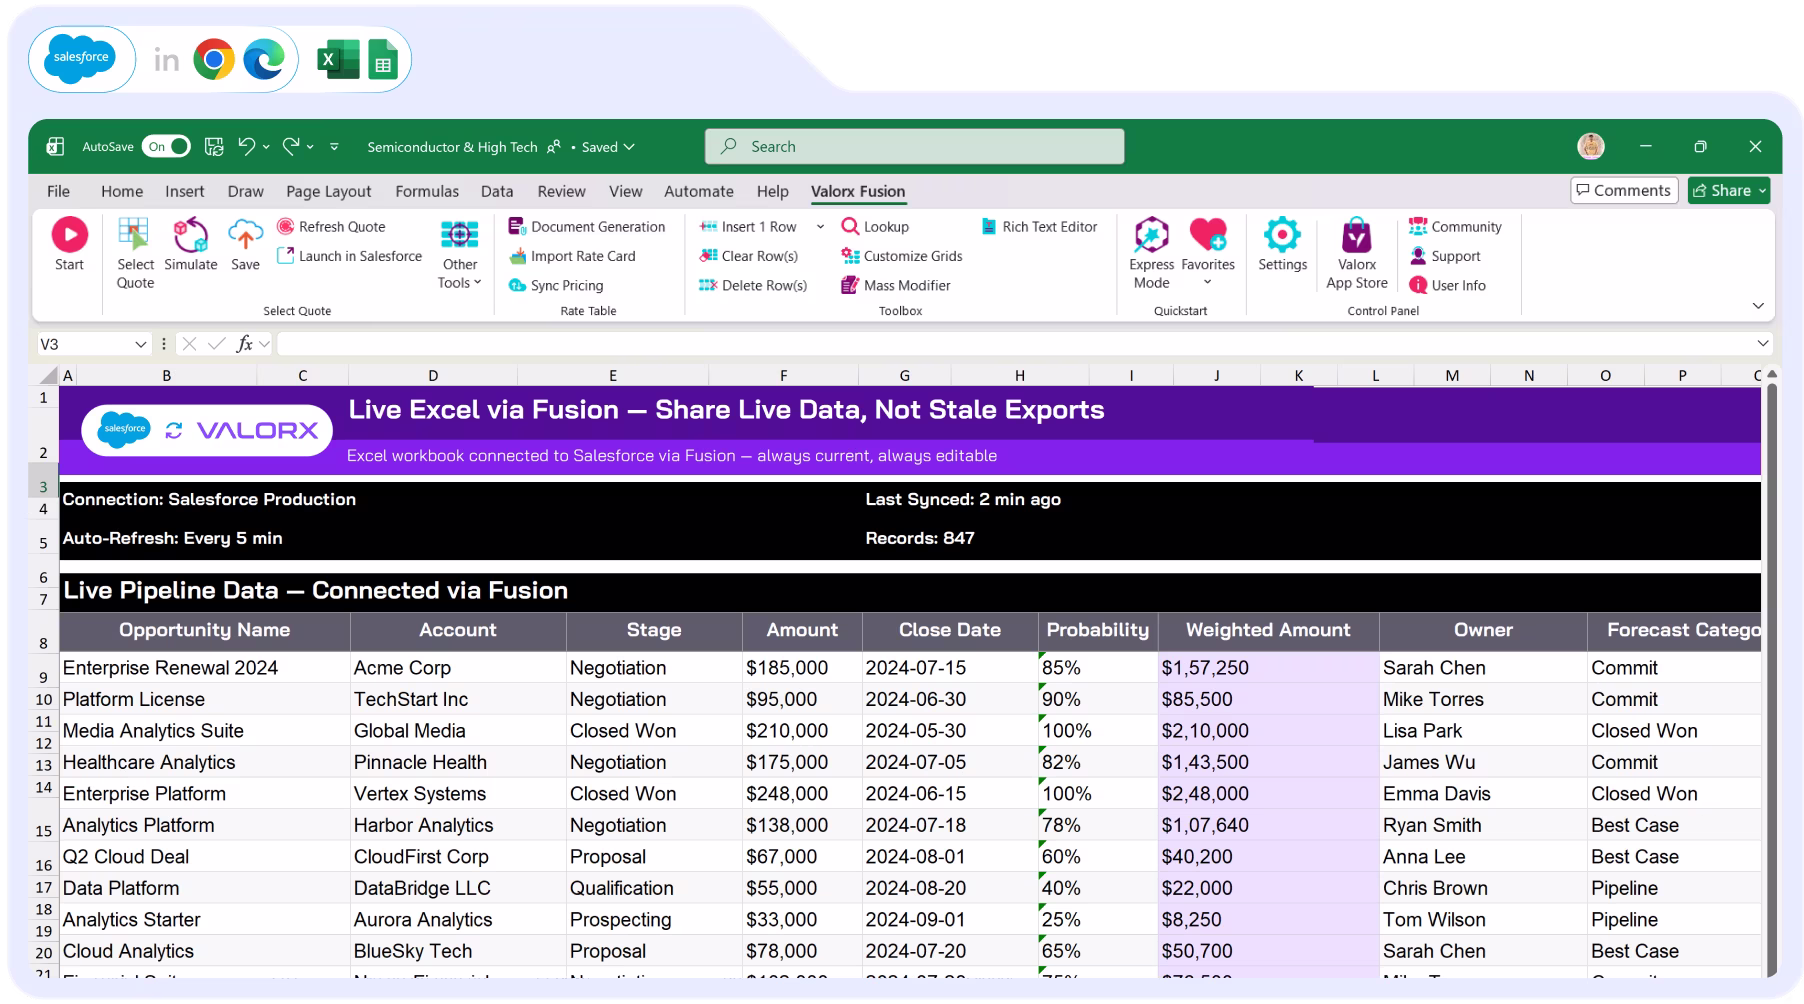
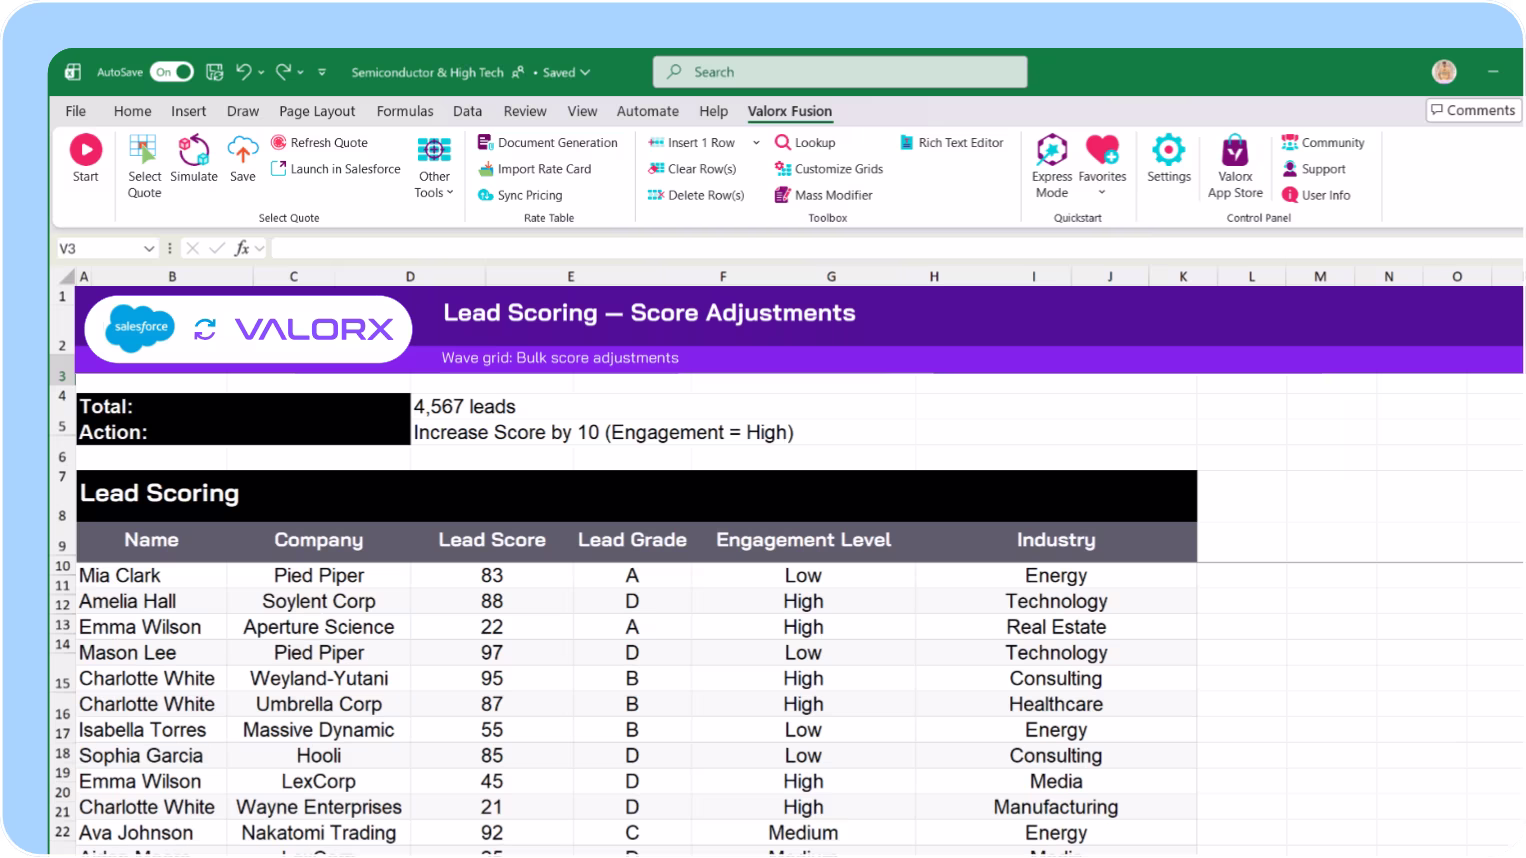
Work in Salesforce like you work in a spreadsheet.

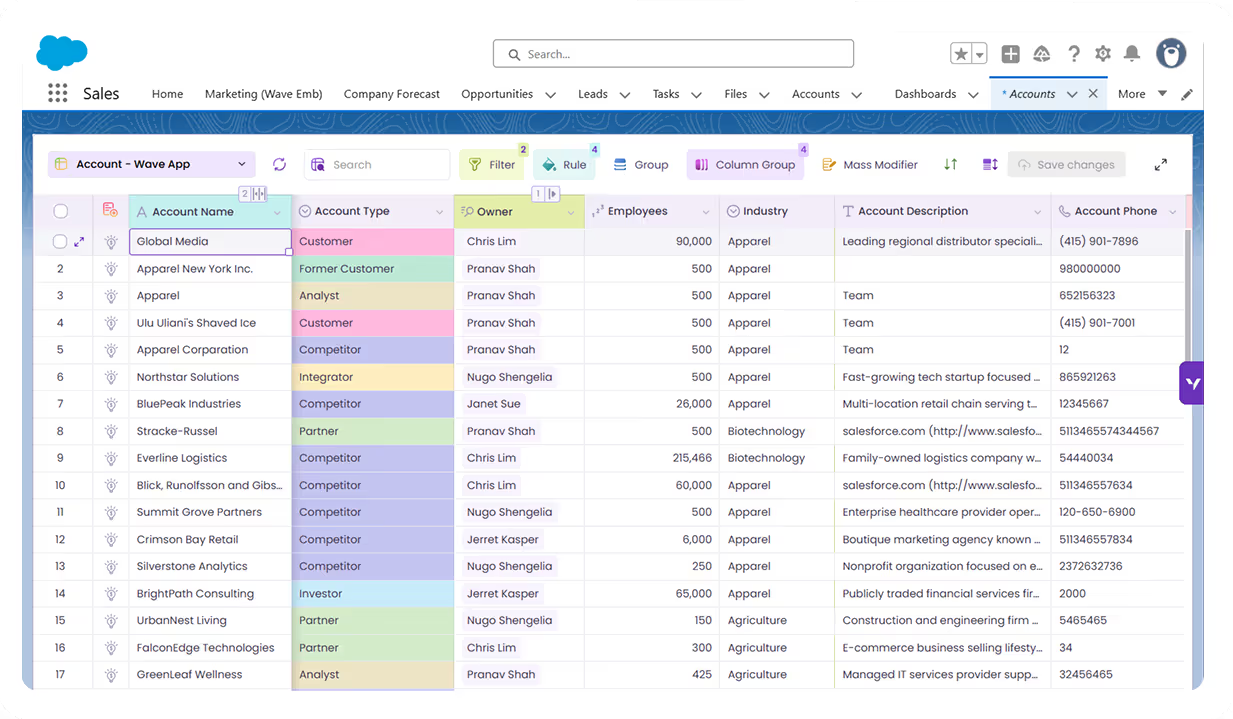
See what Valorx adds to Salesforce

Salesforce connects your value chain. Valorx makes the data manageable.
Without Valorx
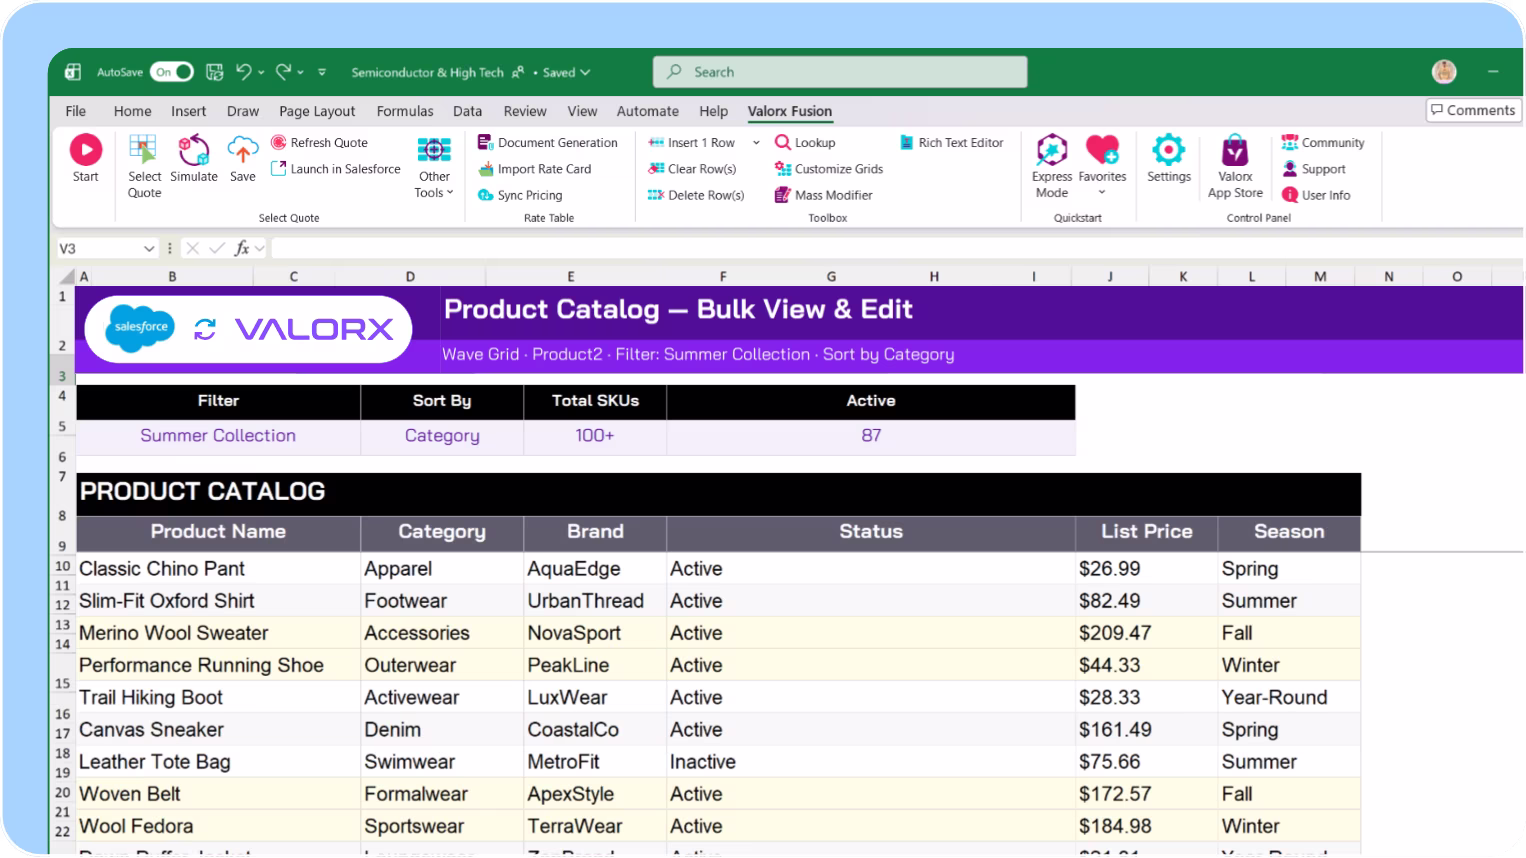
Catalog edits one SKU at a time
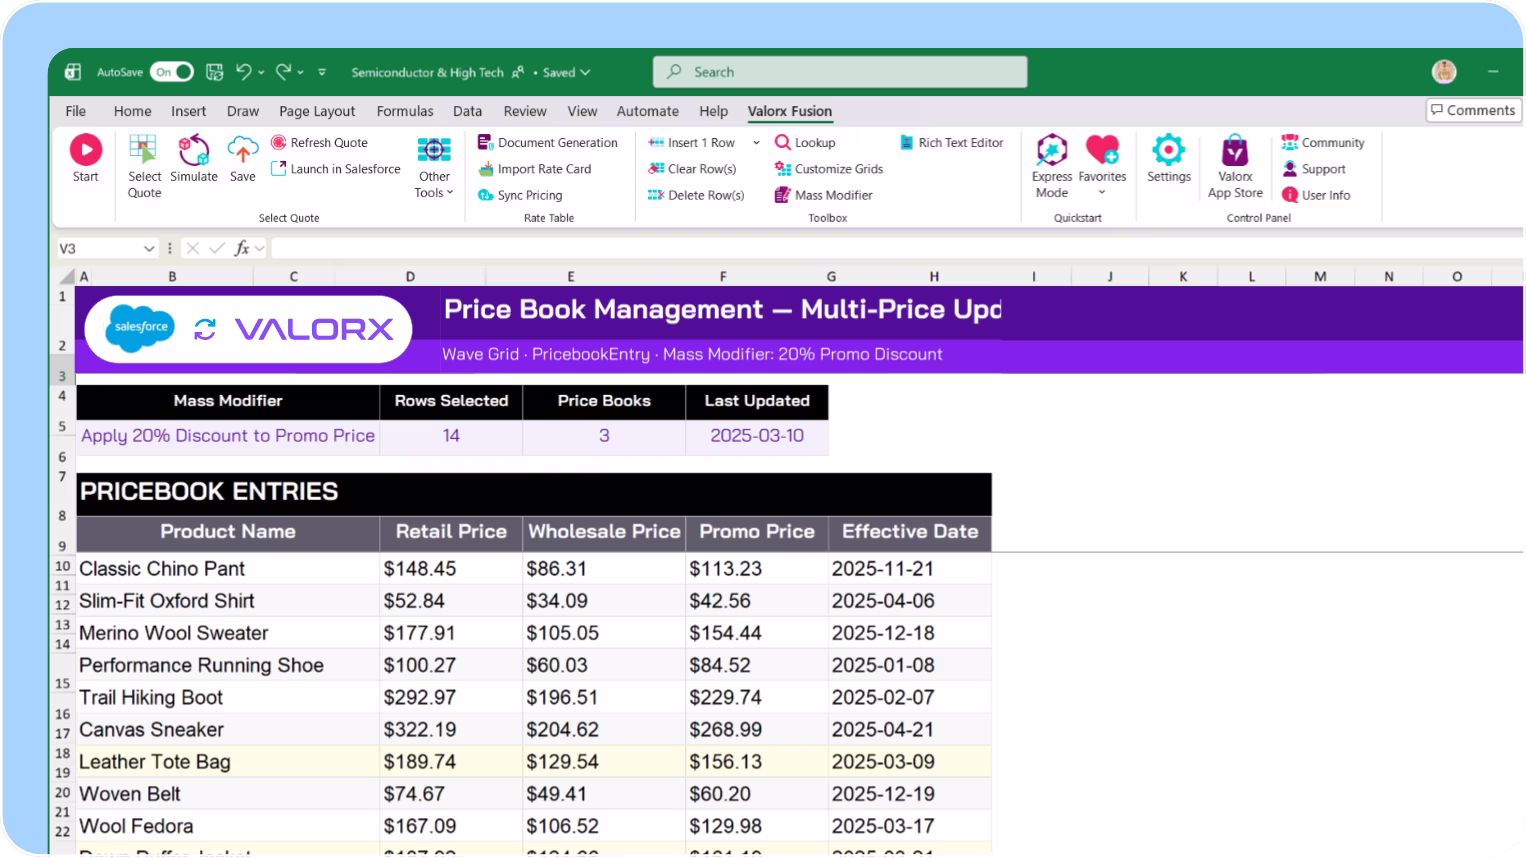
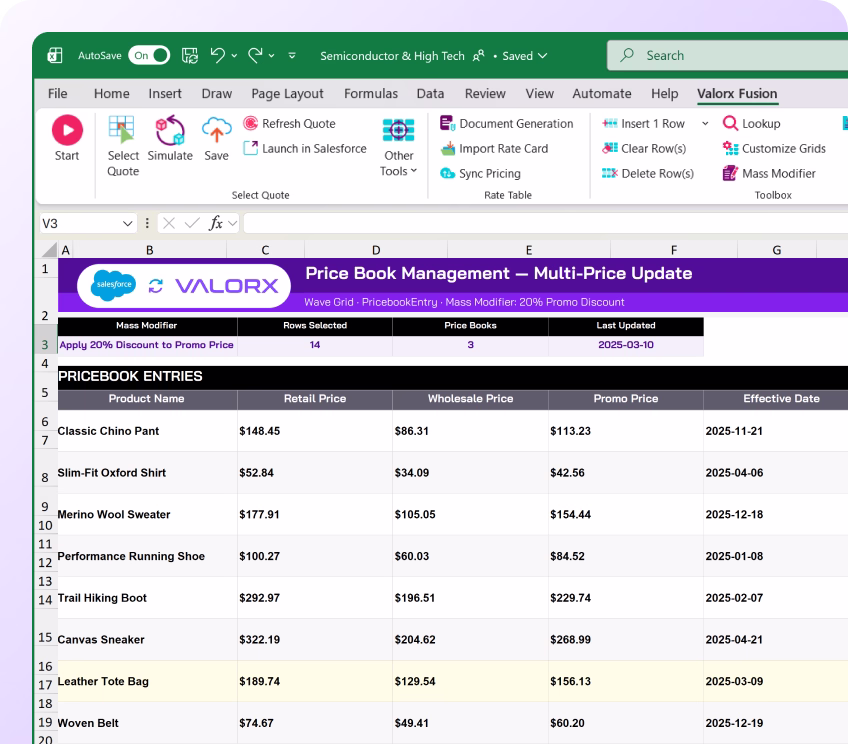
Price books updated in separate exports
Store rollups require pulling multiple reports
Supplier compliance tracked in siloed sheets
With Valorx
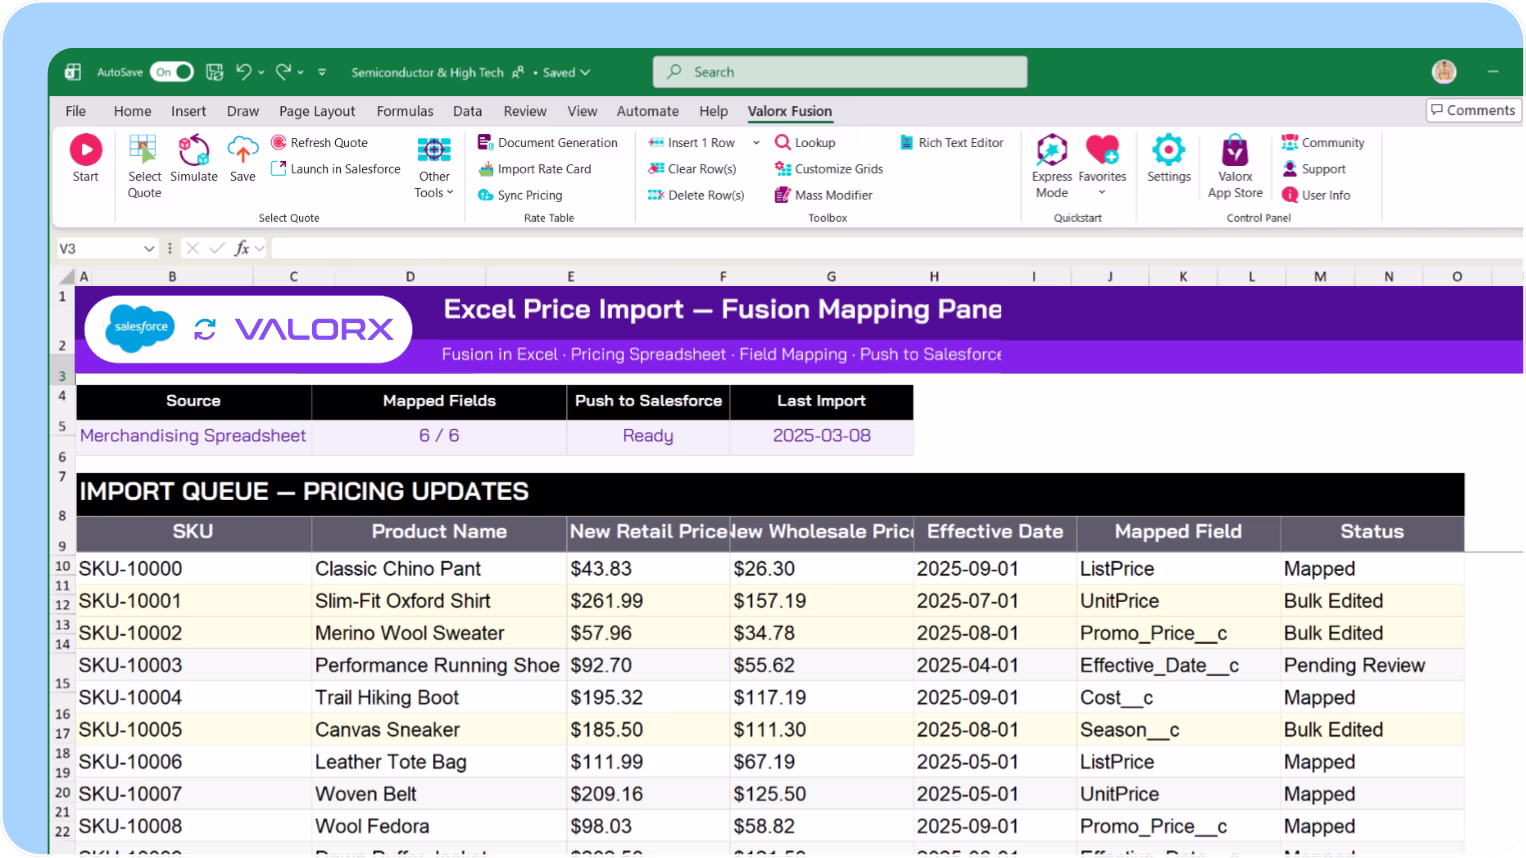
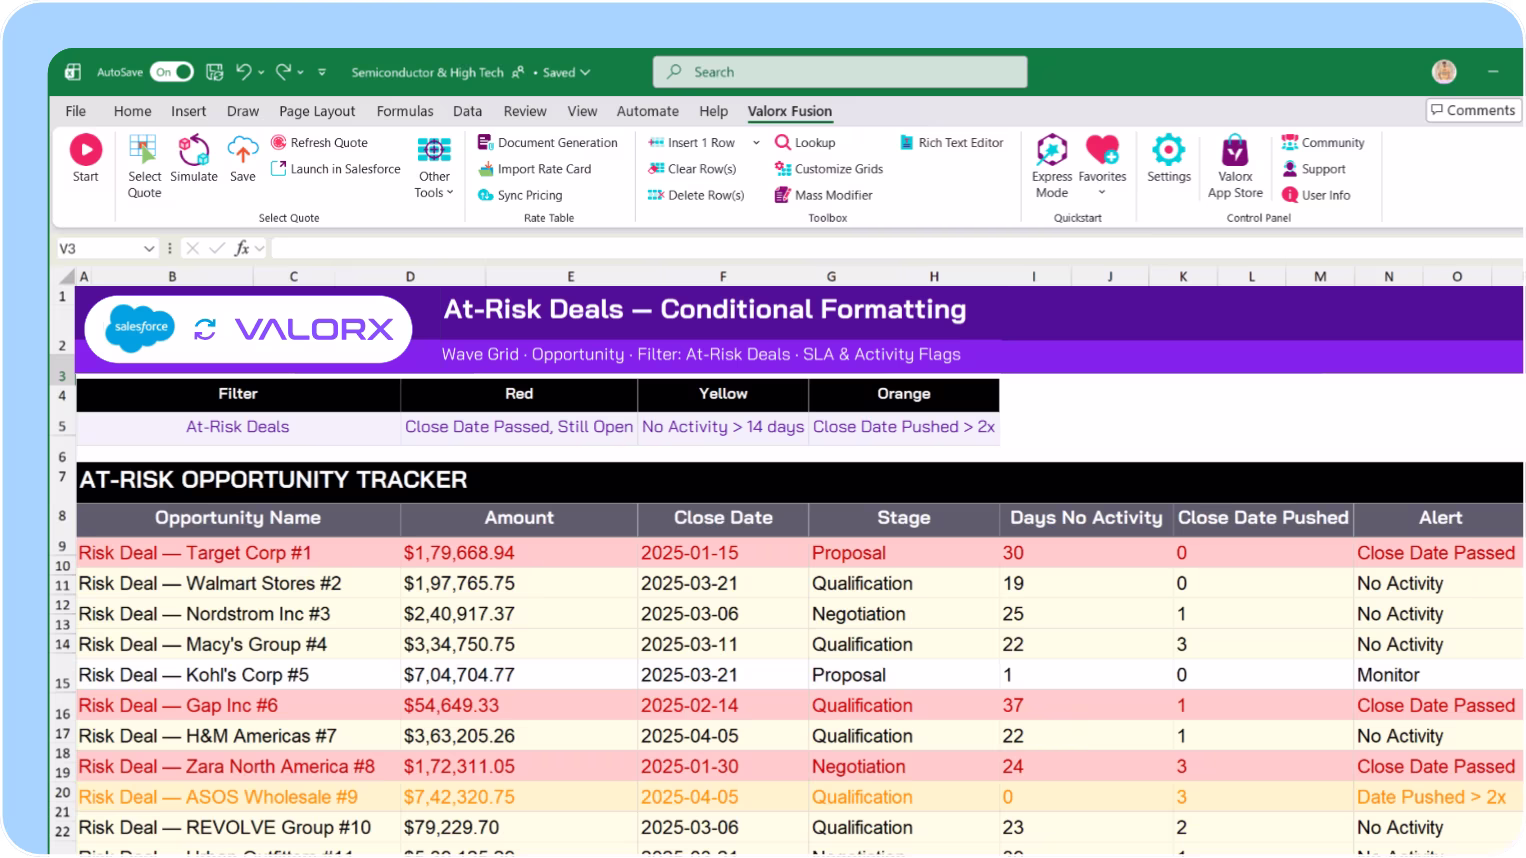
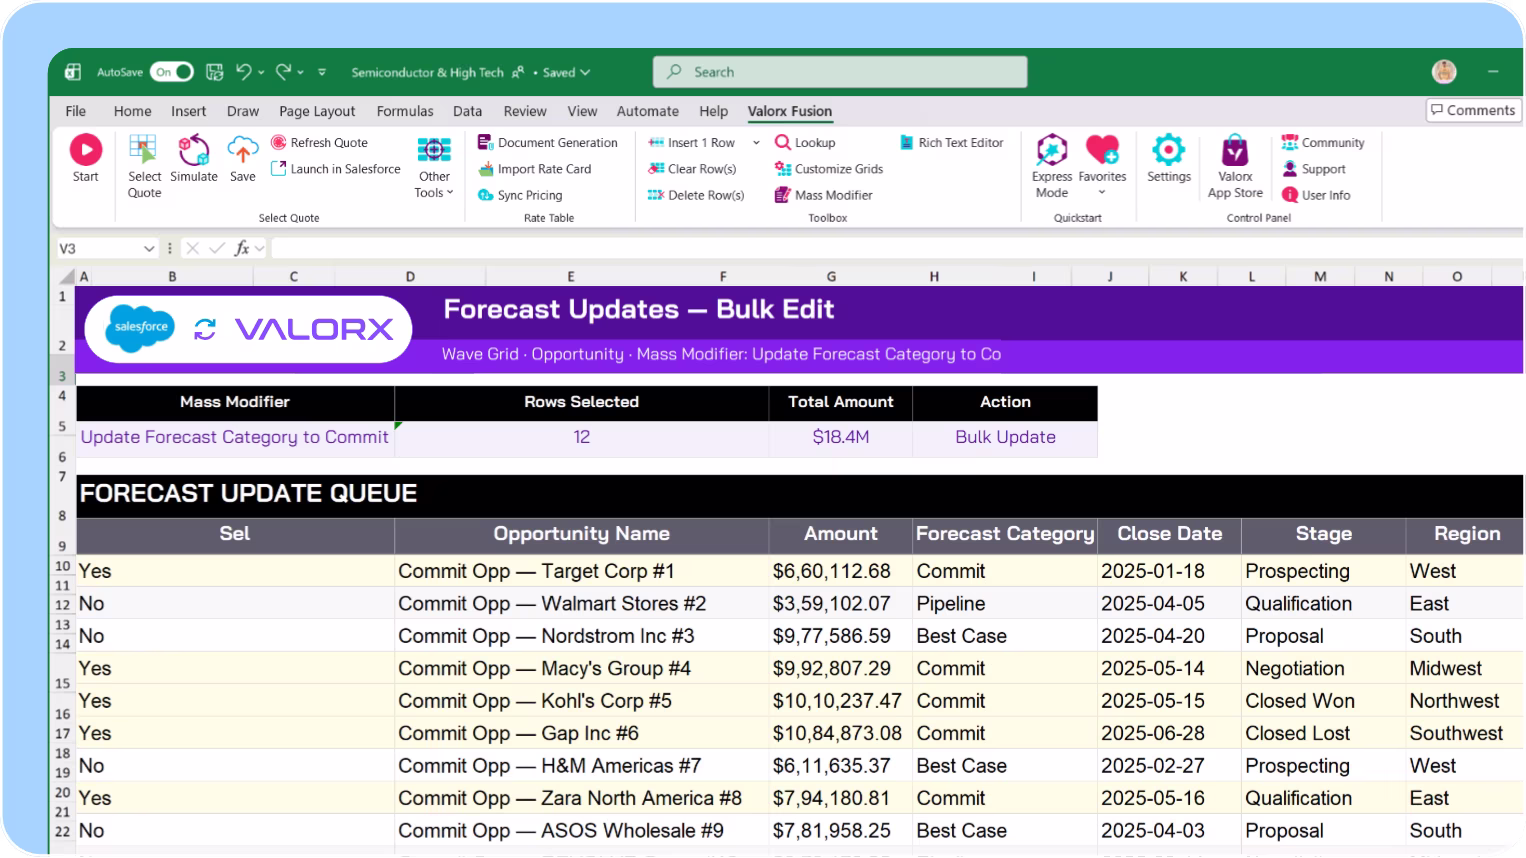
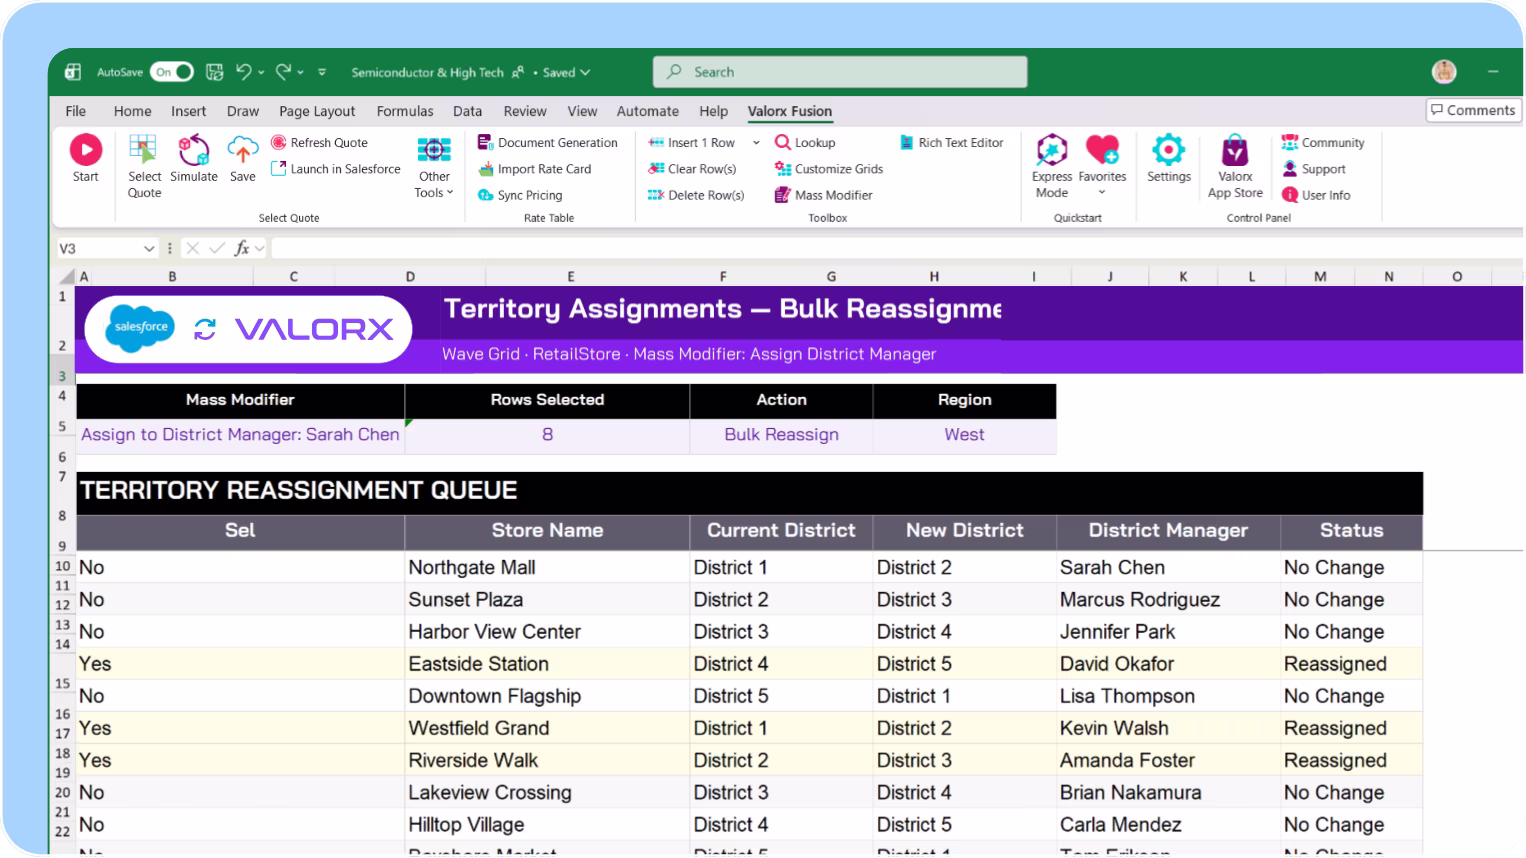
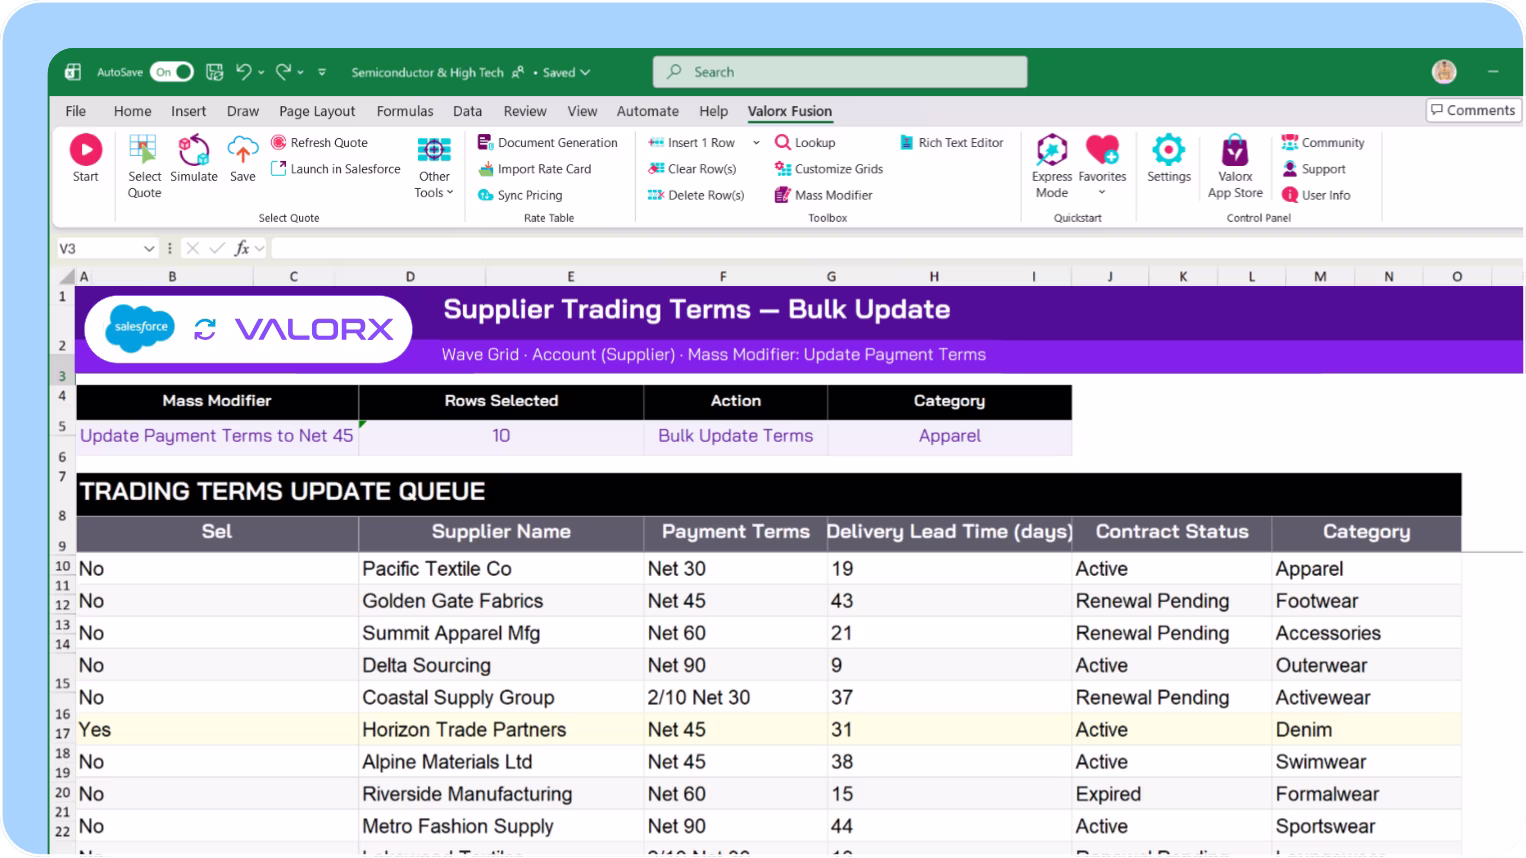
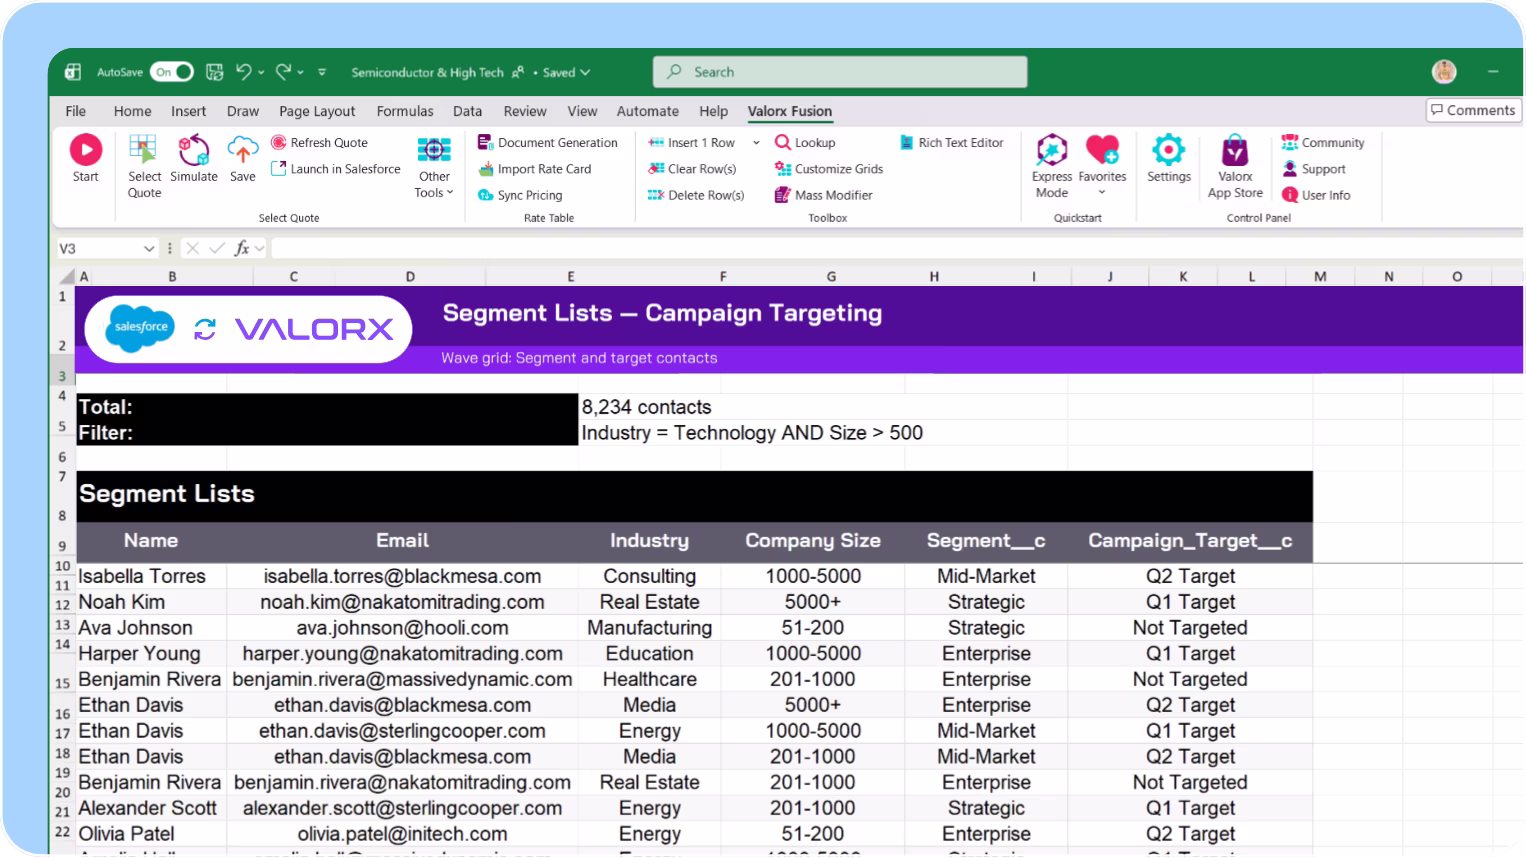
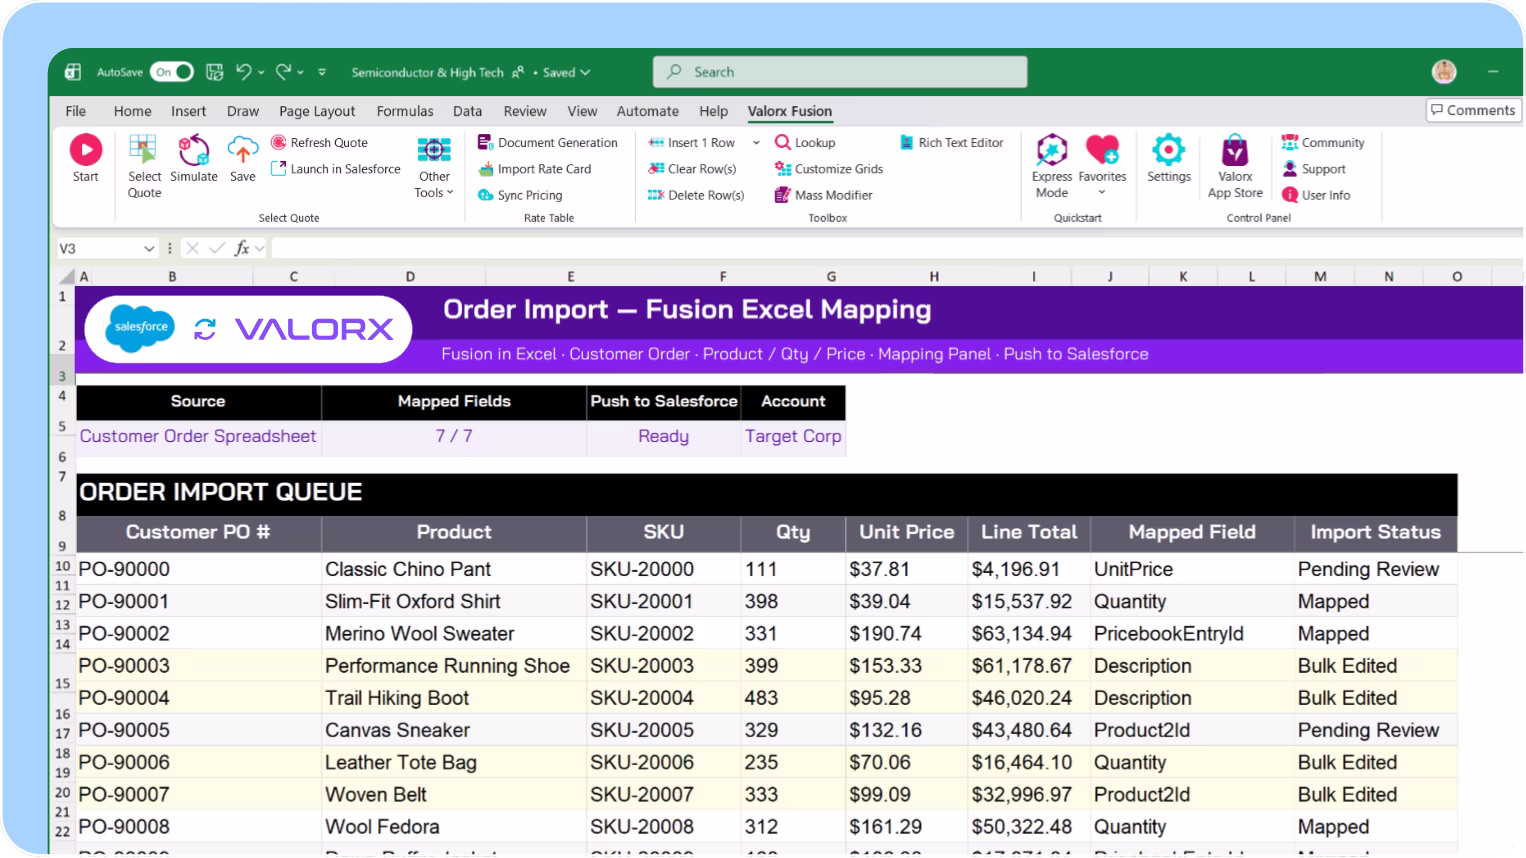
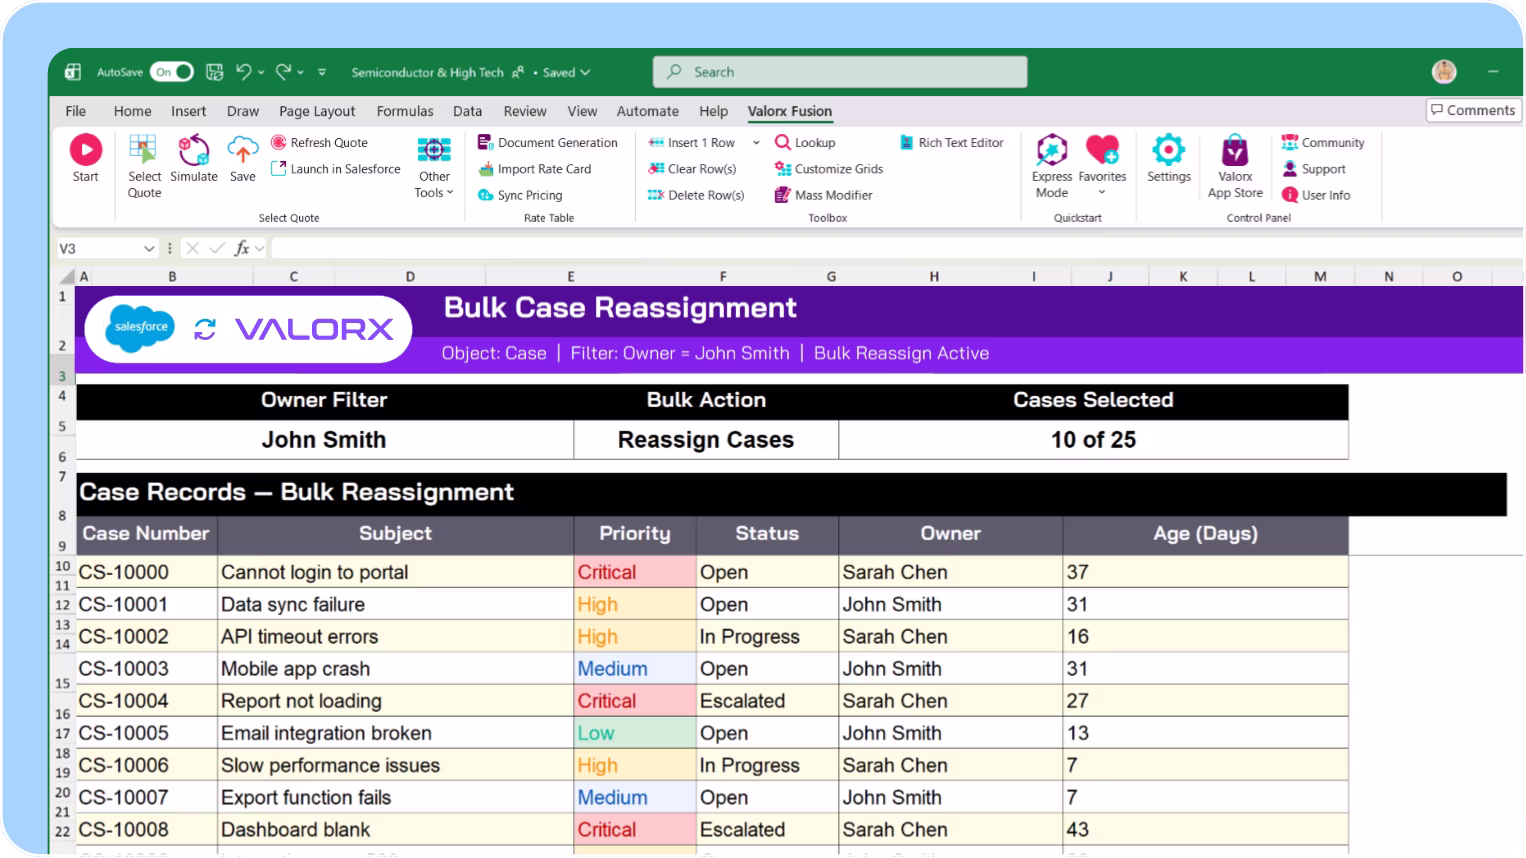
Bulk update attributes across thousands of products
Retail, wholesale, and promo in one grid
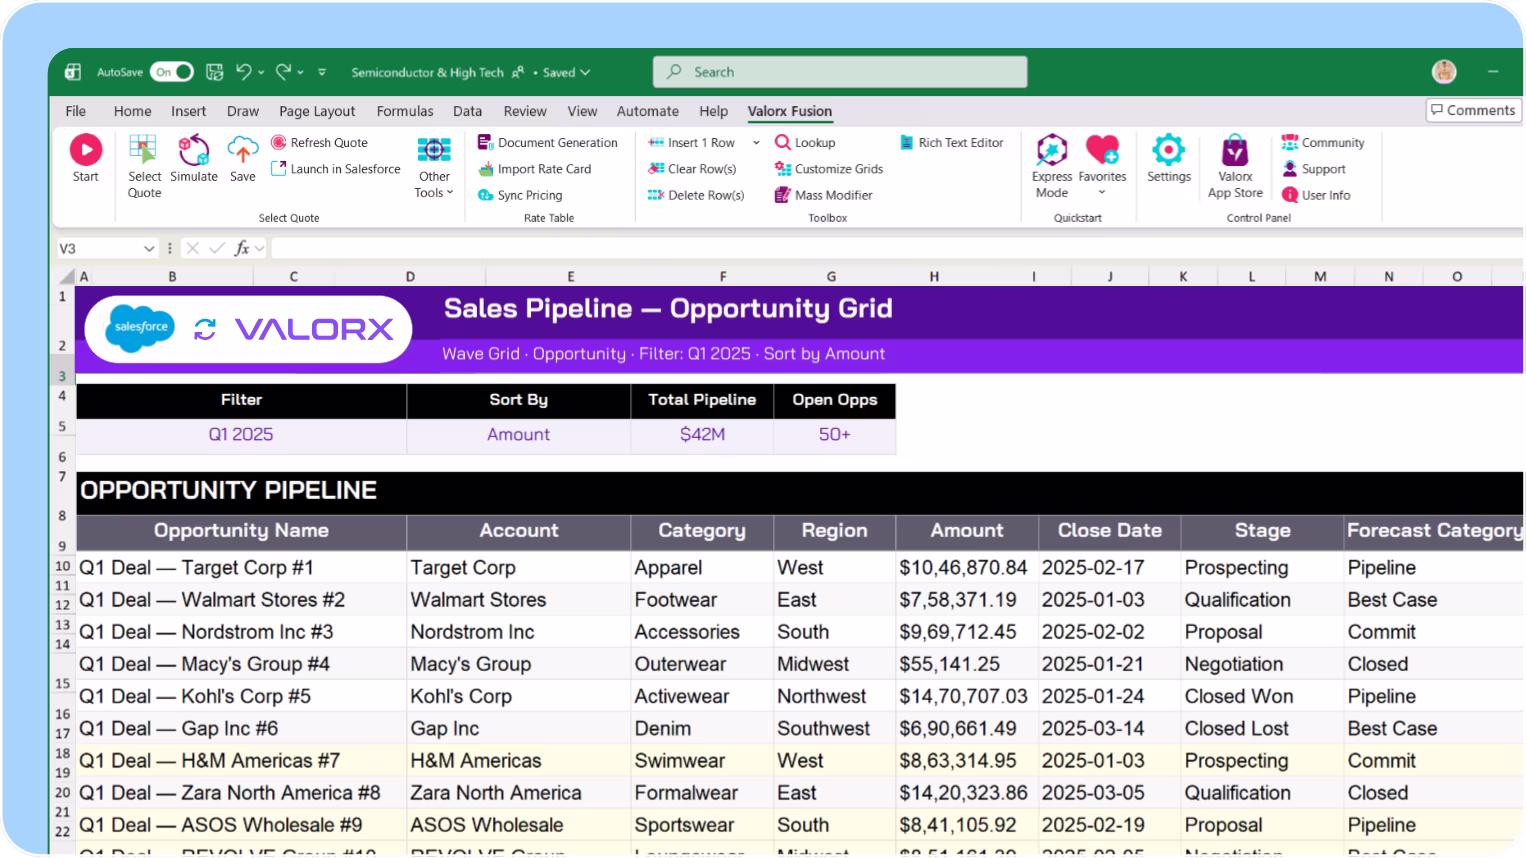
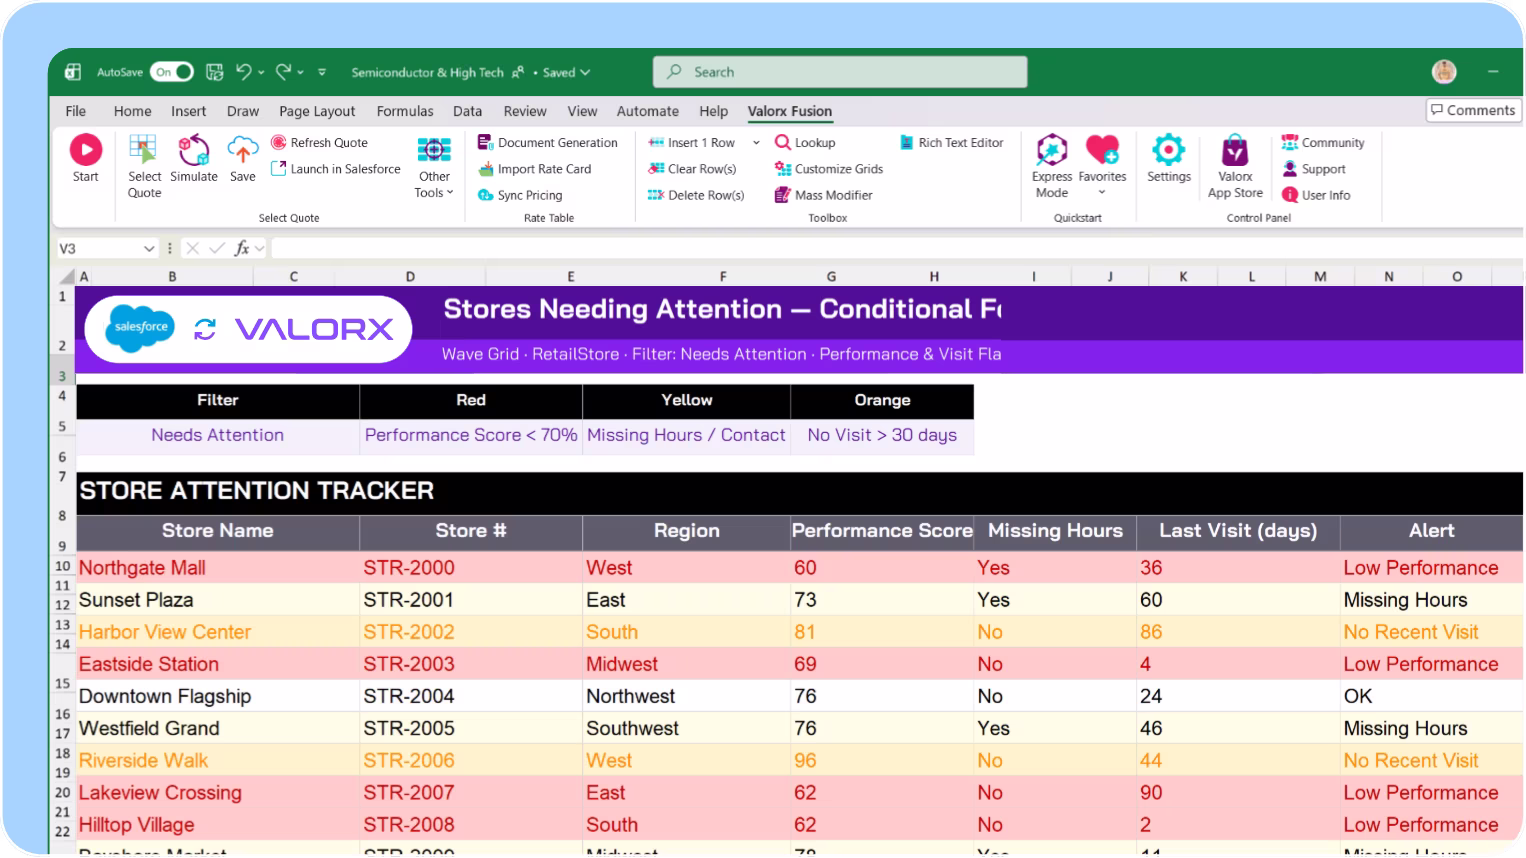
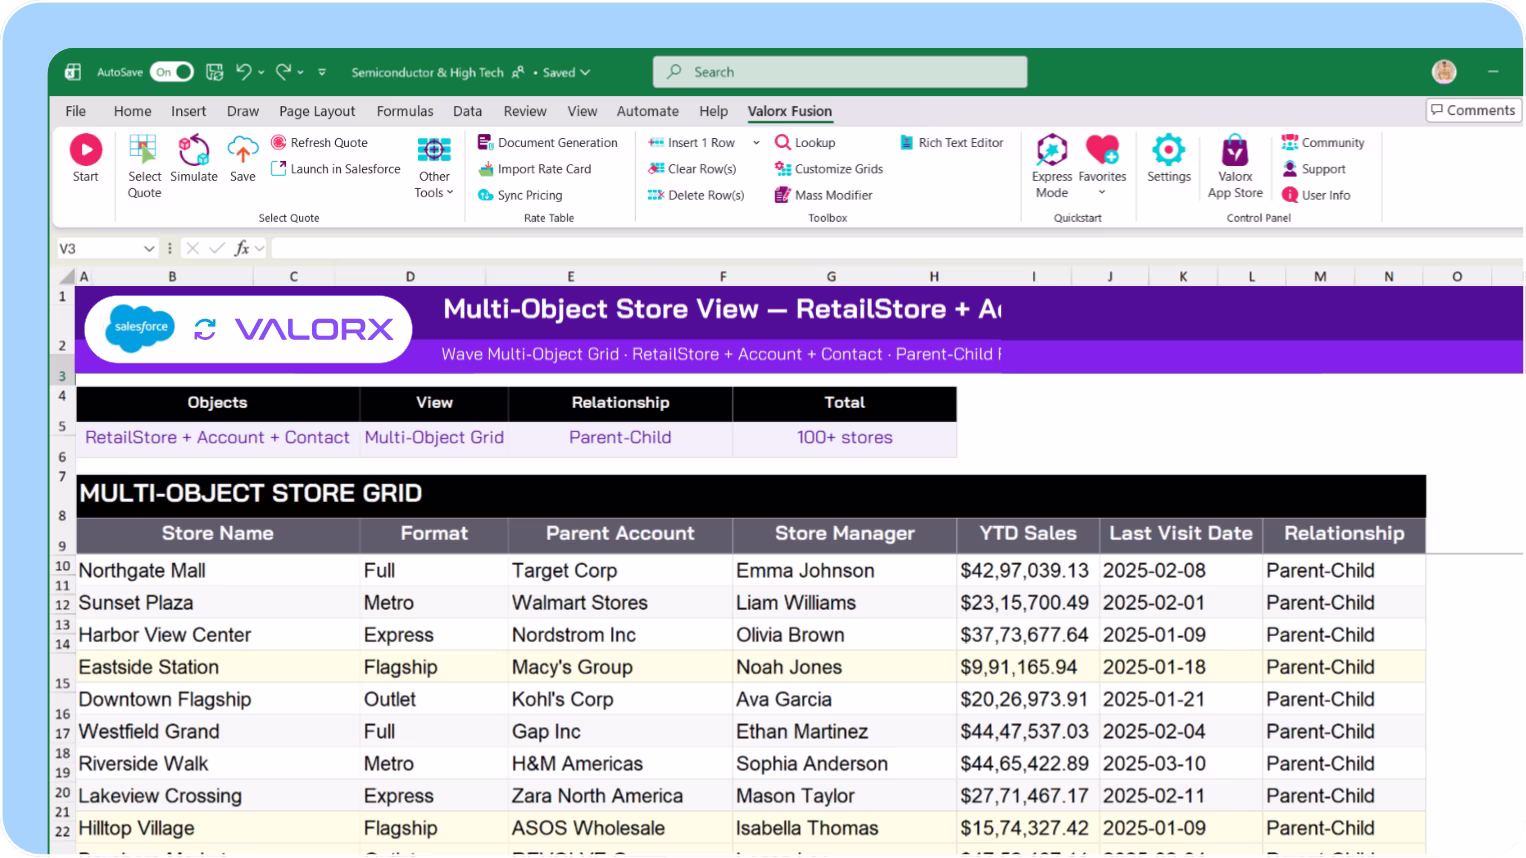
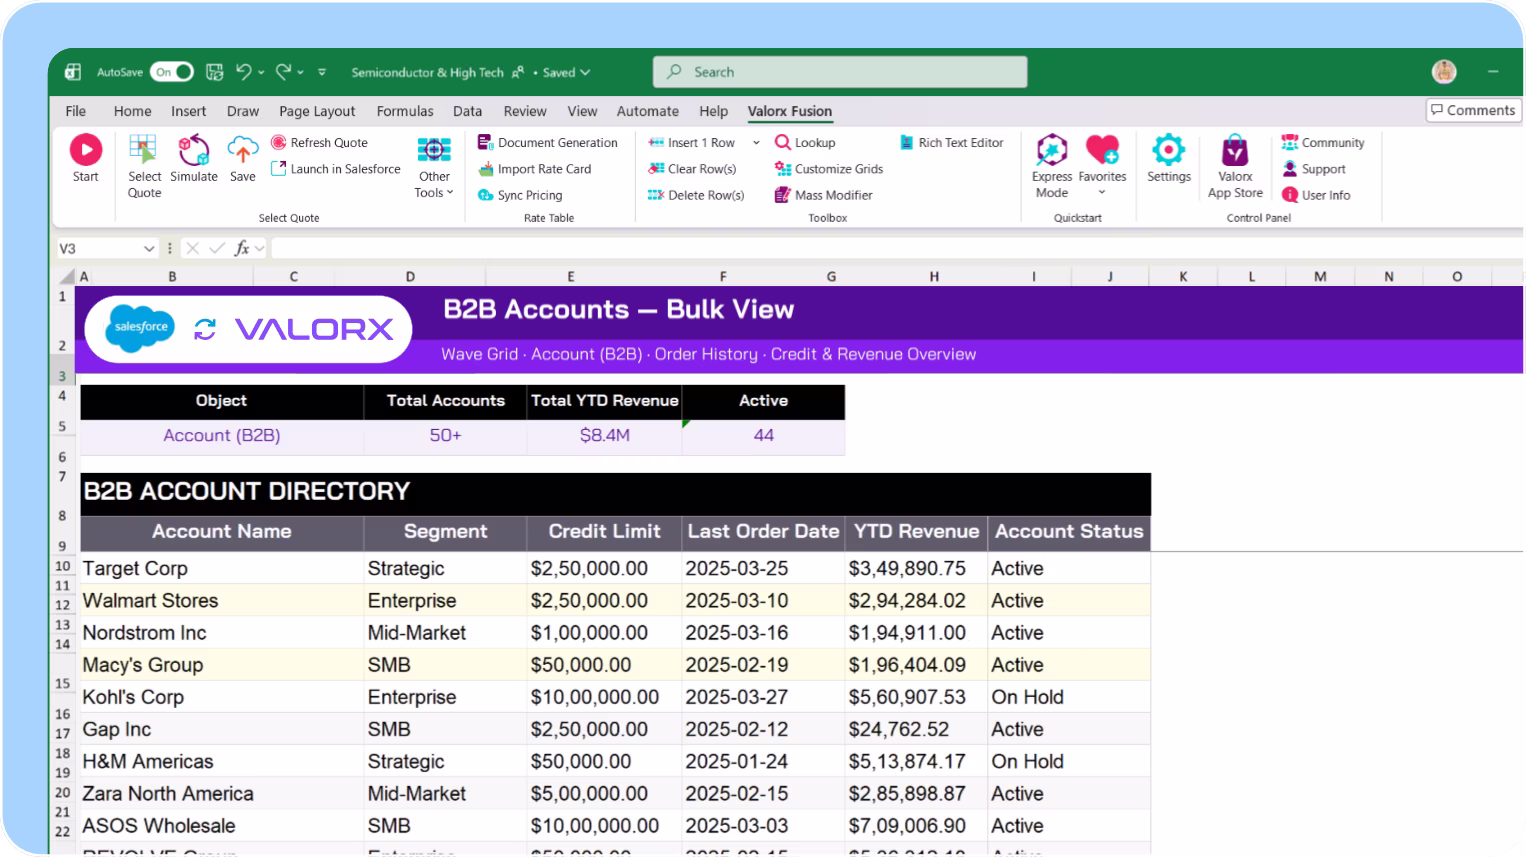
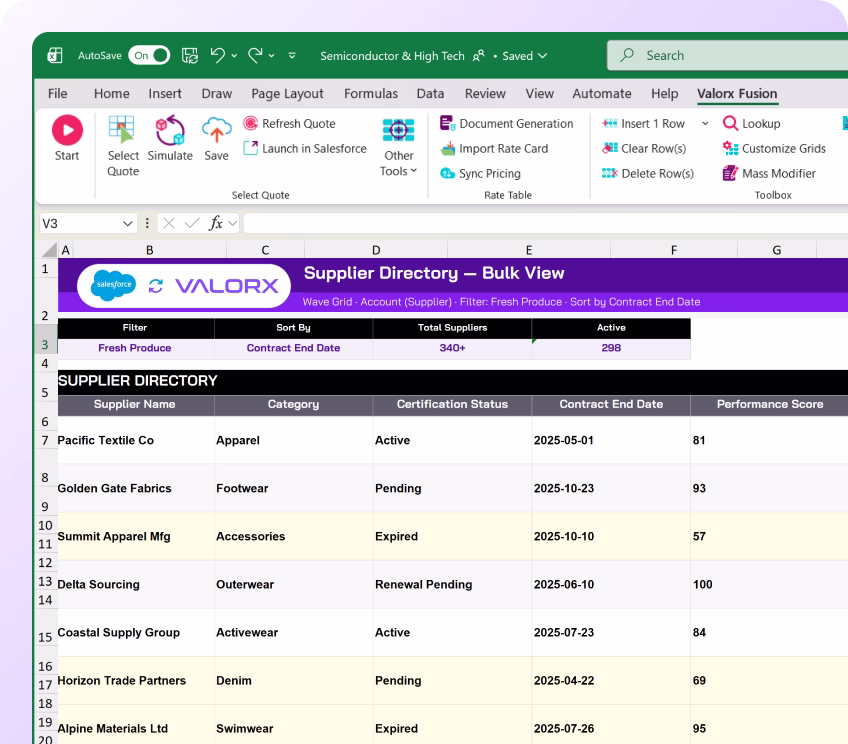
All locations with performance in one view
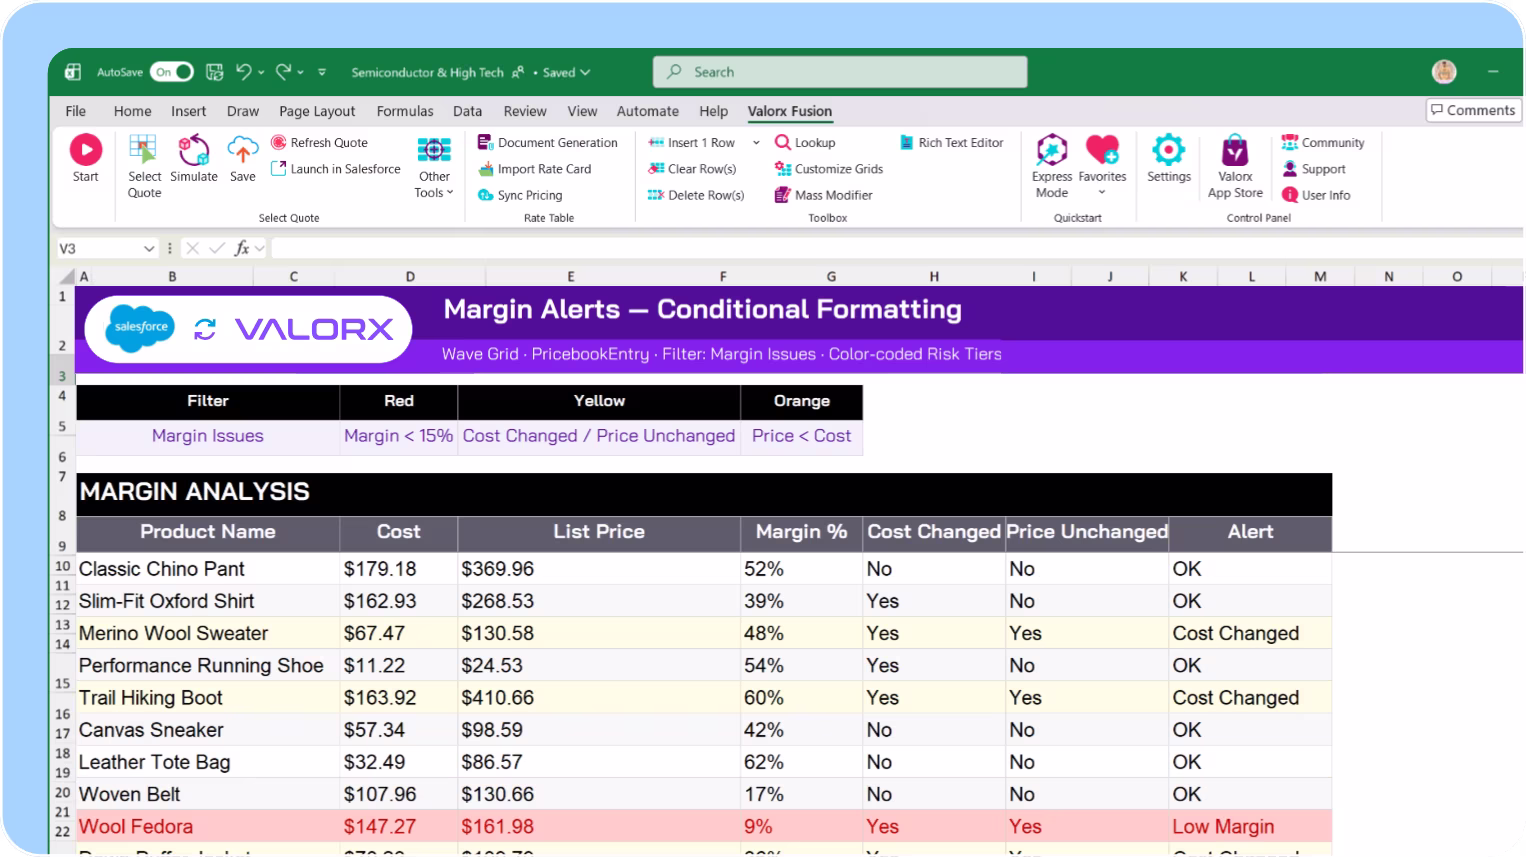
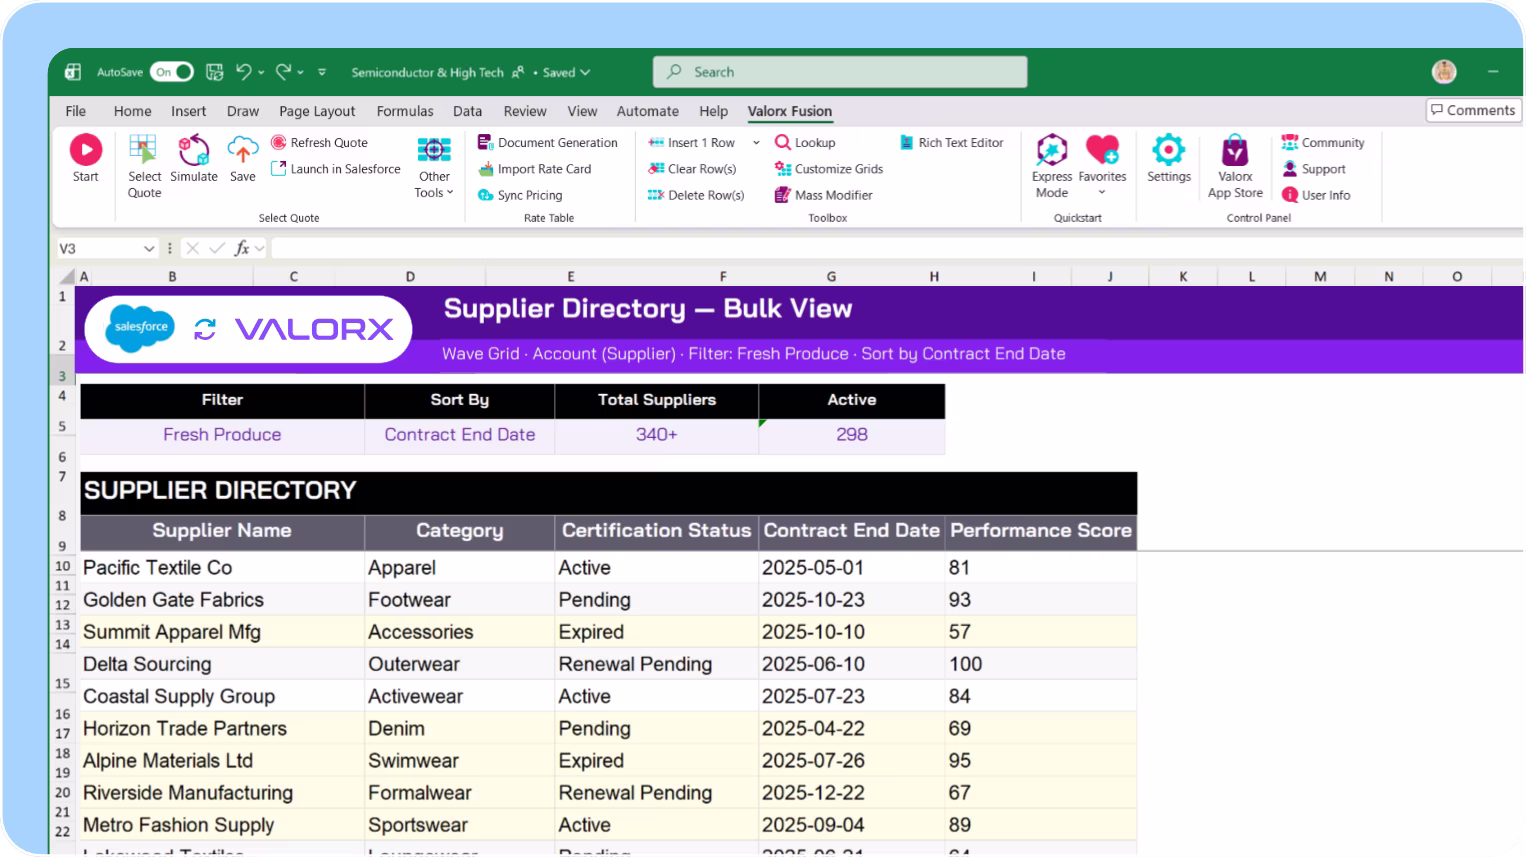
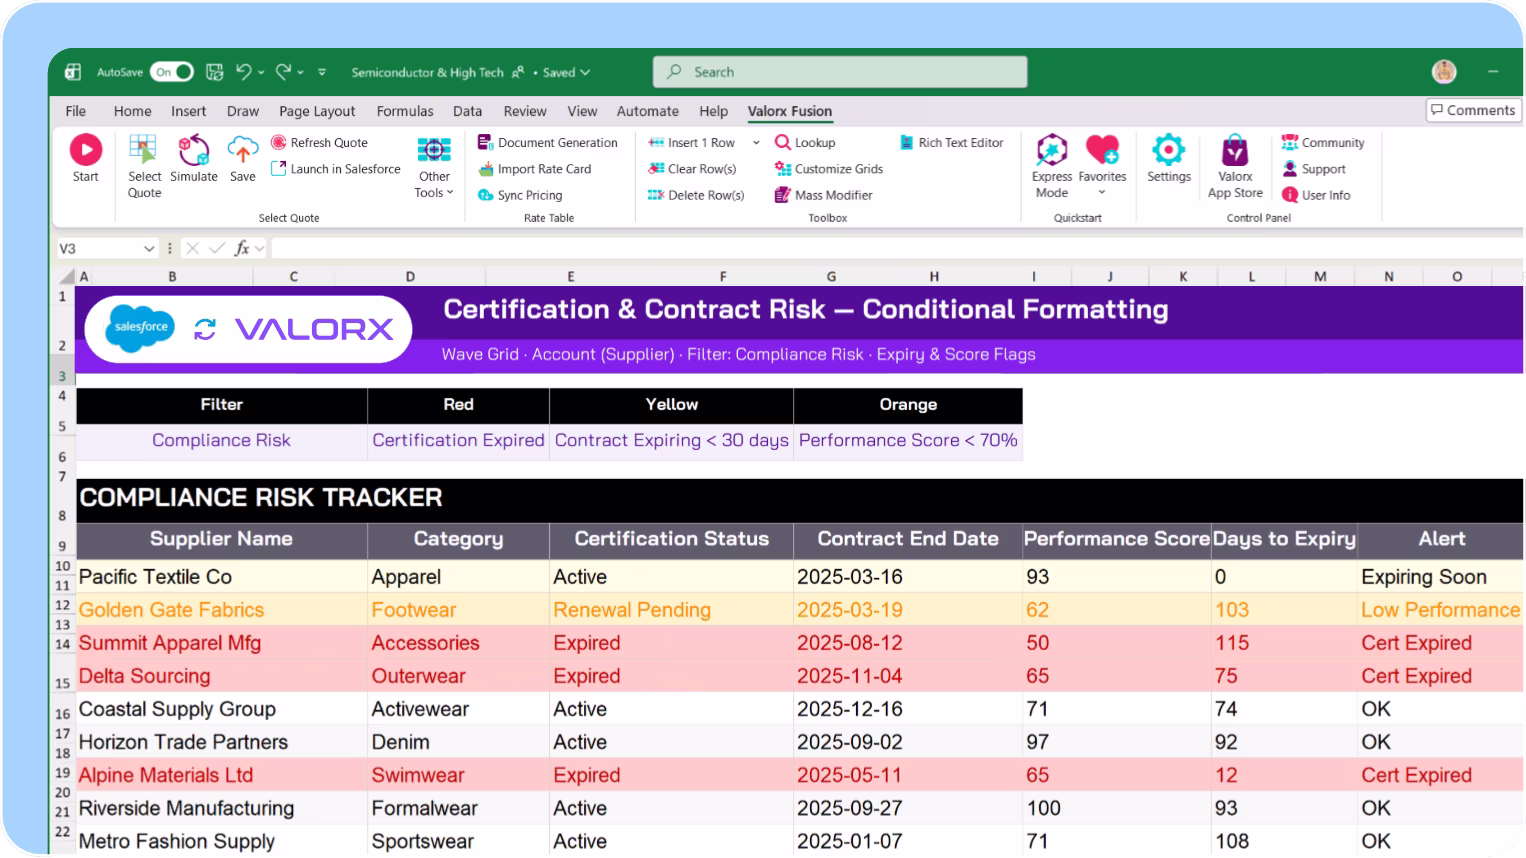
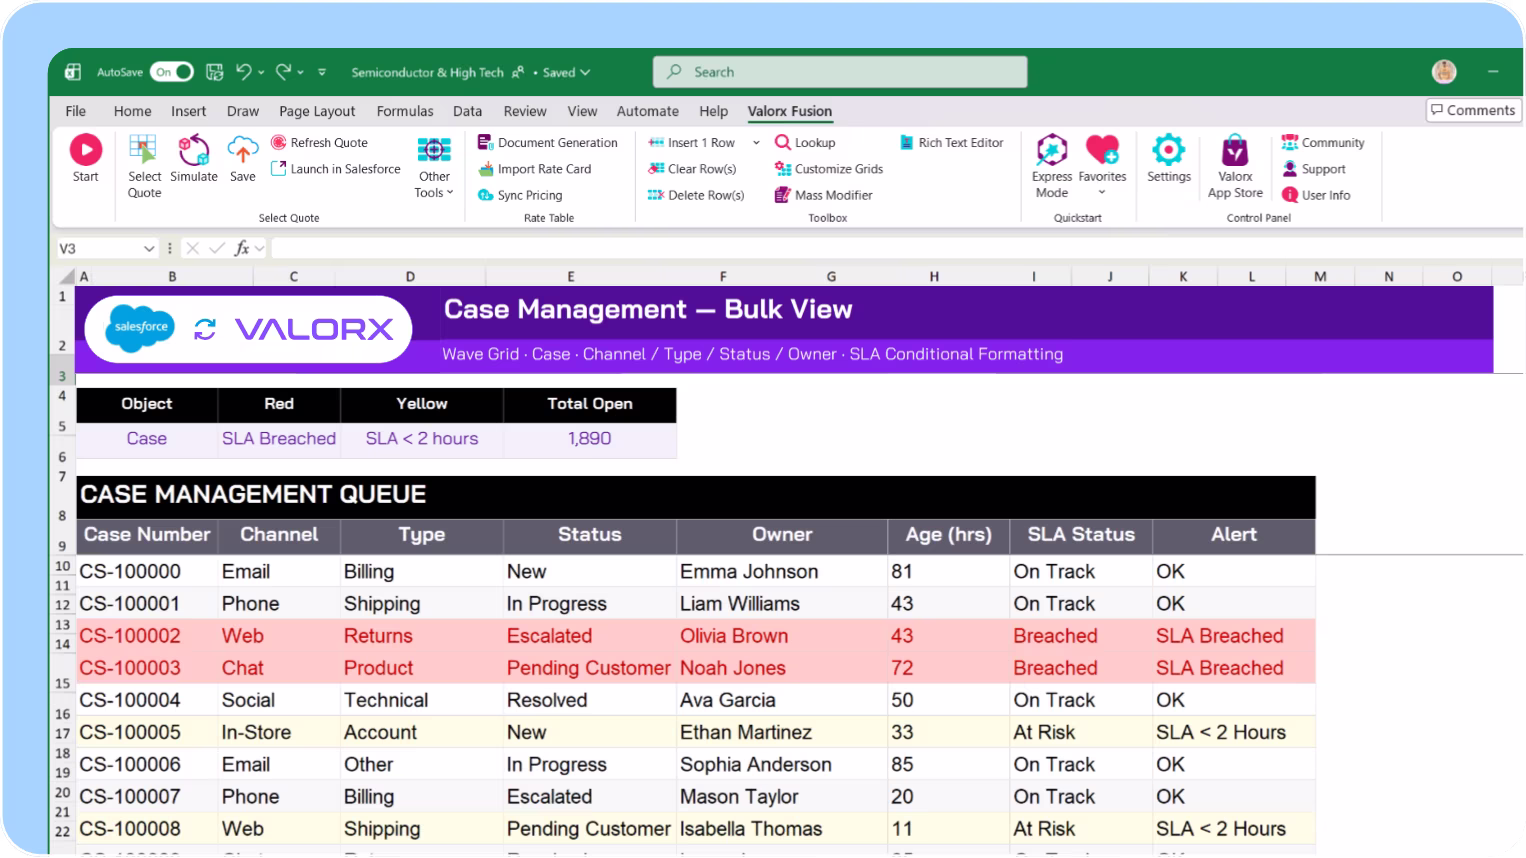
Expiring certs and contracts flagged automatically
Smiling young man with glasses and a beard wearing a black shirt on a light gray circular background with a small purple circle in the top right.
Eric Winston
Service Supervisor
Book a demo
Soft gradient background fading from light gray to pale blue and white.

Why teams choose Valorx

Valorx has made complicated data uploads quick and easy, saving valuable time. The implementation was quick and the support simply top notch!
Dawn Jamieson
Business Operations Manager, Nvidia
Besides the efficiency gains, Valorx has helped us mitigate data leakage and improve accuracy. I highly recommend Valorx to anyone who works with Salesforce data.
Ben Wong
Sales Operations Manager, Adobe
We use Valorx for sales forecasting. Very powerful, highly recommend the product. Excellent customer service and exceptionally fast turnaround time.
Karthik Dosapati
Data Analyst, Western Digital
When it comes to data migration, I see a limitless potential to migrate CPQ master data between orgs to maintain configuration, pricing, and quoting processes without the need for lengthy data loader processing.
Ian Jones
Senior Revenue Cloud Consultant, Globant

Frequently asked questions

Does Valorx work with Manufacturing Cloud?
Yes. Valorx works with all Manufacturing Cloud objects including Sales Agreements, Account Forecasts, and Warranty Claims.
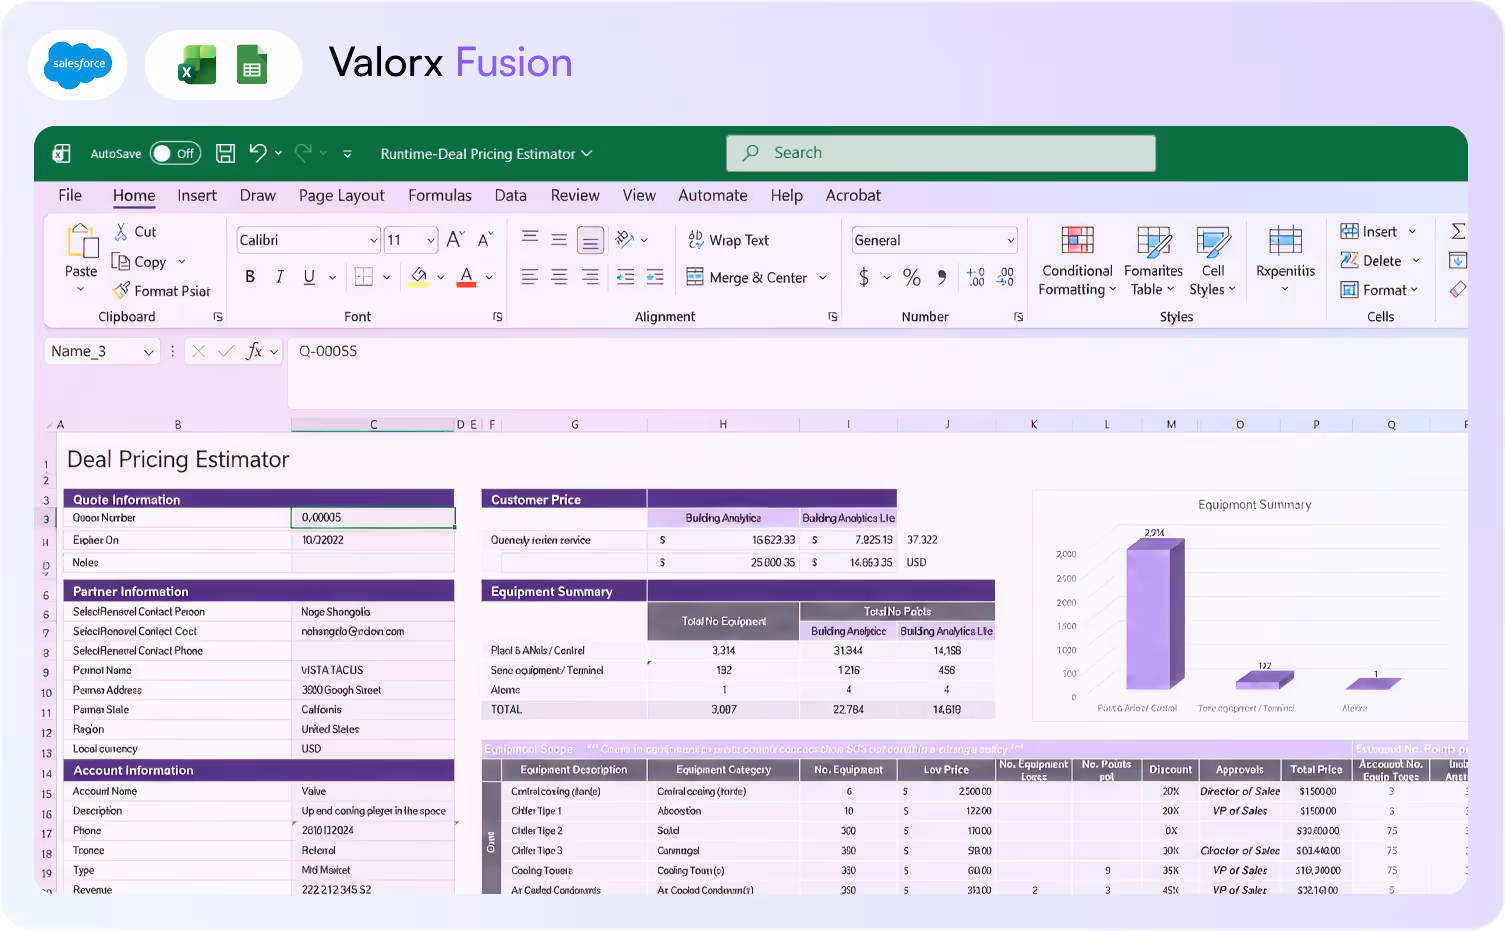
Can I use Valorx with Salesforce CPQ?
Yes. Bulk edit quote line items, update pricing across products, and compare quotes side-by-side.
How does Wave help with forecasting?
Wave lets you edit Account Forecast records in bulk—update planned quantities across accounts, products, and time periods in one grid. Conditional formatting highlights variances between planned and actual.
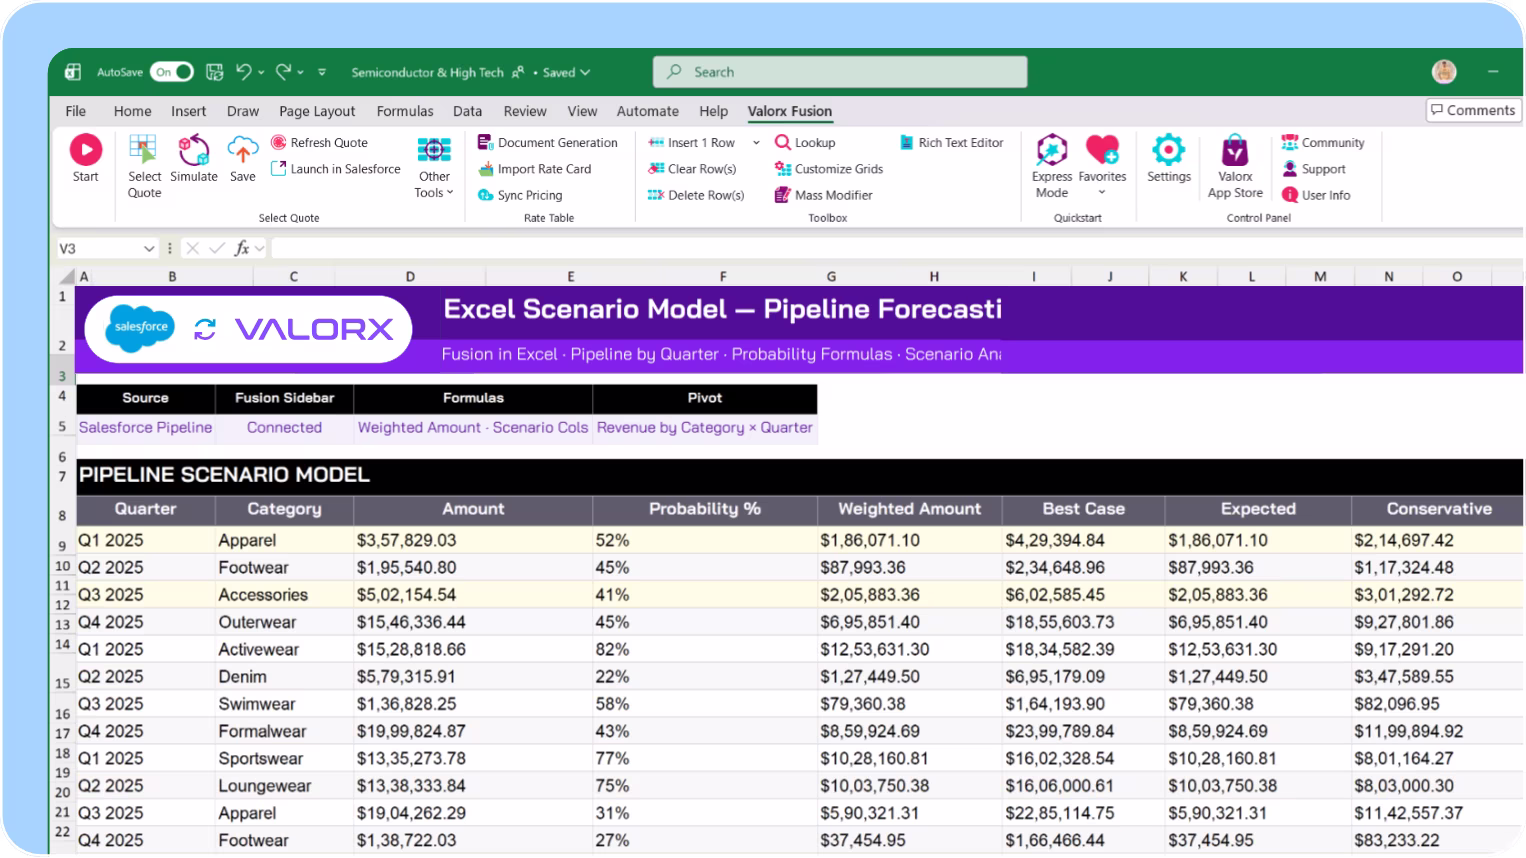
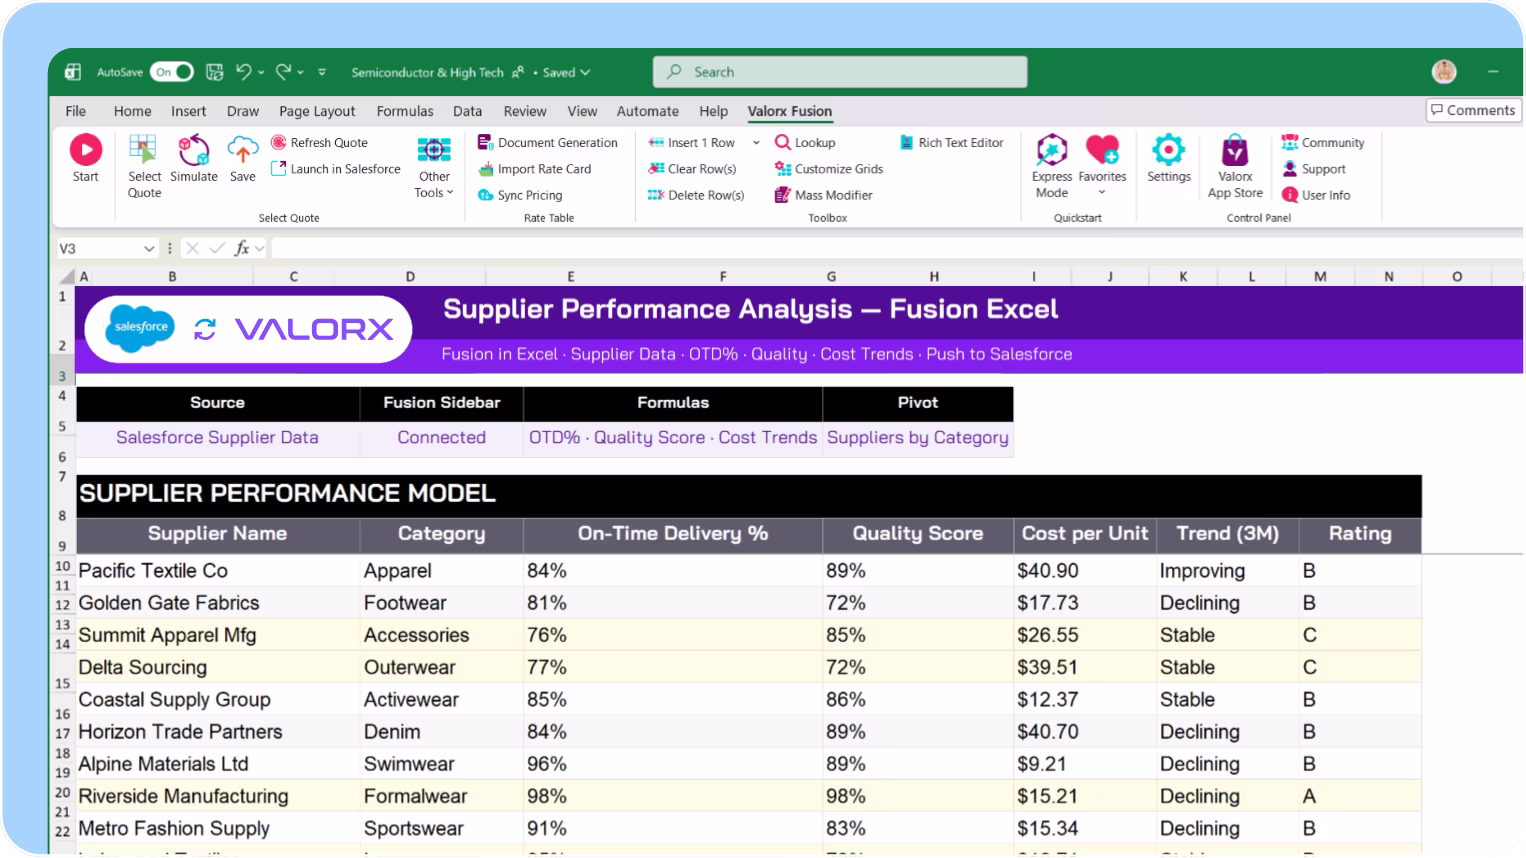
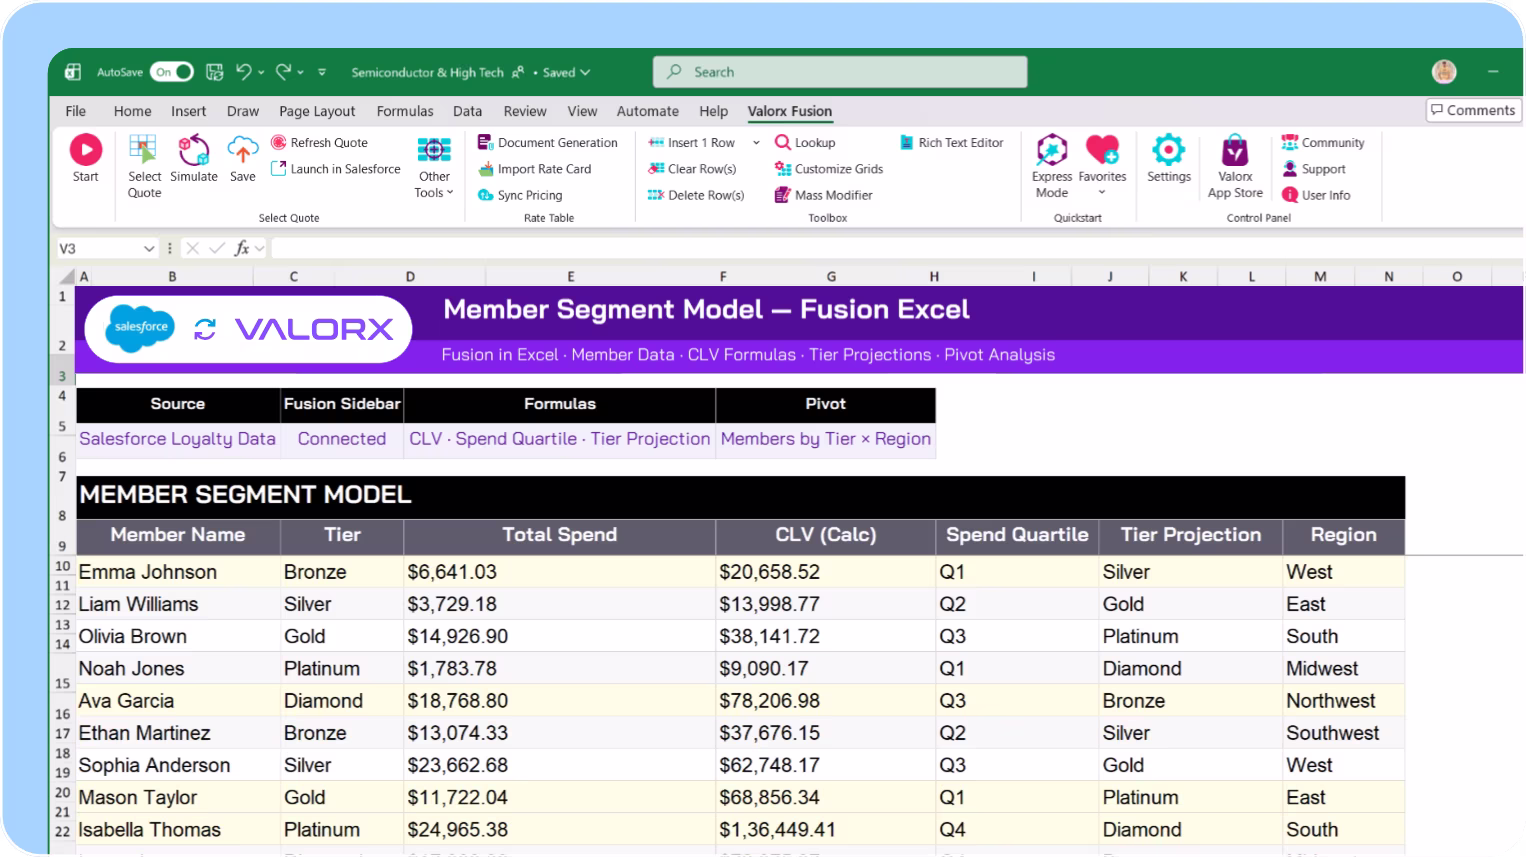
When should I use Fusion instead of Wave for forecasting?
Use Fusion when you need complex calculations, seasonal adjustments, or what-if scenarios that require Excel's formula capabilities. Fusion syncs live with Salesforce, so your models stay connected to Manufacturing Cloud data.
Does Valorx respect Salesforce security?
Yes. All permissions, sharing rules, and validation rules are enforced. Users only see and edit data they have access to.
How fast can we deploy?
Wave deploys in minutes as a managed package. Fusion requires Excel add-in installation. Most teams are live within 14 days.
Abstract purple outline of four connected circles inside a rounded square frame on a black background.
Abstract geometric logo featuring a circle above layered semicircles within a rounded square border.
Venn diagram with three overlapping purple circles on a black background.
Purple crescent shapes forming a circle on a black square background with rounded corners.
Purple outline icon of a briefcase inside a rounded square border on a black background.
Abstract black and purple geometric design with layered squares and rounded corners.
Green spreadsheet file icon representing an Excel document on a light background.
Abstract black and purple geometric design with layered squares and rounded corners.
Smiling young man with glasses and a beard wearing a black shirt on a light gray circular background with a small purple circle in the top right.
Eric Winston
Service Supervisor
Book a demo
Icon with three nested rectangles inside a rounded square outline, representing a scaling or resizing concept.
Microsoft Excel app icon with an overlapping white X on a green abstract background.
Purple geometric icon with three nested diamond shapes on a black background.
Three purple abstract human figures representing a group or team on a light background.
Icon with three stacked rounded rectangles in purple outline on a black background.
Abstract purple outline of four connected circles inside a rounded square frame on a black background.
Icon showing four interconnected circles forming a square with a horizontal line extending from the right circle.
Google Chrome web browser logo.
Salesforce logo with white text inside a blue cloud shape.
Abstract geometric design with multiple rounded squares outlined in purple on a black background.
Purple circular abstract icon with overlapping partial rings on a black square background with rounded corners.
Three overlapping purple circles forming a triangular Venn diagram on a black background.
Abstract geometric logo featuring a circle above layered semicircles within a rounded square border.