Rebalance territories inside Salesforce

See every account’s territory, move accounts in bulk, and check the pipeline that moves with them.
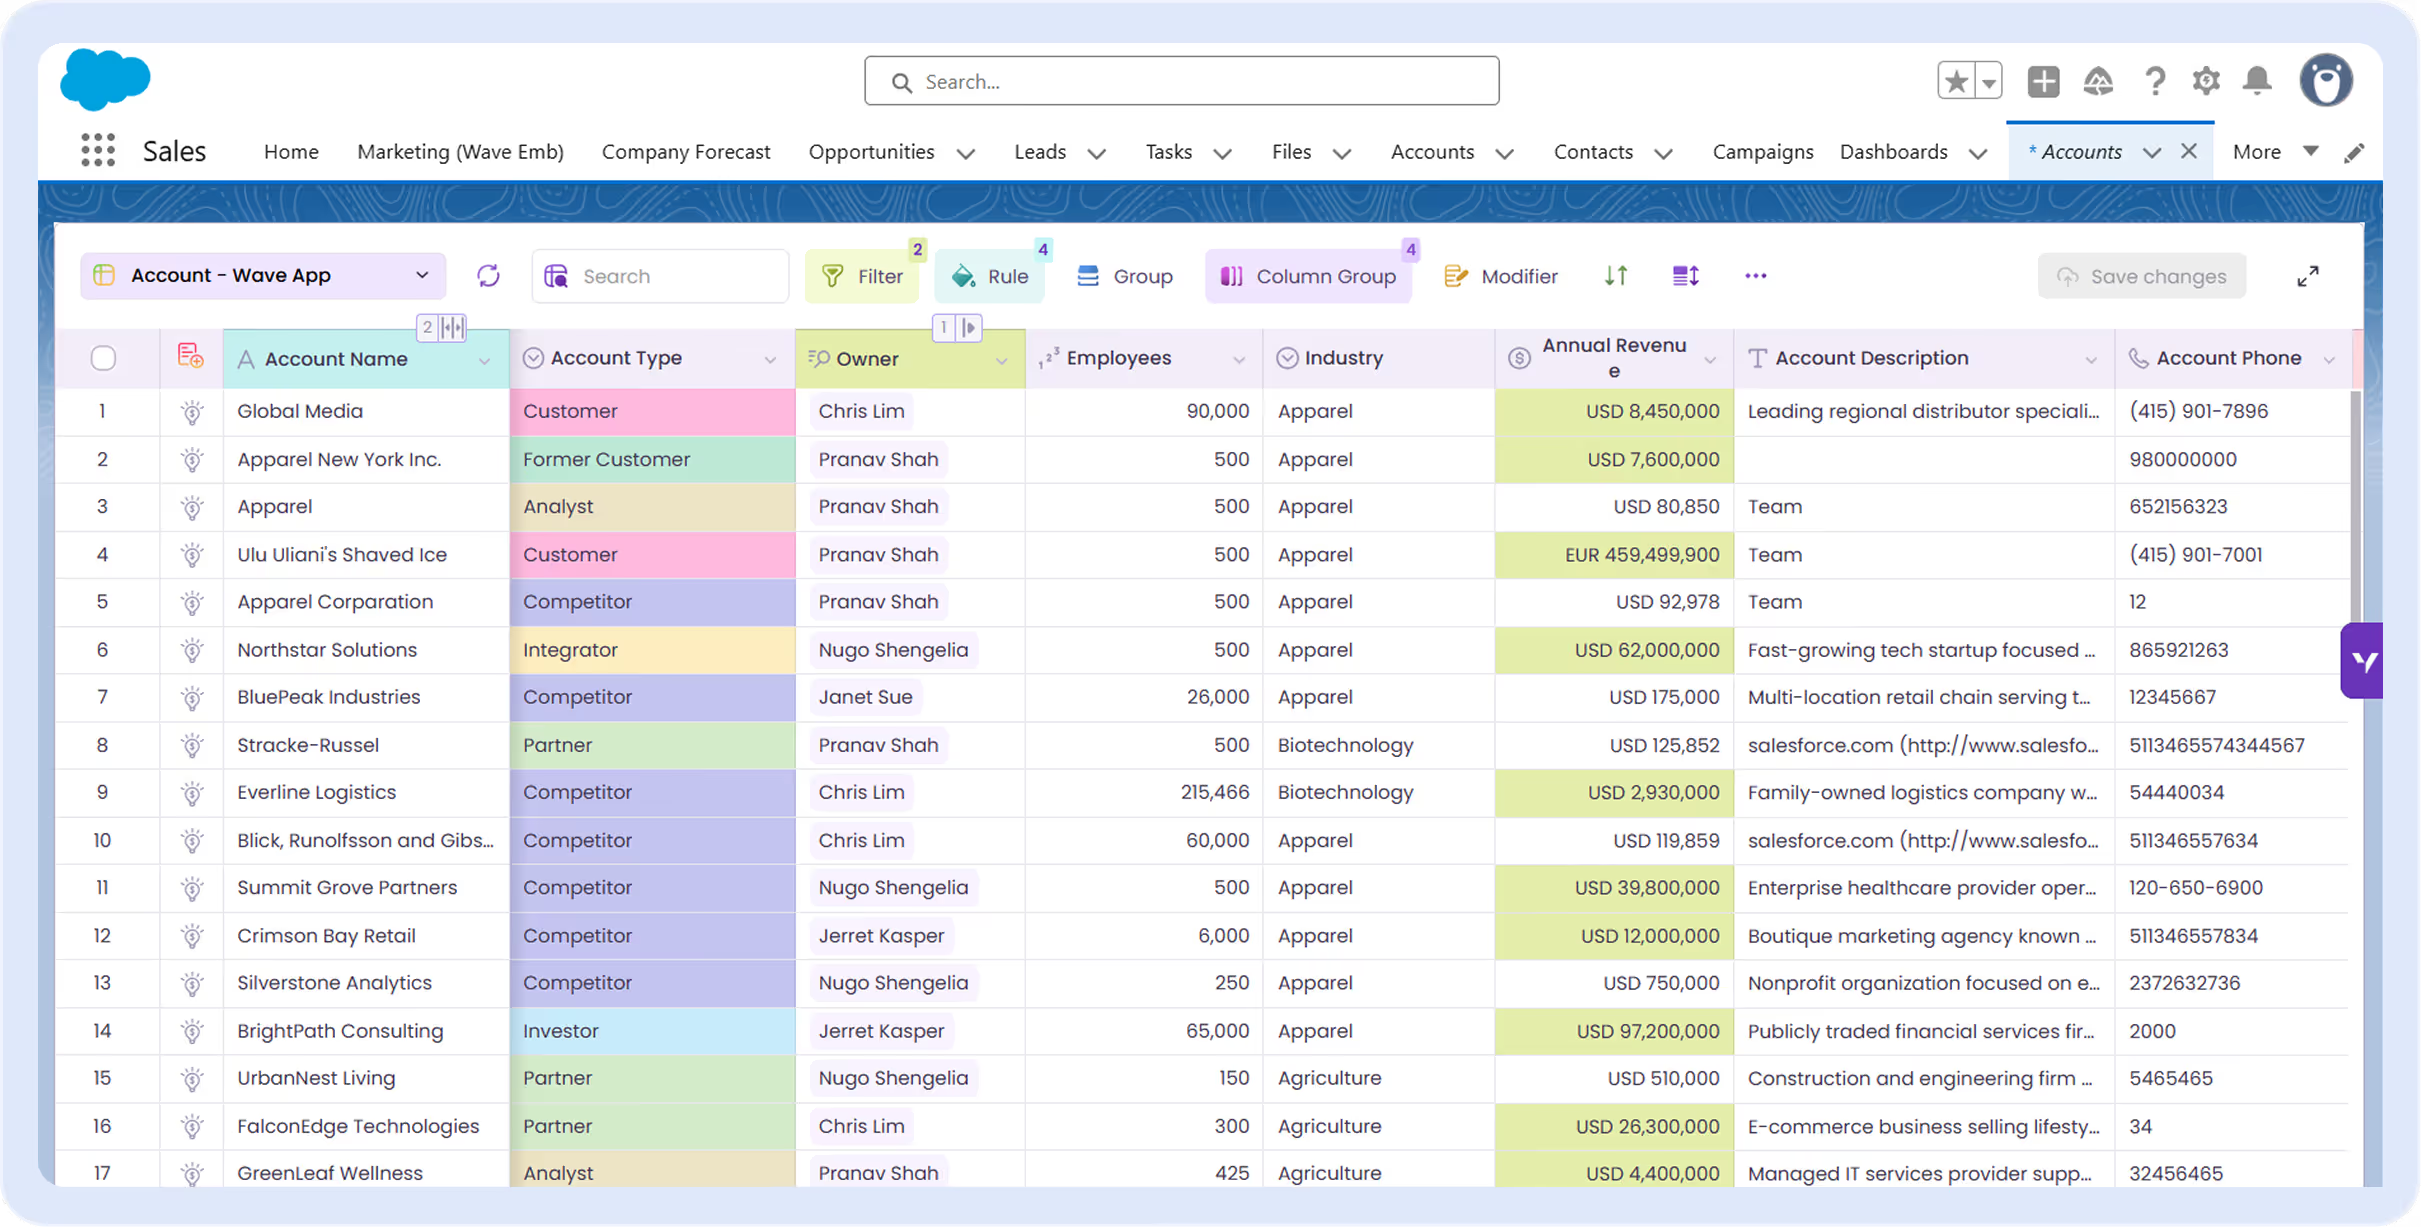
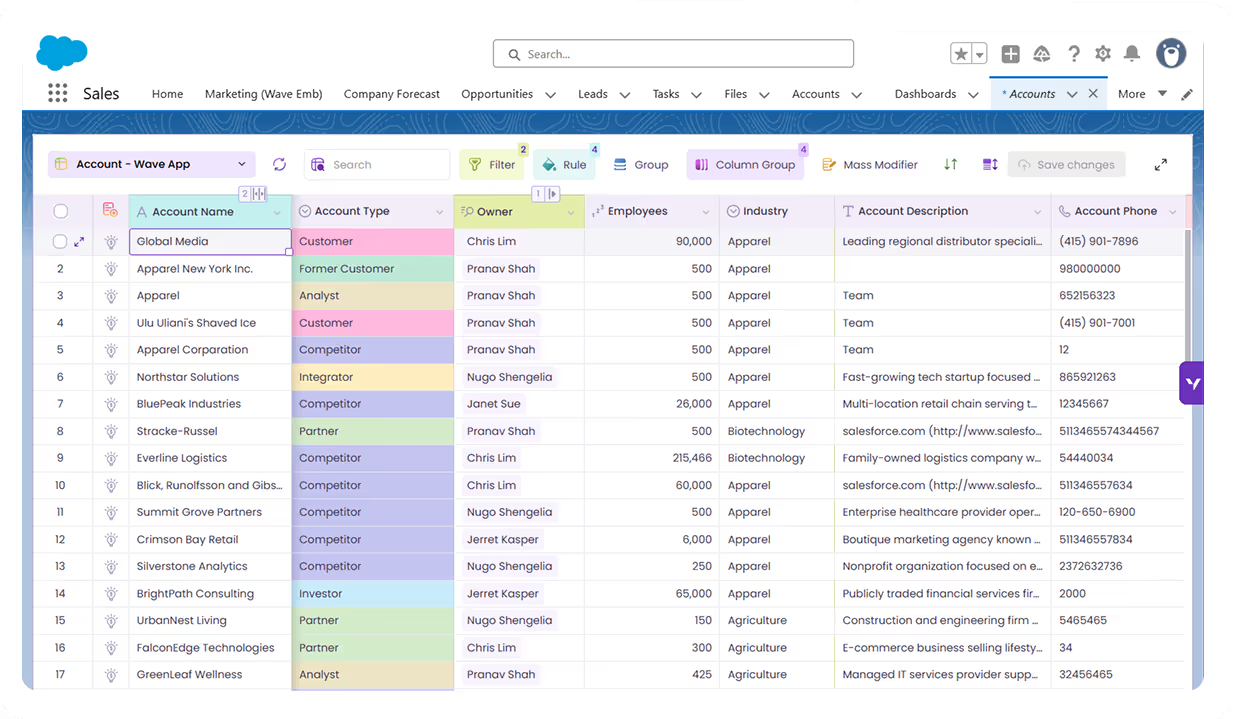
Sales dashboard showing company accounts with columns for account name, type, owner, employees, industry, revenue, and phone.
Territories
USE CASES

What your Salesforce territory management is missing

Territory changes live in Setup, one account at a time. Wave puts them in one grid.
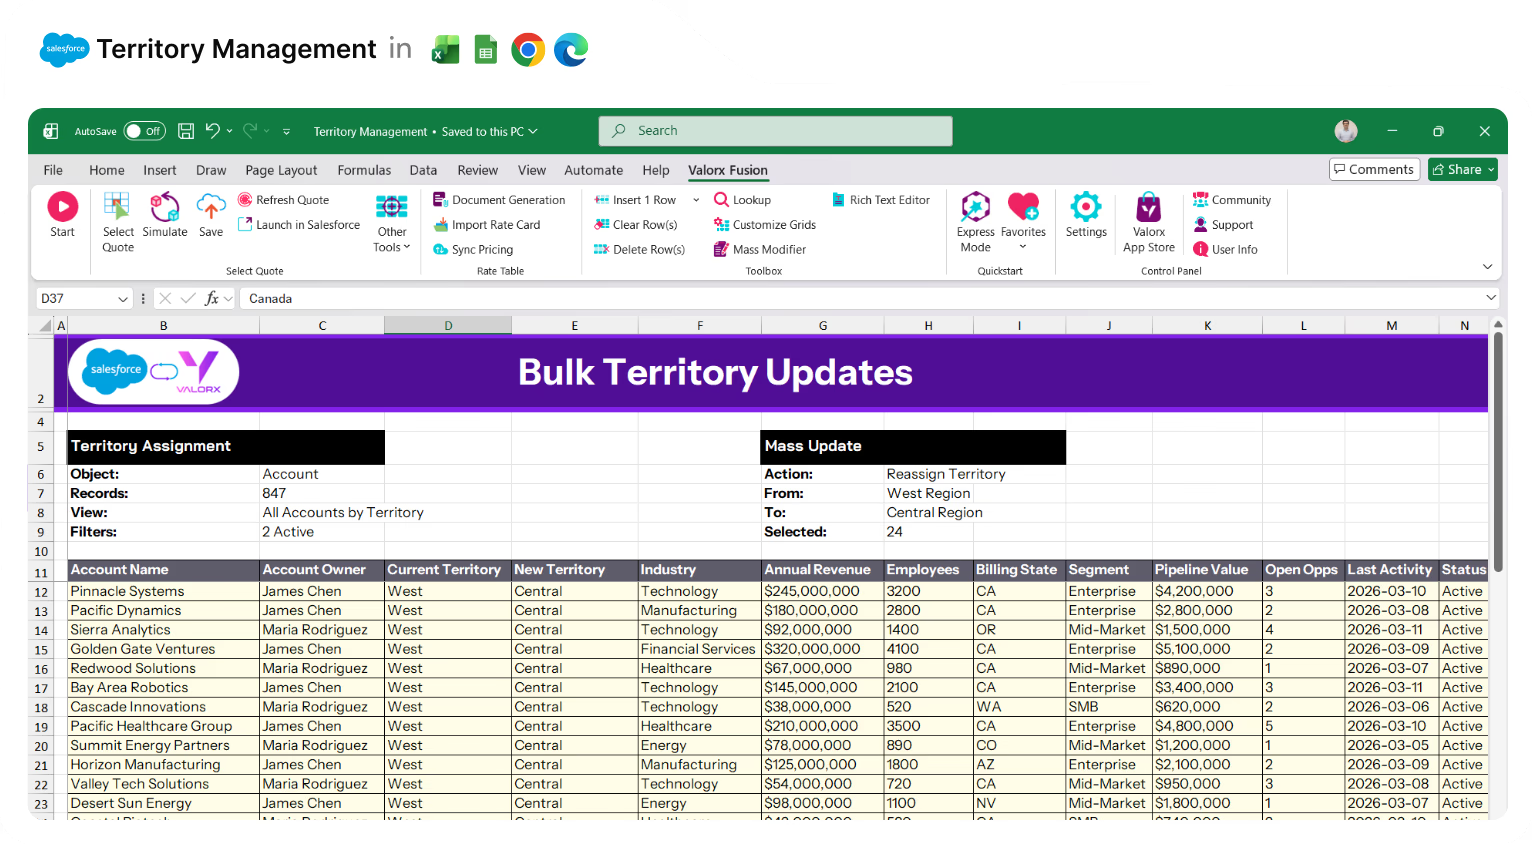
Excel spreadsheet showing bulk territory updates with columns for Account Name, Account Owner, Current Territory, New Territory, Industry, Annual Revenue, Employees, Billing State, Segment, Pipeline Value, Open Opps, Last Activity, and Status.

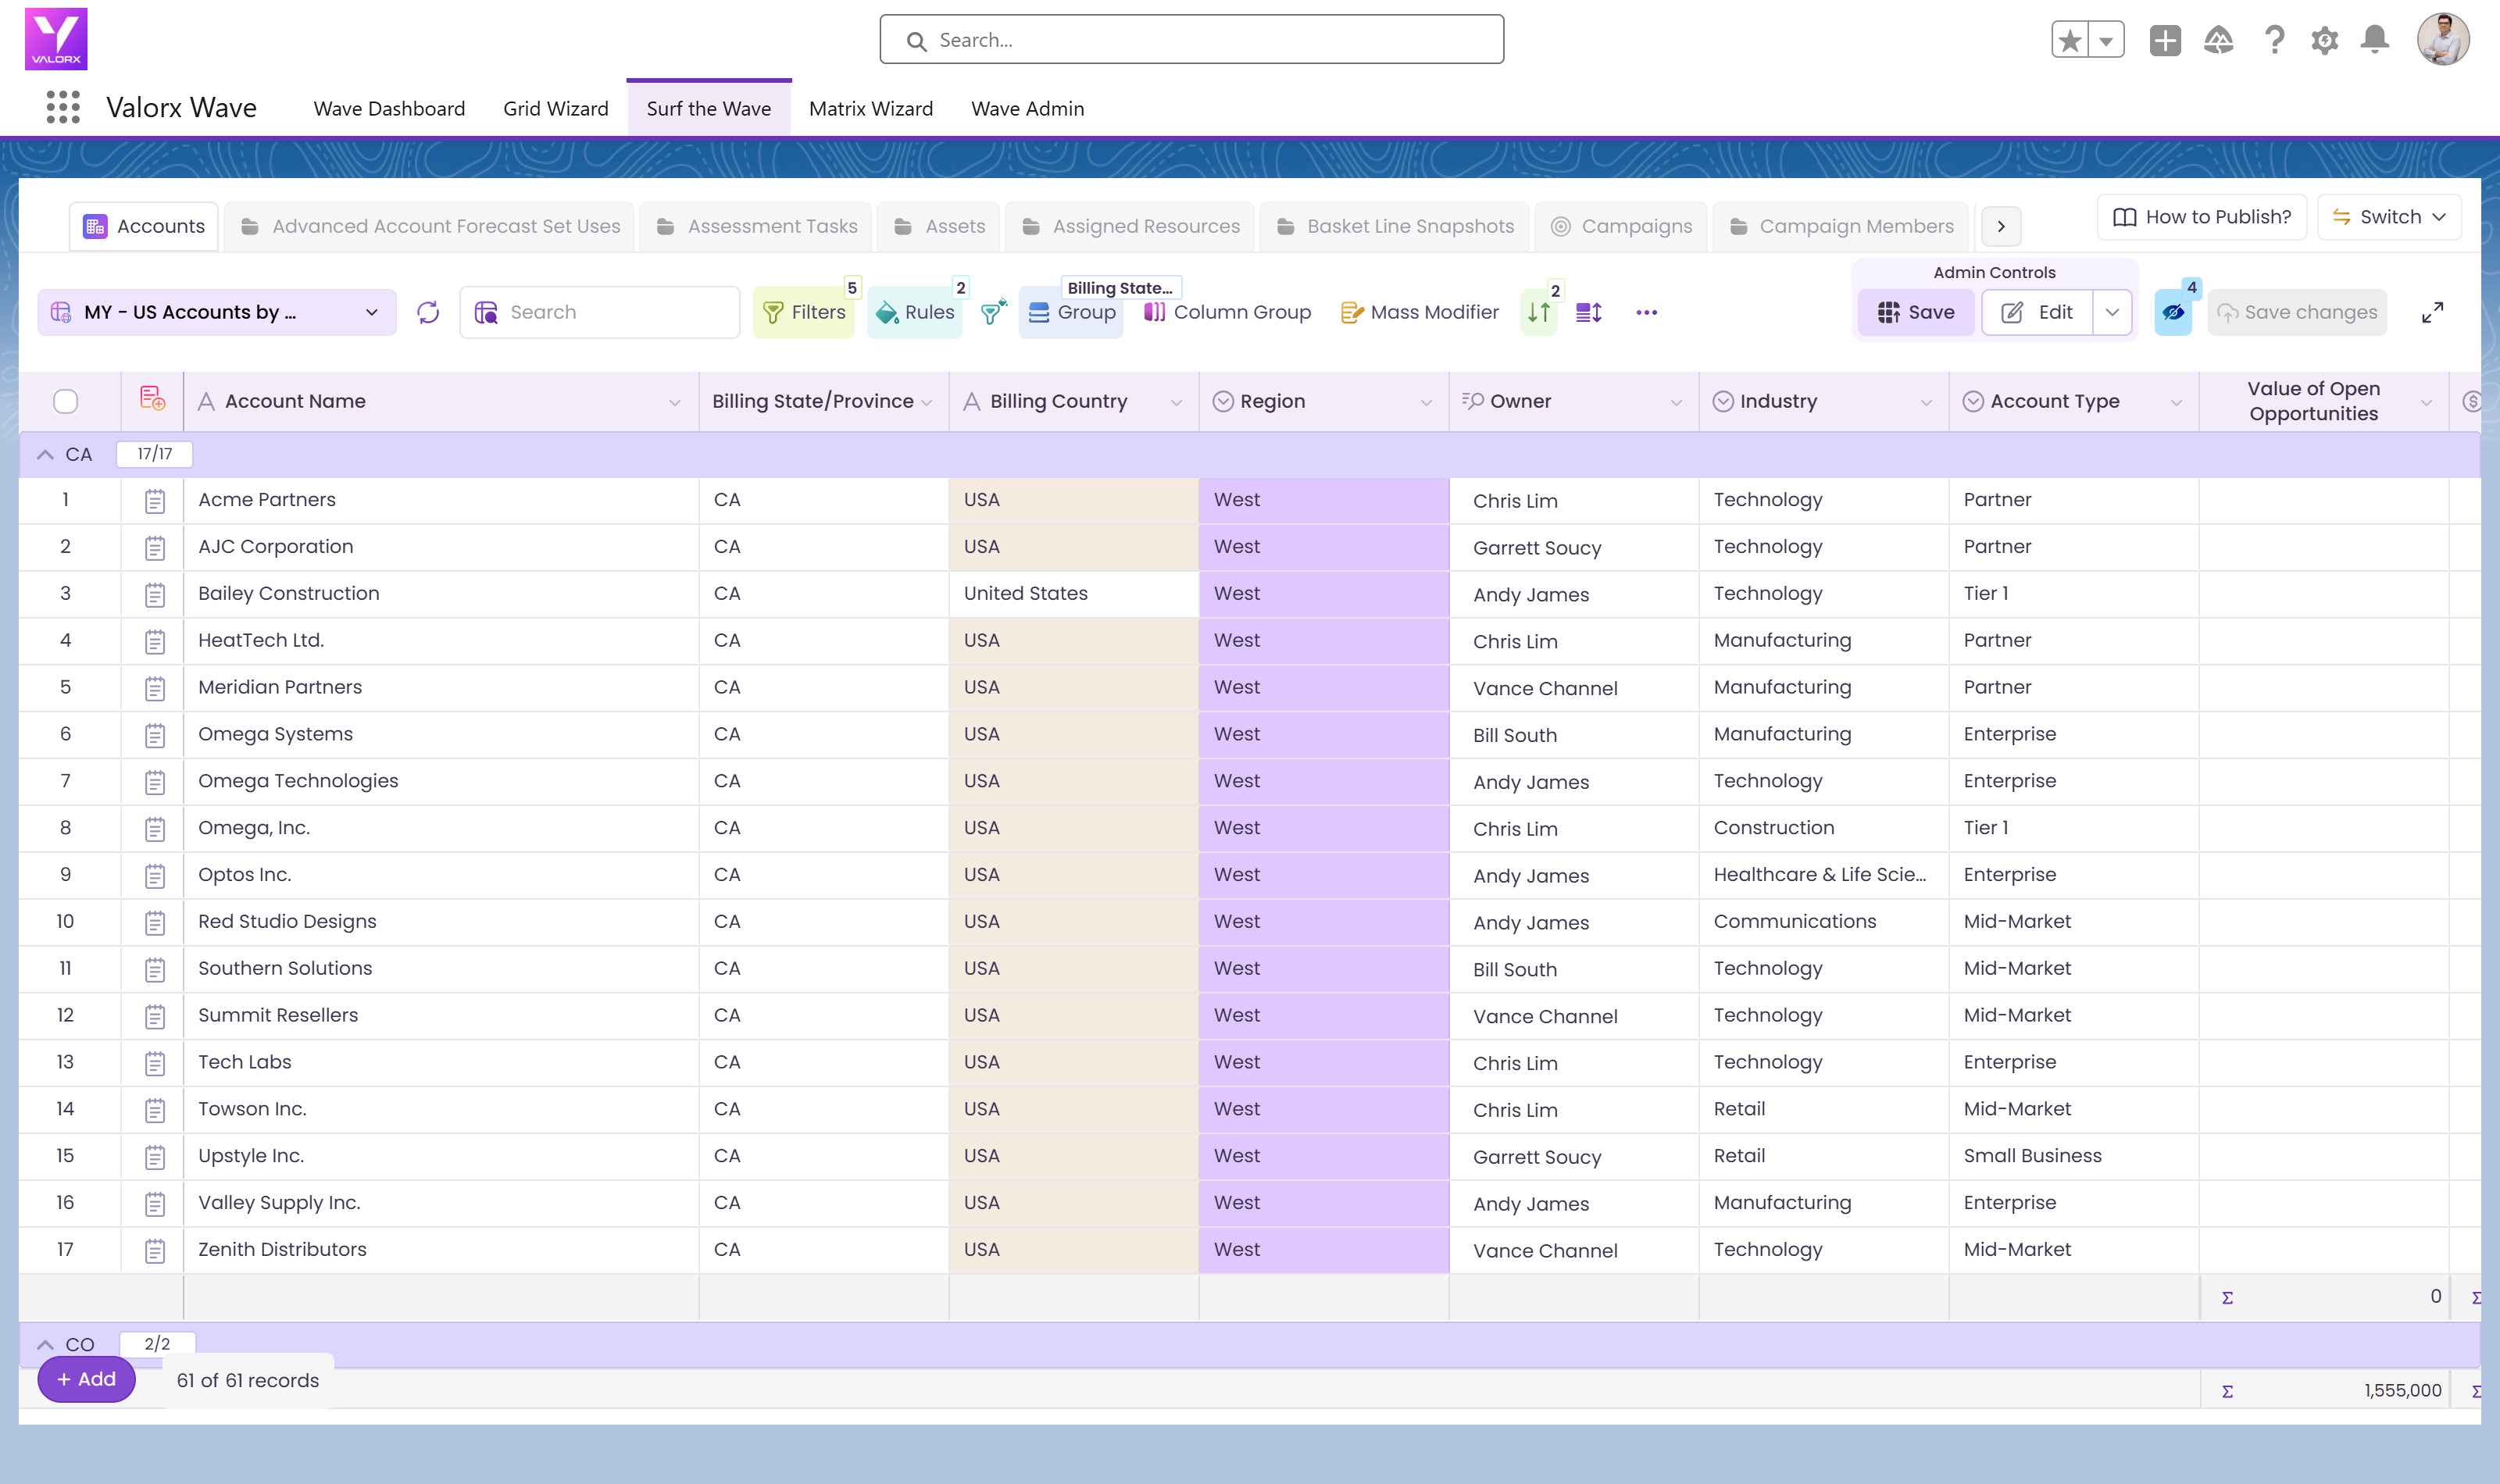
Every territory account, one grid

  • US accounts grouped by state
  • Region and owner beside every account
  • USA, US and United States flagged in amber
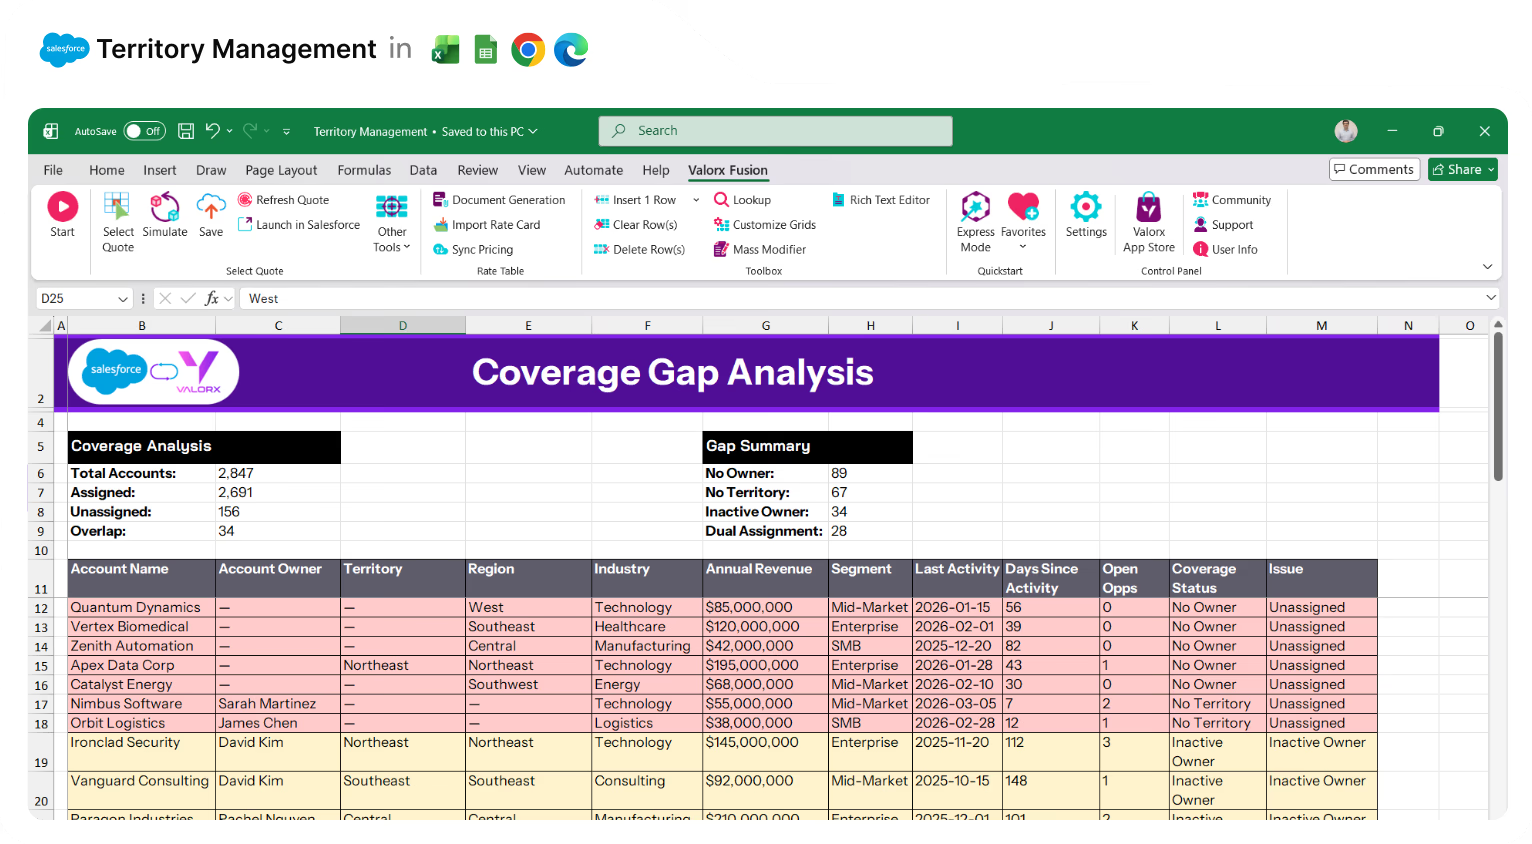
Excel spreadsheet showing a Coverage Gap Analysis for territory management with data on accounts, owners, territories, regions, industries, revenue, segment, activity, and coverage status.

See who sits outside a territory

  • Open an account to see its territory
  • Spot accounts parked at country level
  • No trip into Setup
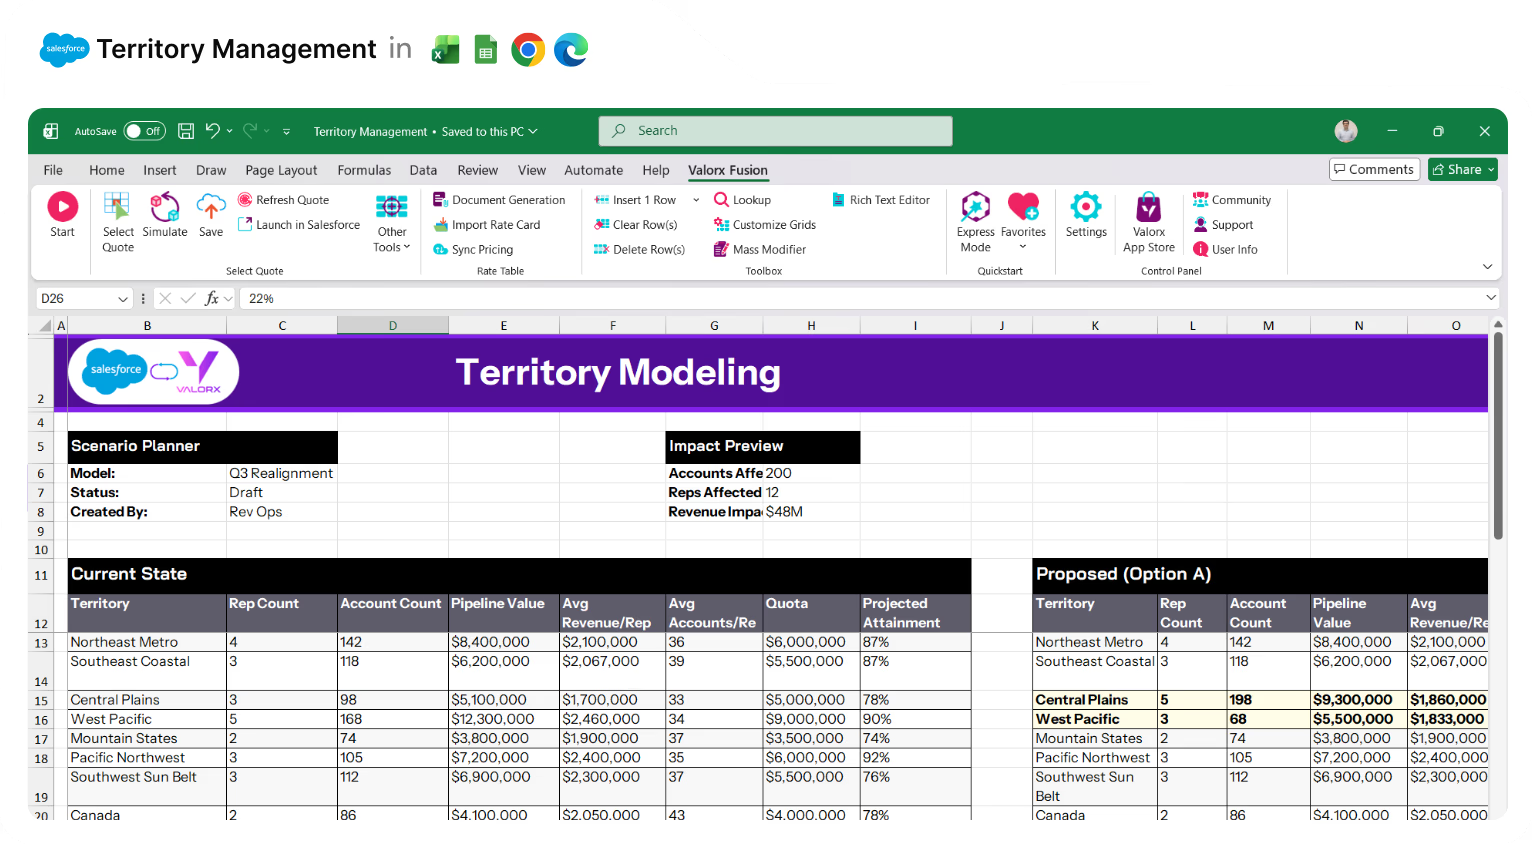
Excel worksheet titled Territory Modeling showing scenario planner details and side-by-side current state and proposed territory metrics with rep counts, account counts, pipeline values, average revenue per rep, quotas, and projected attainment percentages.

Reassign accounts in bulk

  • Select the accounts that move
  • Set the new region once
  • Save them all to Salesforce
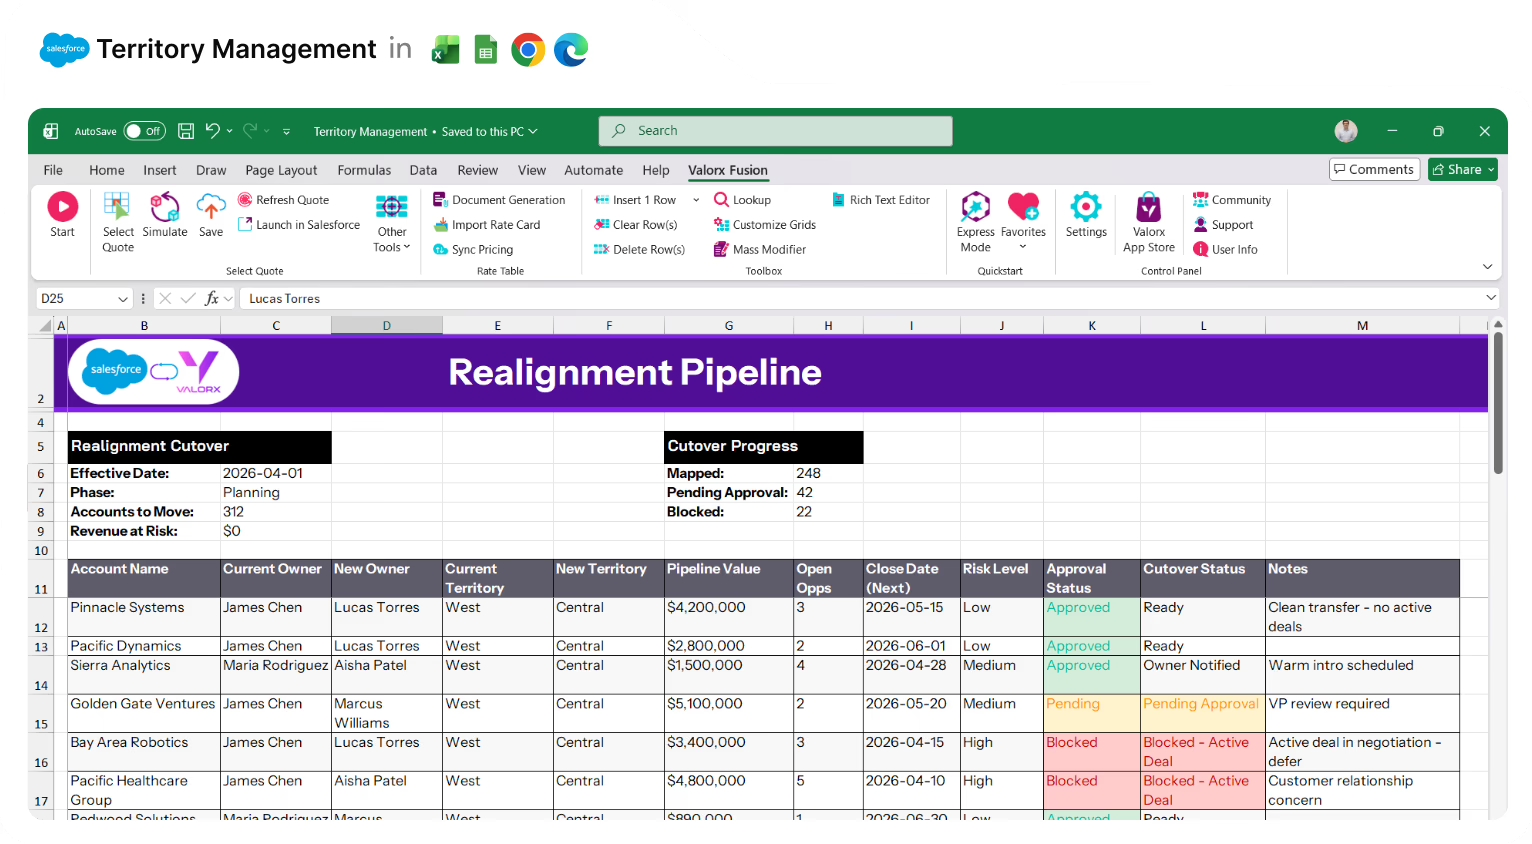
Excel spreadsheet titled 'Realignment Pipeline' showing account realignment details with columns for account name, current and new owner, territories, pipeline value, approval status, and cutover status.

See the pipeline that moves with them

  • Open deals grouped by region
  • Amount and stage beside every deal
  • Check the impact before the cut-over
Valorx Wave CRM dashboard displaying a table of opportunity records with columns for Name, Stage, Amount, Close Date, Owner, Opportunity Type, and Account.
Sales agreement table in Valorx Wave showing account details, products, planned quantities, sales prices, and discount percentages for October 25 and November 25.
Valorx Wave sales dashboard showing account details like name, phone, type, and owner, alongside a circular KPI chart with case status breakdown and 147 record count.

Real results from enterprise teams   

Book a demo

1000 s

accounts reassigned in seconds

5-10 x

faster territory updates

100%

data stays in Salesforce

Abstract soft pastel-colored gradient background with blurred lavender, blue, and pink hues.

What changes when you add Valorx to Salesforce

Turn Salesforce from a reporting system into an active pipeline workspace.
Without Valorx
With Valorx
Jumping between Salesforce screens to update records one by one
Edit hundreds of records in a single Excel-style grid
Exporting to spreadsheets, making changes offline, then reimporting
Work directly on live Salesforce data—no sync delays
Guessing whether territories overlap or accounts are uncovered
See ownership, coverage, and conflicts in real time
Holding your breath during realignments
Test changes in a staging view before committing

Soft gradient background fading from light gray to pale blue and white.

Two ways to work, one goal: better data in Salesforce

Choose the approach that fits your workflow.
Abstract purple outline of four connected circles inside a rounded square frame on a black background.
Abstract geometric logo featuring a circle above layered semicircles within a rounded square border.
Venn diagram with three overlapping purple circles on a black background.
Purple crescent shapes forming a circle on a black square background with rounded corners.
Purple outline icon of a briefcase inside a rounded square border on a black background.
Abstract black and purple geometric design with layered squares and rounded corners.
Green spreadsheet file icon representing an Excel document on a light background.
Abstract black and purple geometric design with layered squares and rounded corners.
Icon with three nested rectangles inside a rounded square outline, representing a scaling or resizing concept.
Microsoft Excel app icon with an overlapping white X on a green abstract background.
Purple geometric icon with three nested diamond shapes on a black background.
Three purple abstract human figures representing a group or team on a light background.
Icon with three stacked rounded rectangles in purple outline on a black background.
Abstract purple outline of four connected circles inside a rounded square frame on a black background.
Icon showing four interconnected circles forming a square with a horizontal line extending from the right circle.
Google Chrome web browser logo.
Salesforce logo with white text inside a blue cloud shape.
Abstract geometric design with multiple rounded squares outlined in purple on a black background.
Purple circular abstract icon with overlapping partial rings on a black square background with rounded corners.
Three overlapping purple circles forming a triangular Venn diagram on a black background.
Abstract geometric logo featuring a circle above layered semicircles within a rounded square border.