Unlock Salesforce's full forecasting potential

Create more accurate, adaptive forecasts with an interface as familiar as Excel.
Screenshot of Valorx Wave sales dashboard showing account sales agreements with columns for product, planned quantity, sales price, and discount percentage for October 25 and November 25.
Excel spreadsheet titled Forecast 360 showing sales forecast data with account names, product names, metrics, and monthly planned quantities and sales prices from Jan 2021 to Oct 2024.
USE CASES

What your forecasting has been missing

Turn Salesforce data into actionable forecasts.
Sales forecasting dashboard showing account sales agreements with product names, planned quantities, sales prices, and discount percentages for November 25 and December 25.

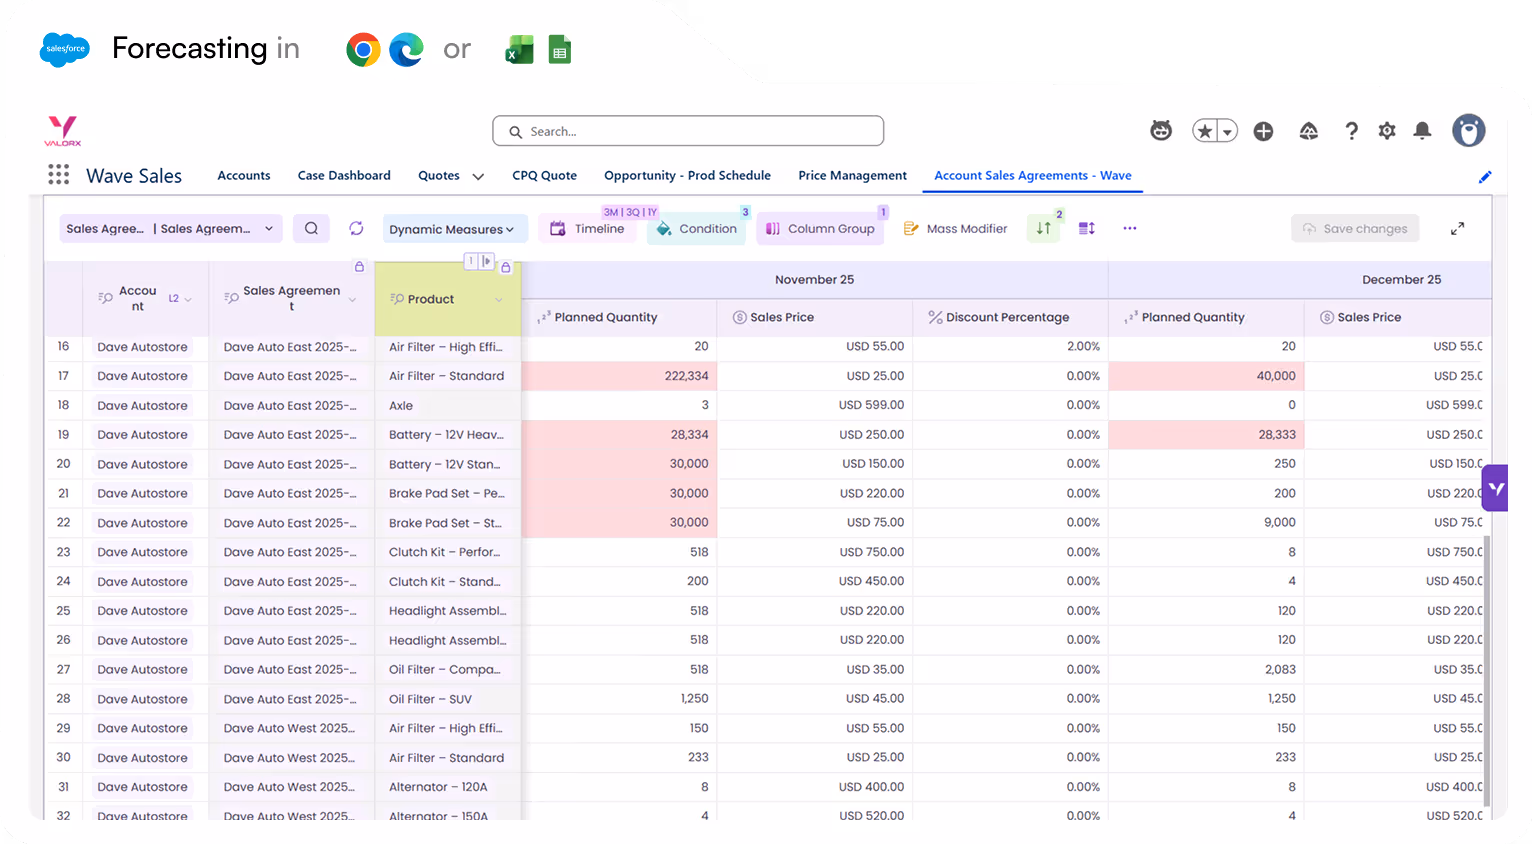
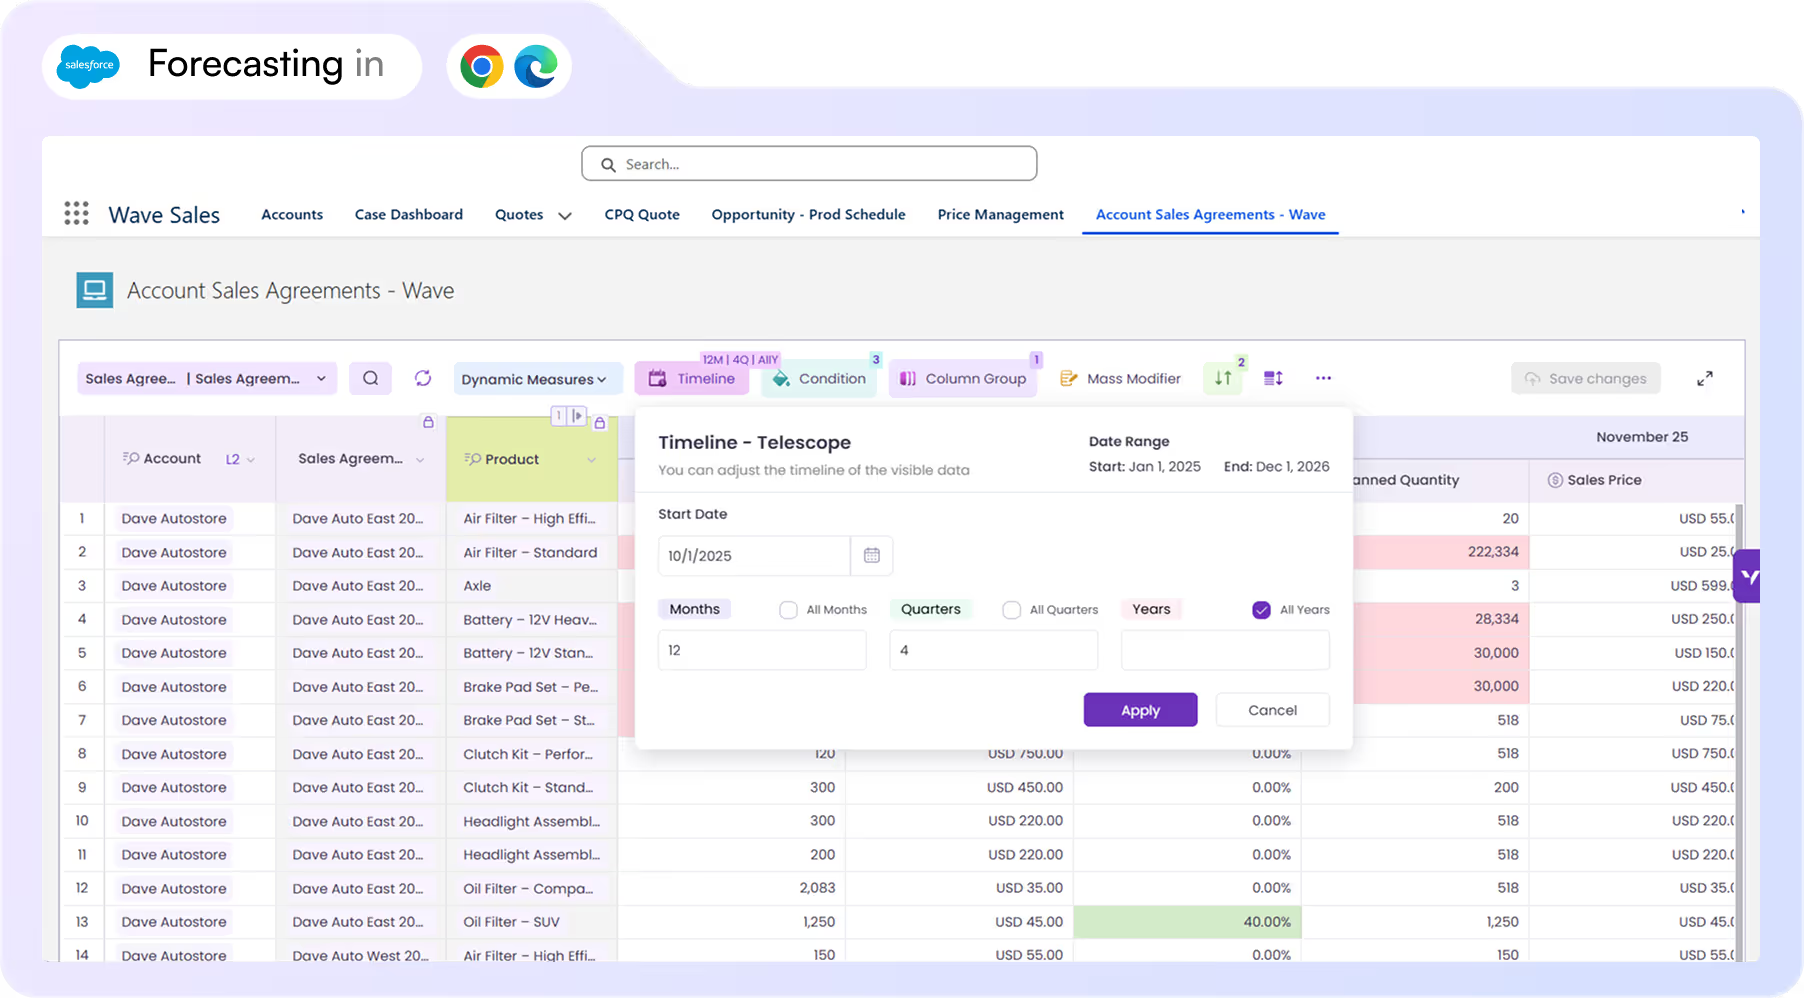
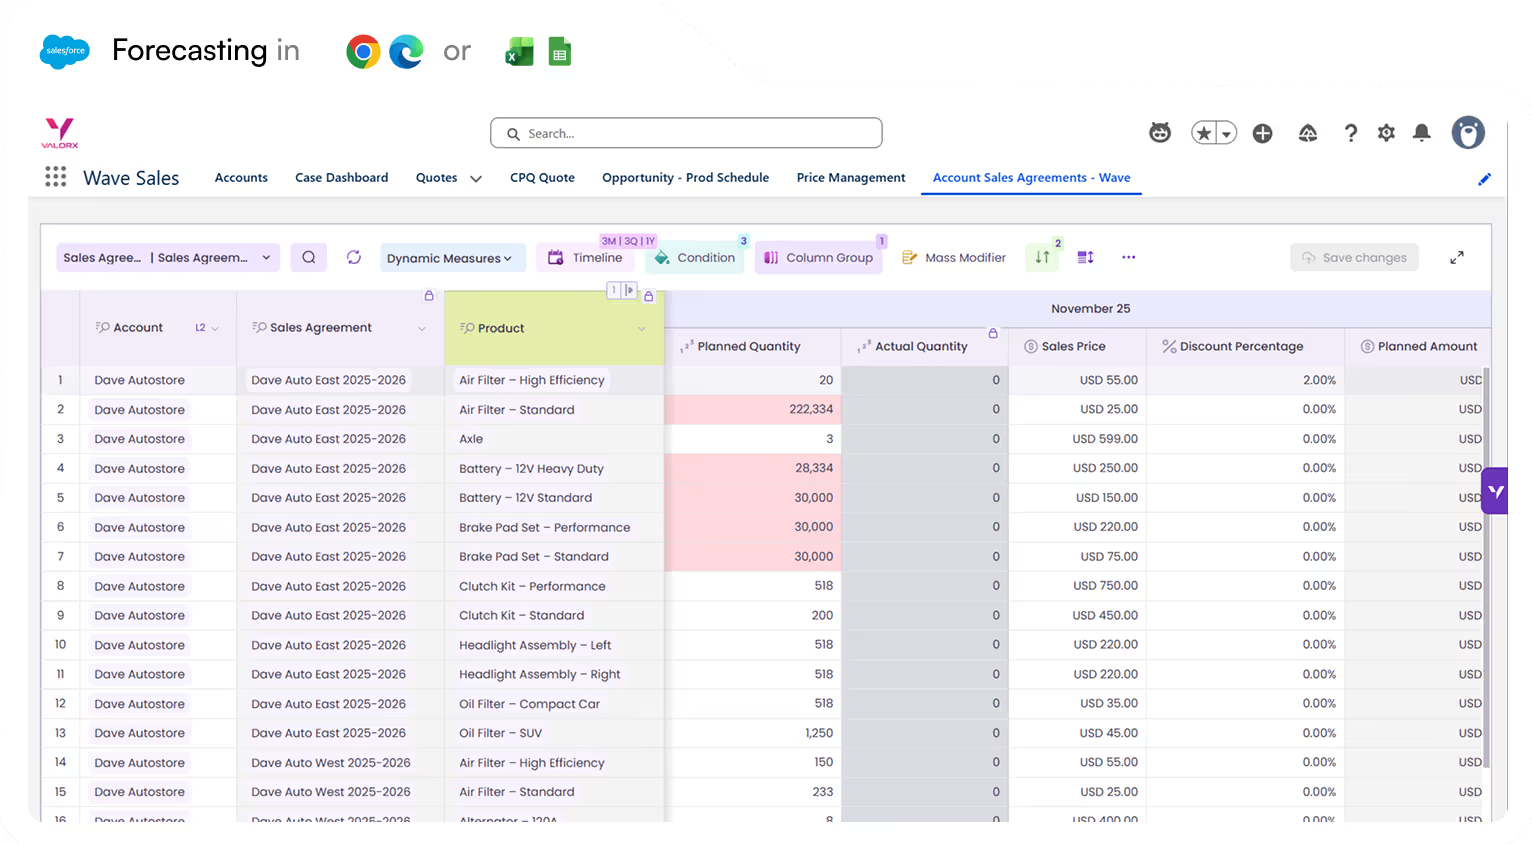
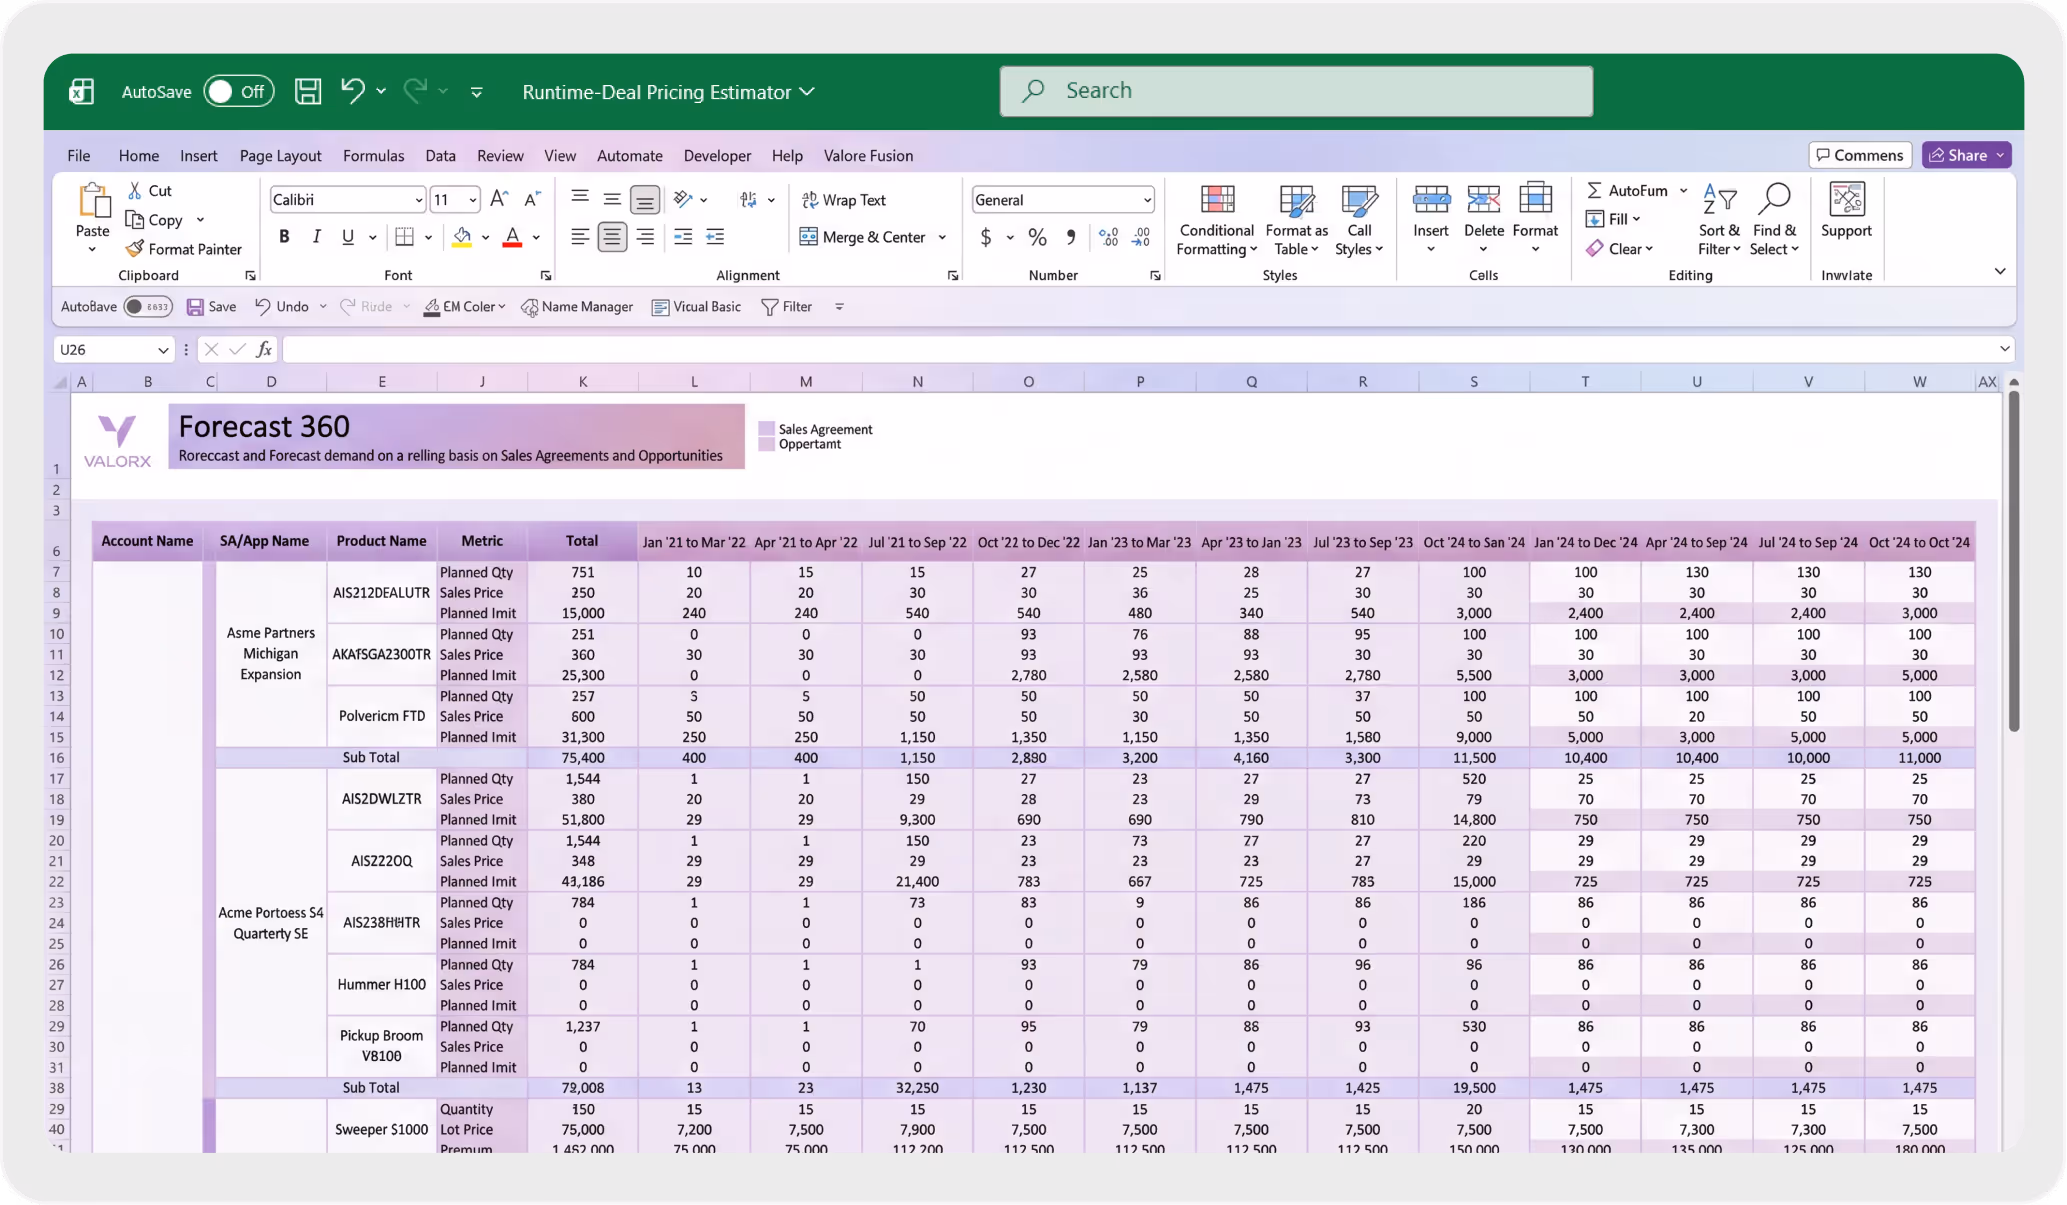
Account-based sales forecasting

Combine long-term agreements and new opportunities into unified account forecasts.
Screenshot of a Wave Sales forecasting dashboard showing accounts, sales agreements, products, planned quantities, sales prices, discount percentages, and planned amounts for various products like air filters and spark plugs.

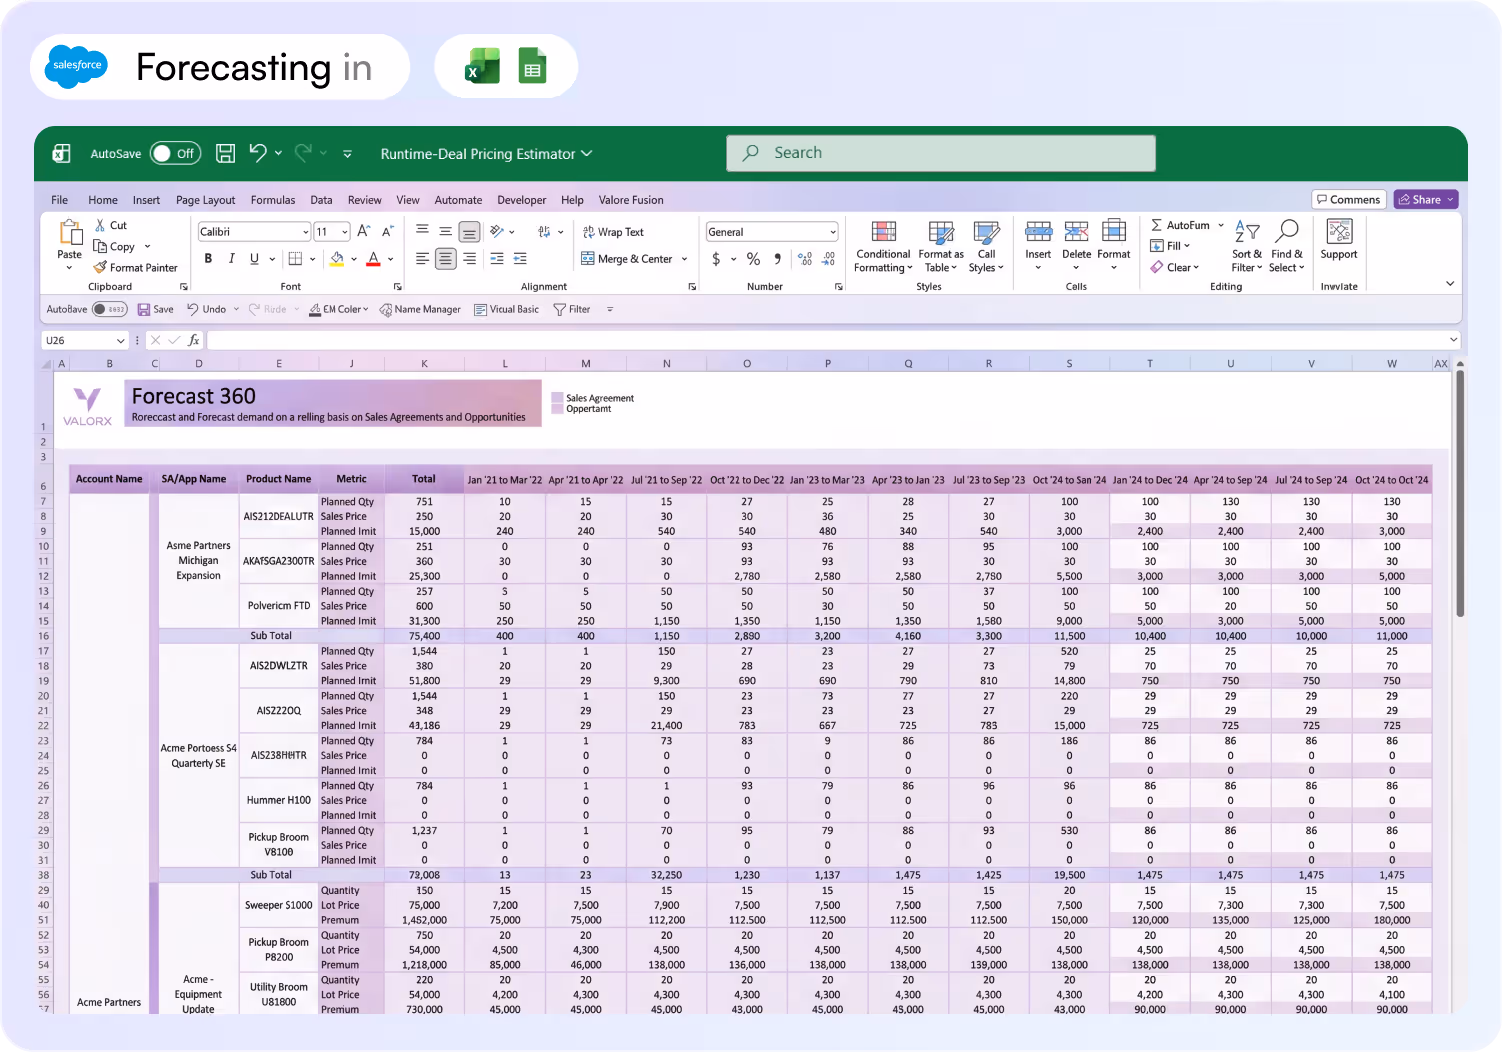
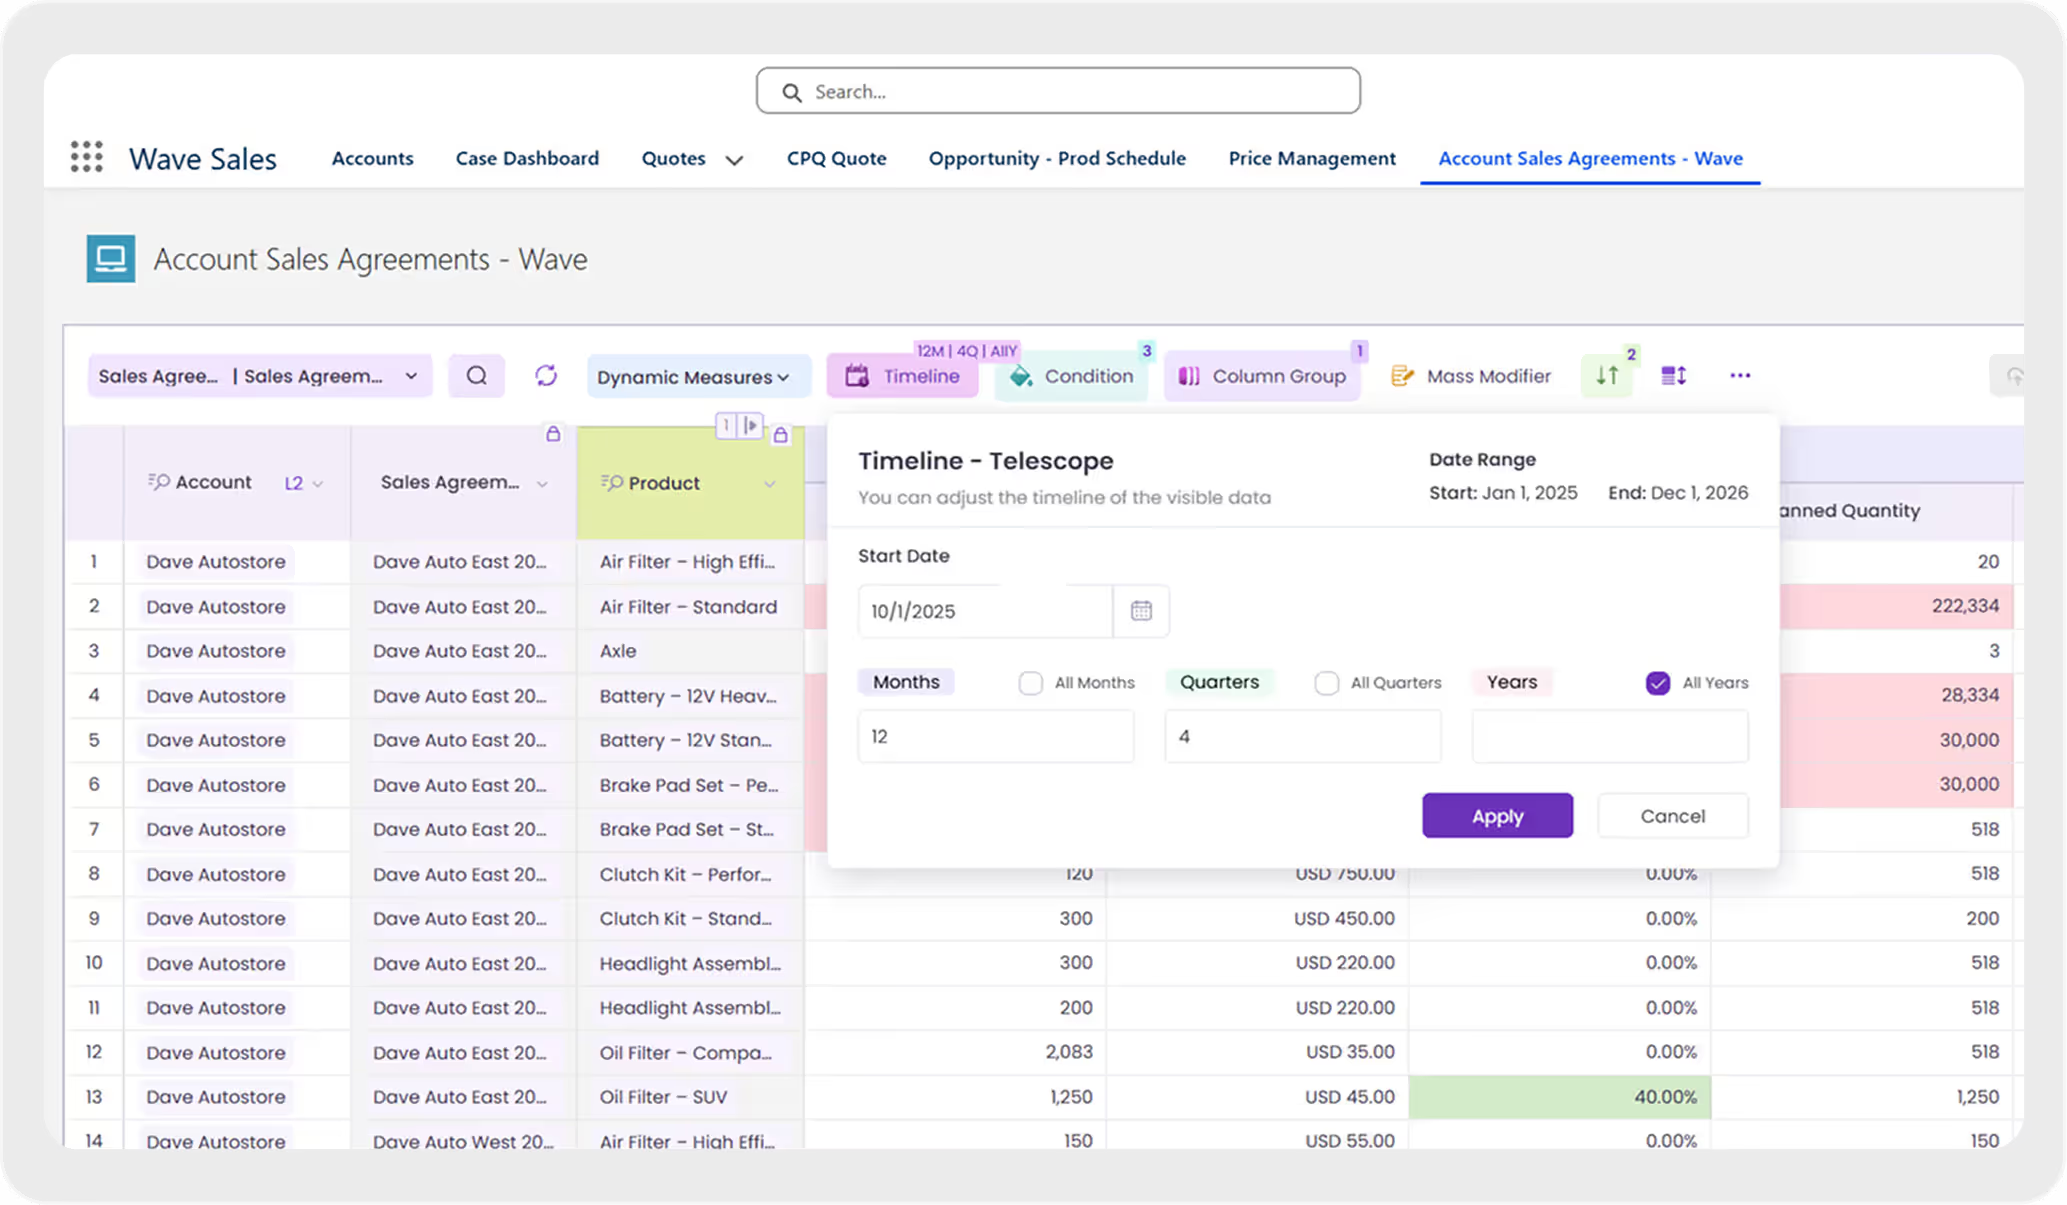
Demand planning and production alignment

Connect sales forecasts directly to production planning with flexible time views.
Salesforce Wave Sales dashboard showing a table with columns for Account, Sales Agreement, Product, Planned Quantity, Actual Quantity, Sales Price, Discount Percentage, and Planned Amount.

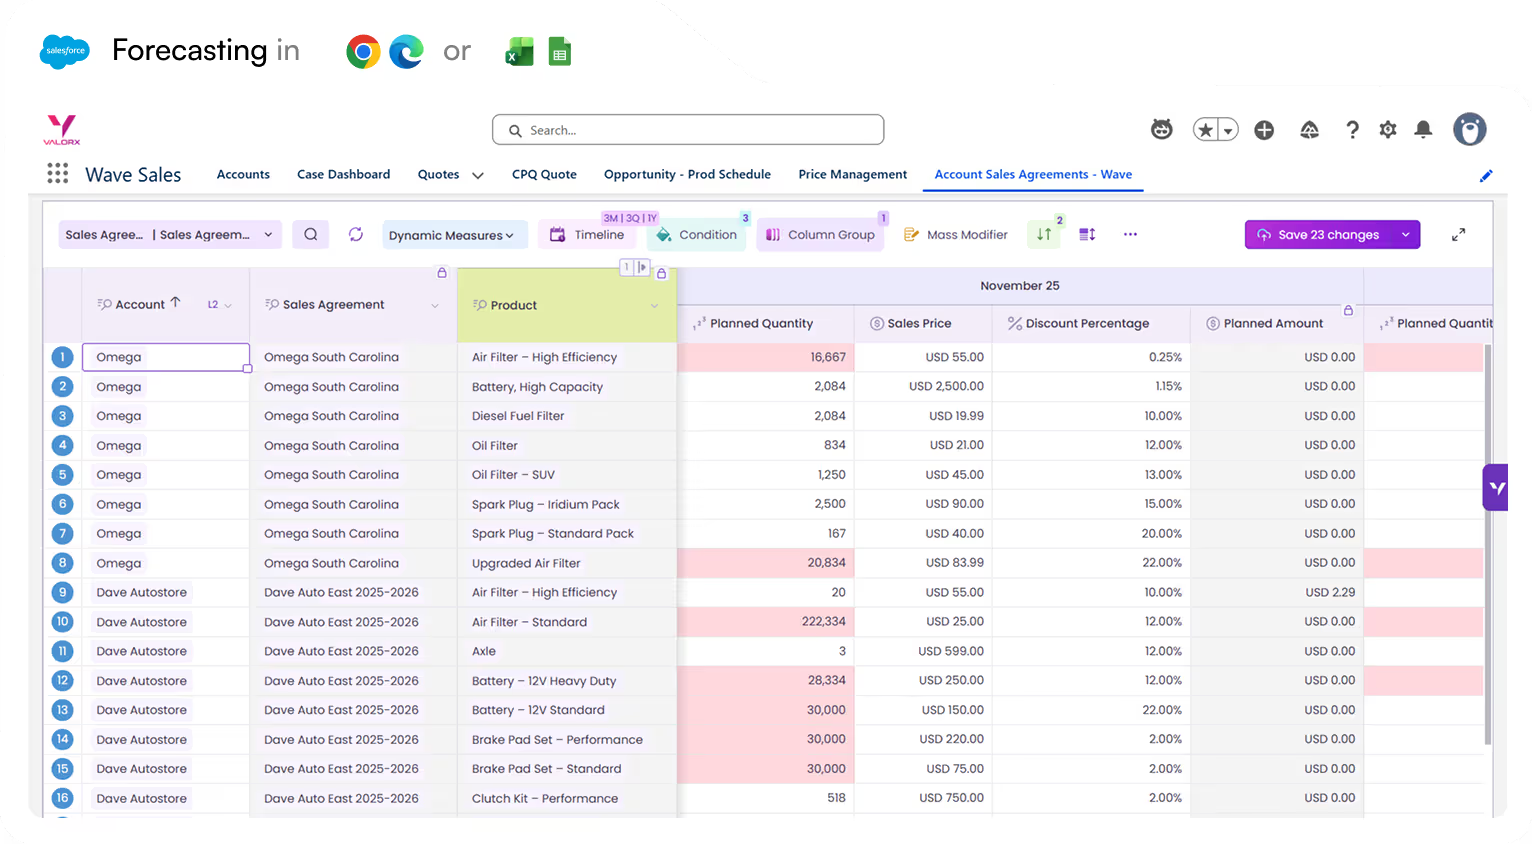
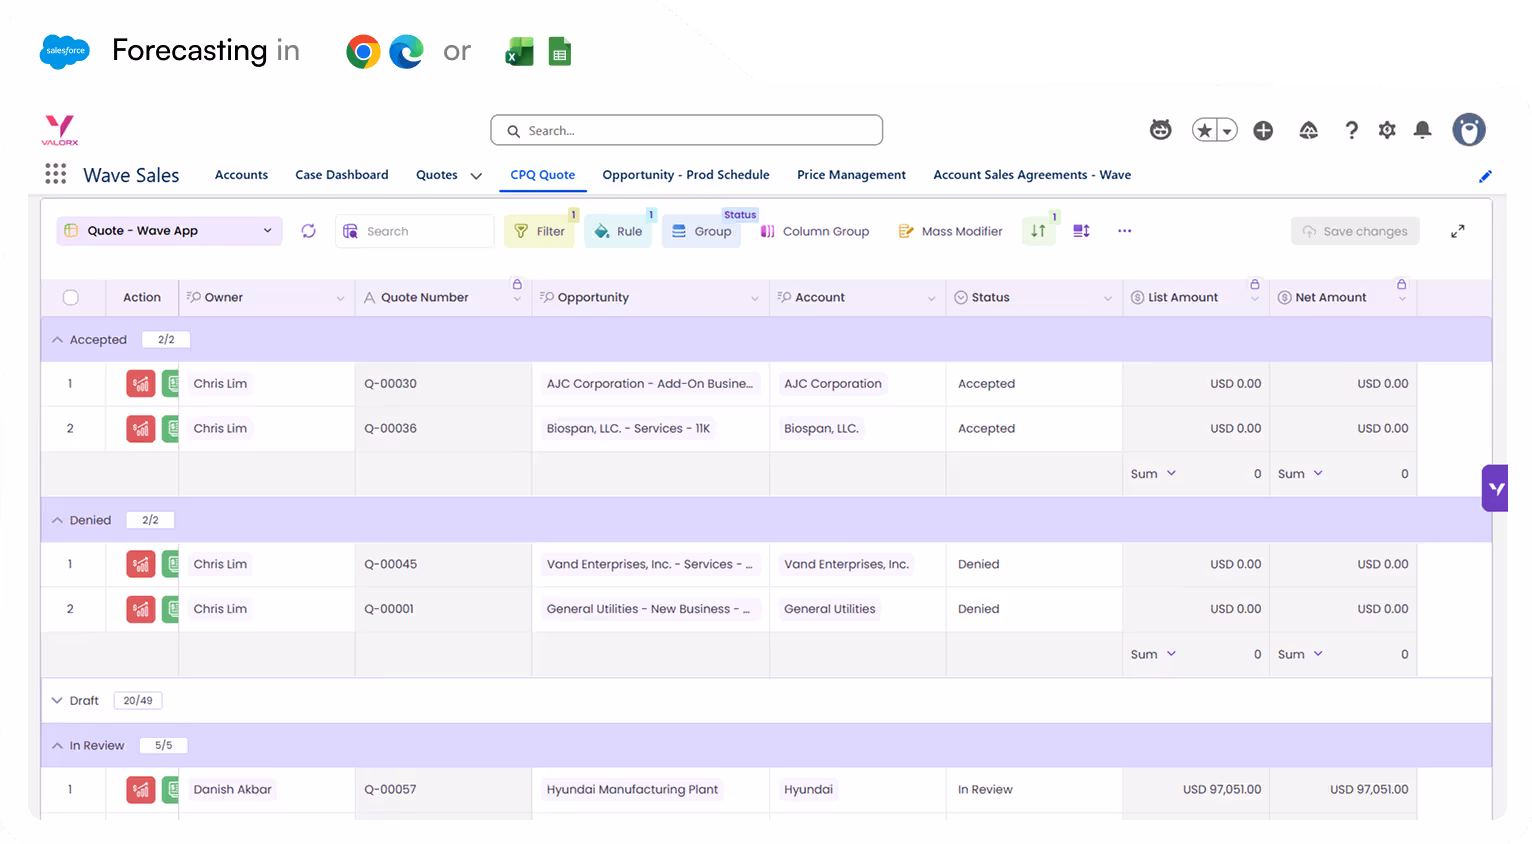
Unified performance tracking

Track forecast performance against actuals inreal time with spreadsheet-like simplicity.
Salesforce Wave Sales CPQ Quote dashboard showing accepted, denied, draft, and in review quotes with details like owner, quote number, opportunity, account, status, and amounts in USD.

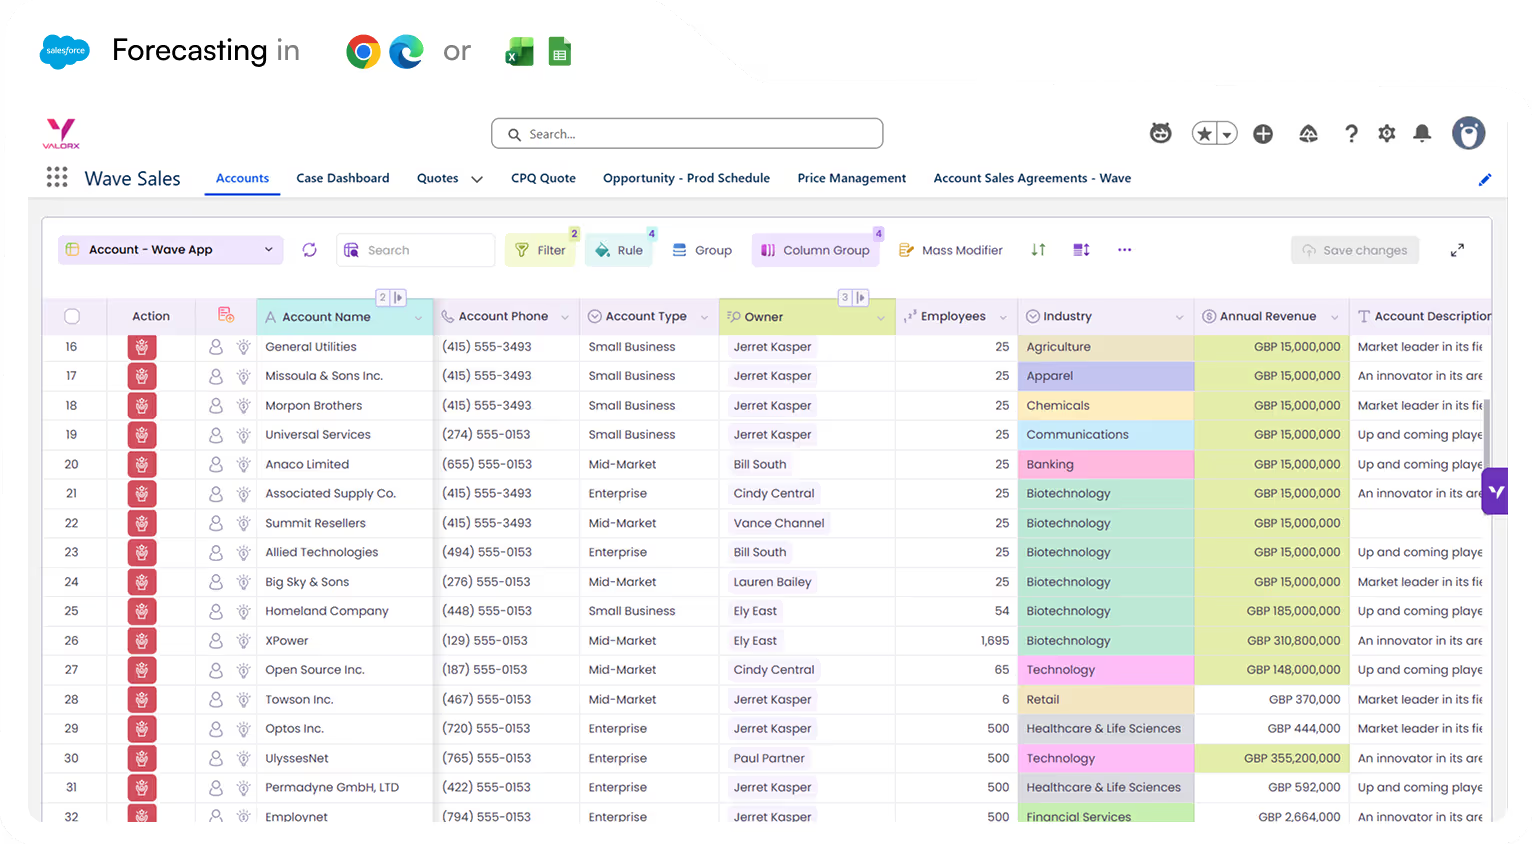
Cross-functional collaboration

Enable all teams to work from the same data with custom views tailored to their needs.
Salesforce Wave Sales dashboard showing account names, phone numbers, account types, owners, employees, industries, annual revenues, and account descriptions in a color-coded table.

Easy adoption

Use familiar Excel tools while keeping data secure in Salesforce — without complex training.
Valorx Wave CRM dashboard displaying a table of opportunity records with columns for Name, Stage, Amount, Close Date, Owner, Opportunity Type, and Account.
Sales agreement table in Valorx Wave showing account details, products, planned quantities, sales prices, and discount percentages for October 25 and November 25.
Valorx Wave sales dashboard showing account details like name, phone, type, and owner, alongside a circular KPI chart with case status breakdown and 147 record count.

Choose your interface for forecasting

See what Valorx adds to Salesforce

Get more from your Salesforce investment with solutions built specifically to fix forecasting limitations. 
Without Valorx
Slow user adoption due to complexity
Fragmented data across multiple systems
Limited, rigid customization options
Revenue loss from inaccurate forecasting
With Valorx
Familiar interface for easy adoption
Centralized, real-time forecasting
Customizable forecasting capabilities
Higher accuracy, lower costs
Smiling young man with glasses and a beard wearing a black shirt on a light gray circular background with a small purple circle in the top right.
Eric Winston
Service Supervisor
Book a demo
Soft gradient background fading from light gray to pale blue and white.
Abstract purple outline of four connected circles inside a rounded square frame on a black background.
Abstract geometric logo featuring a circle above layered semicircles within a rounded square border.
Venn diagram with three overlapping purple circles on a black background.
Purple crescent shapes forming a circle on a black square background with rounded corners.
Purple outline icon of a briefcase inside a rounded square border on a black background.
Abstract black and purple geometric design with layered squares and rounded corners.
Green spreadsheet file icon representing an Excel document on a light background.
Abstract black and purple geometric design with layered squares and rounded corners.
Smiling young man with glasses and a beard wearing a black shirt on a light gray circular background with a small purple circle in the top right.
Eric Winston
Service Supervisor
Book a demo
Icon with three nested rectangles inside a rounded square outline, representing a scaling or resizing concept.
Microsoft Excel app icon with an overlapping white X on a green abstract background.
Purple geometric icon with three nested diamond shapes on a black background.
Three purple abstract human figures representing a group or team on a light background.
Icon with three stacked rounded rectangles in purple outline on a black background.
Abstract purple outline of four connected circles inside a rounded square frame on a black background.
Icon showing four interconnected circles forming a square with a horizontal line extending from the right circle.
Google Chrome web browser logo.
Salesforce logo with white text inside a blue cloud shape.
Abstract geometric design with multiple rounded squares outlined in purple on a black background.
Purple circular abstract icon with overlapping partial rings on a black square background with rounded corners.
Three overlapping purple circles forming a triangular Venn diagram on a black background.
Abstract geometric logo featuring a circle above layered semicircles within a rounded square border.