Past the Refresh: Fix the Cases Your Power BI Dashboard Flags
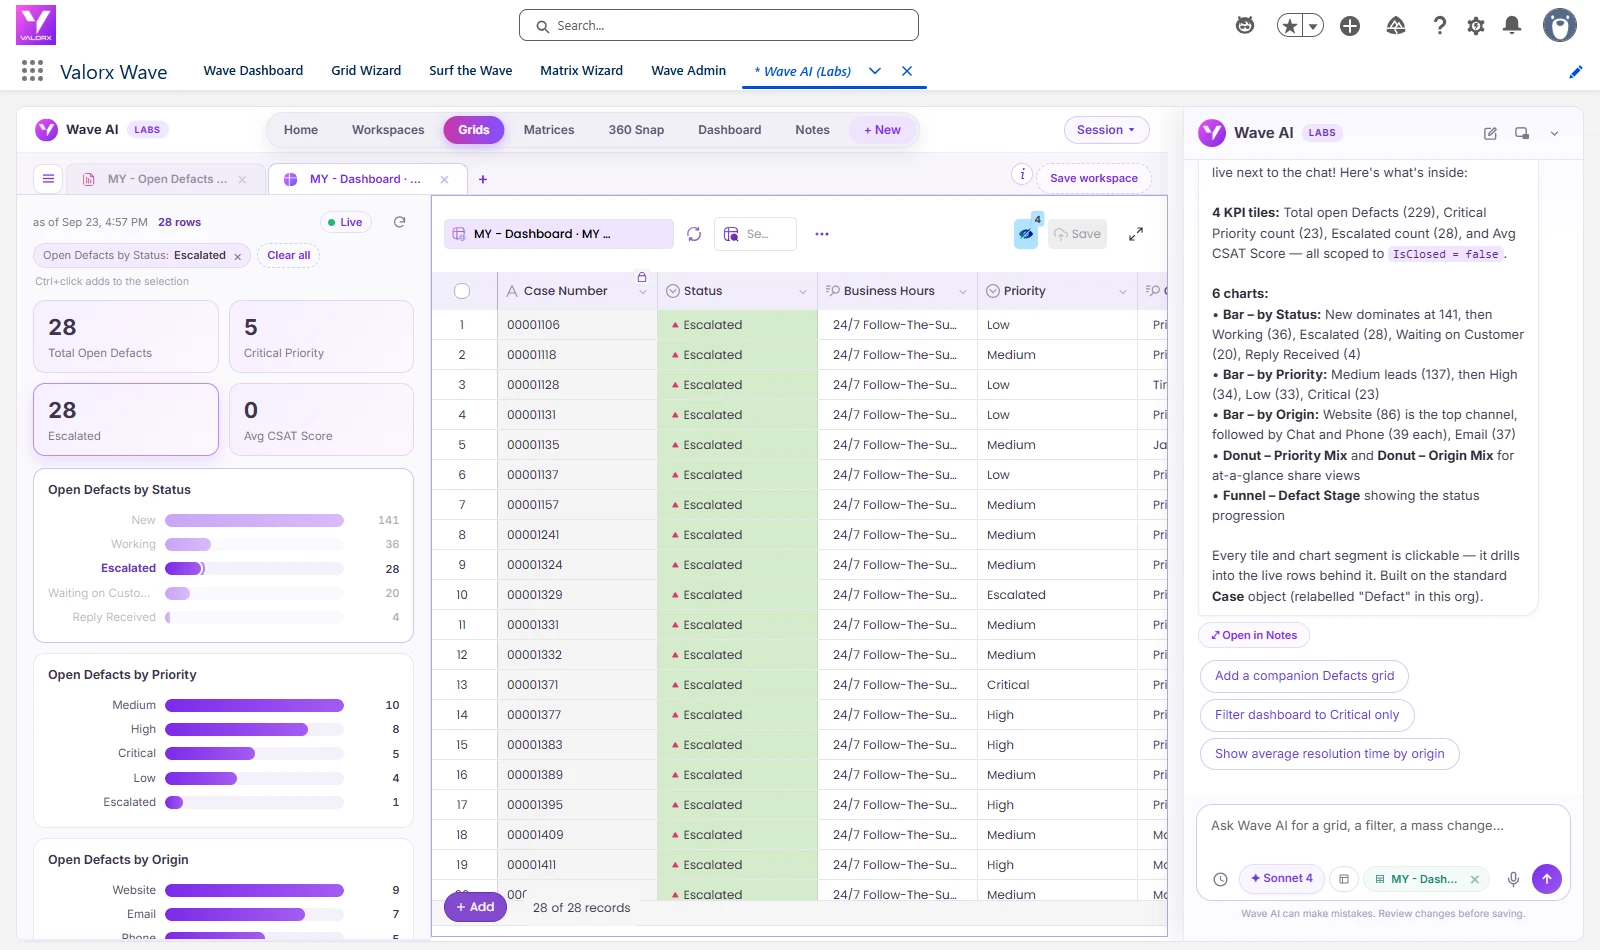
28 open cases were marked Escalated, but 14 of them still carried Low or Medium priority, so every queue sorted by priority put them near the bottom. Watch Wave AI build the service dashboard from one sentence, open the 28 escalated cases with one click on a bar, and move those 14 to High in one reviewed change. Leave with the prompts and Power BI's current pricing. Recorded in a Salesforce demo org with real screens, nothing mocked up.
The short answer
- Looking for a Power BI alternative for Salesforce? If your job is reporting across Salesforce, finance and everything else in your data estate, keep Power BI. If your job is spotting a problem in Salesforce and fixing the records behind it, that's the job Wave AI does.
- Live records, not a refresh. The dashboard reads Salesforce as it is right now. There is no import and no refresh schedule to wait for.
- Every chart opens its records. Click a bar and the cases behind it appear in an editable grid beside the chart.
- Every fix is reviewed first. Count, current values and a dry run before a single Yes, and one Undo takes it back. Wave AI is free in public beta.
The queue that looked handled: 28 escalations
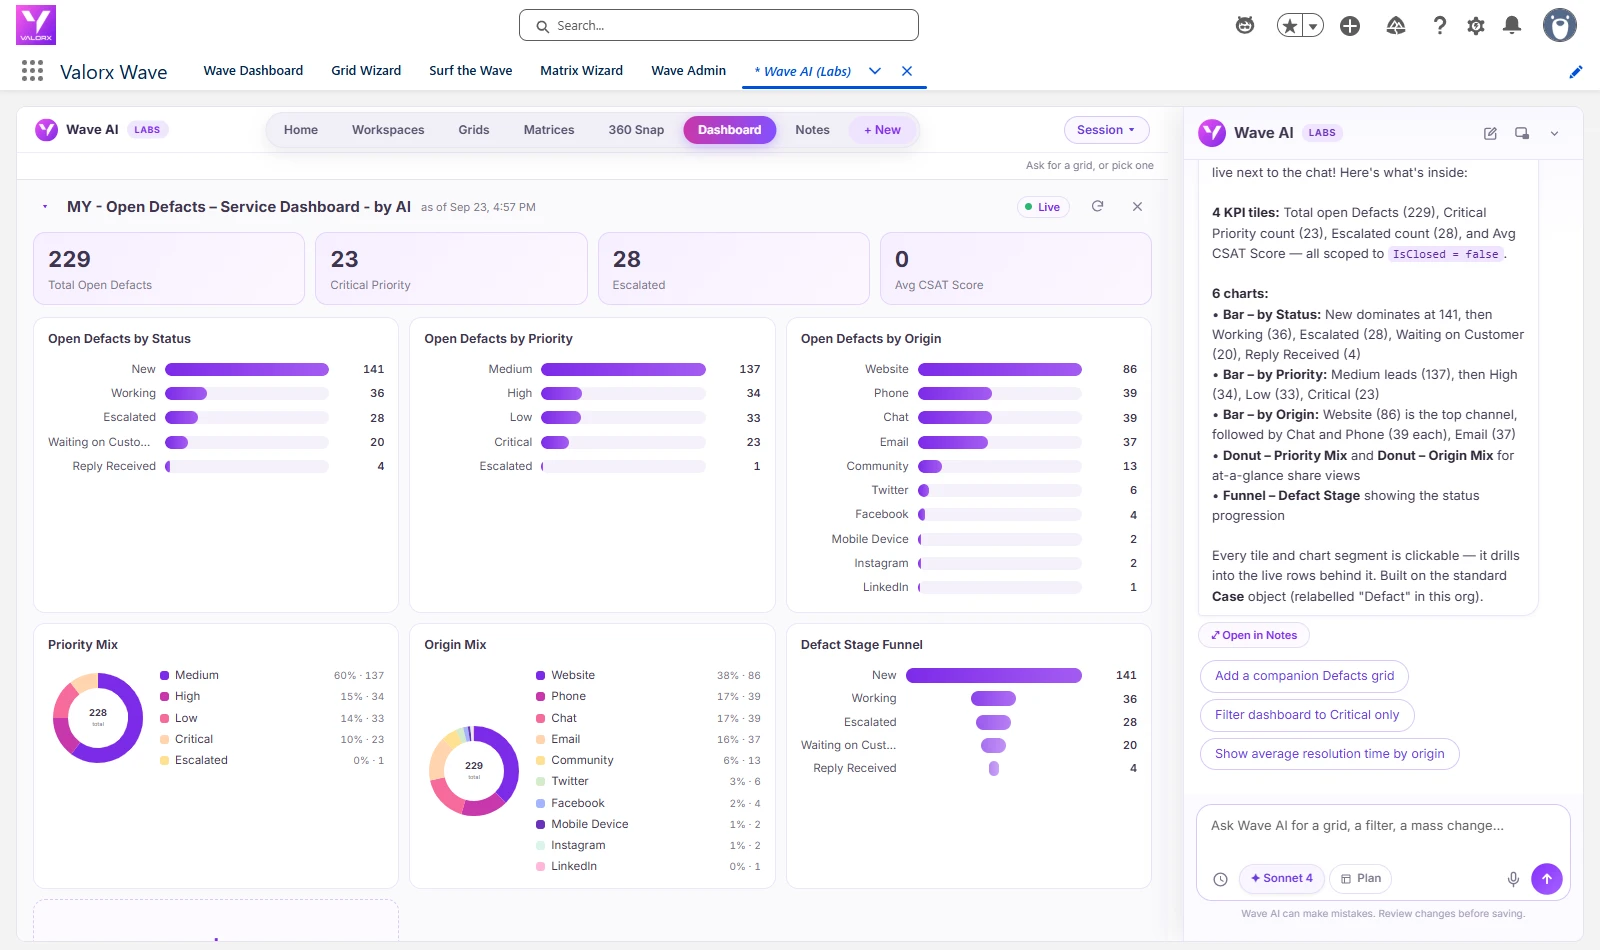
Service teams live on the case dashboard, and a lot of them build it in Power BI. We built ours with one sentence, typed into Wave AI inside Salesforce:
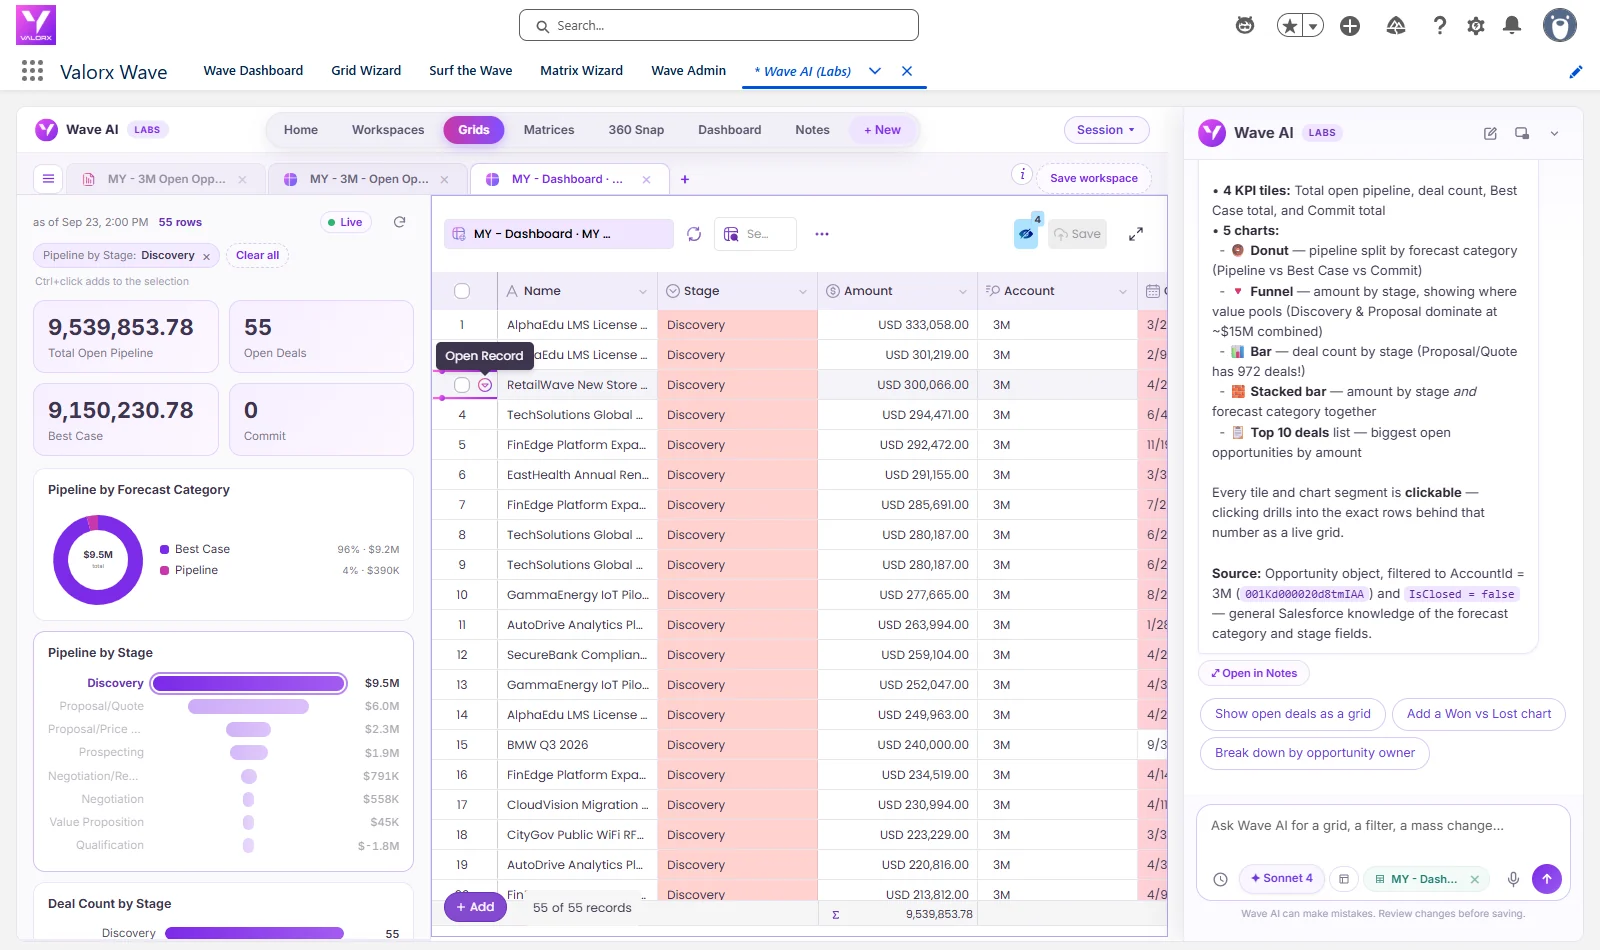
Under a minute later it had four tiles and six charts: 229 open cases (this demo org labels Case as Defects), 23 at Critical priority, 28 Escalated, then cases by status, by priority and by origin, a priority mix, an origin mix and a stage funnel.
The tiles say 28 cases are escalated, and the priority chart says only 57 open cases are High or Critical. Nothing on the page says which escalations still sit at Low or Medium. That's the question the dashboard raises. The answer is in the records behind it.
Click the bar, get the cases
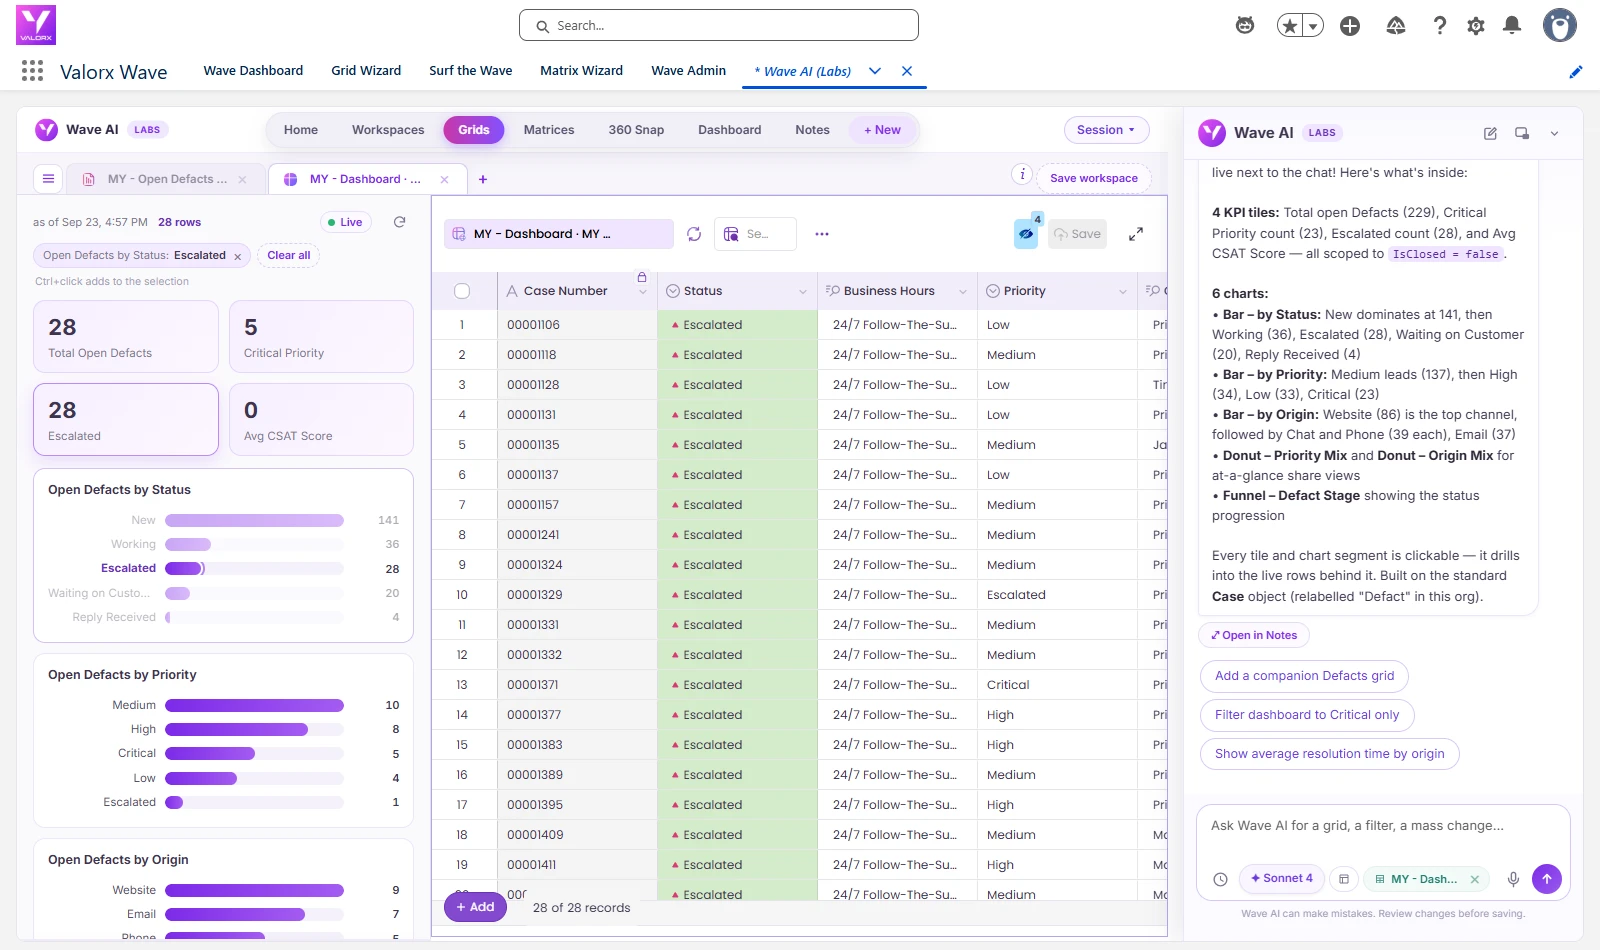
We clicked Escalated on the status chart. The tiles recalculated to 28 cases and 5 critical, every chart redrew for just those cases, and a grid opened beside them with all 28 rows: case number, status, business hours and priority. The priority column told the story: a run of Low and Medium on cases the team had already escalated.
You
Ask for the dashboard
One sentence, on your own objects.
Wave AI
Charts the queue
Four tiles and six charts, on live records.
You
Click a bar
Escalated: 28 cases open in a grid beside it.
You, reviewing
See it before it saves
Count, current values, a dry run, then Yes.
Salesforce
Records updated
Same permissions. Undo takes it back.
14 priorities, one reviewed change
From the dashboard we typed the fix the way a support manager would say it:
Nothing moved yet. Wave AI came back with the plan: 14 escalated cases at Low or Medium, priority to High on all 14, a sample of their current values, and a dry run on all 14 that passed. Then it asked, "Shall I apply this?" We said yes. It reported all 14 updated with no failures, and the grid showed High where Low and Medium had been. The other 14 escalations weren't touched.
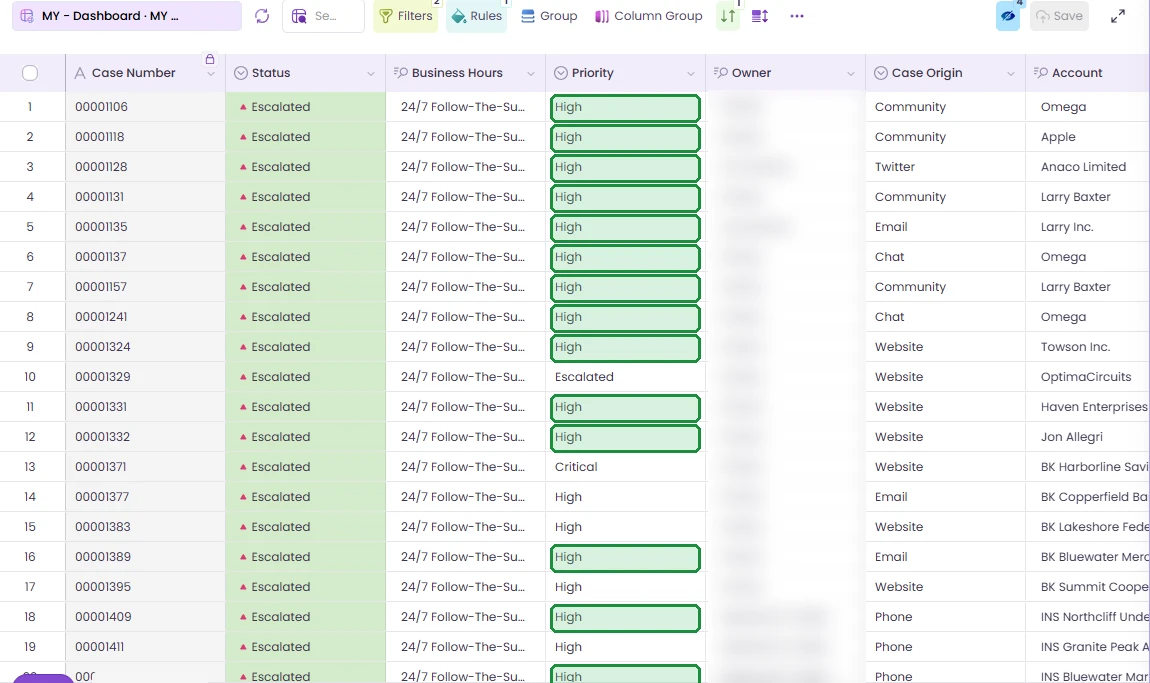
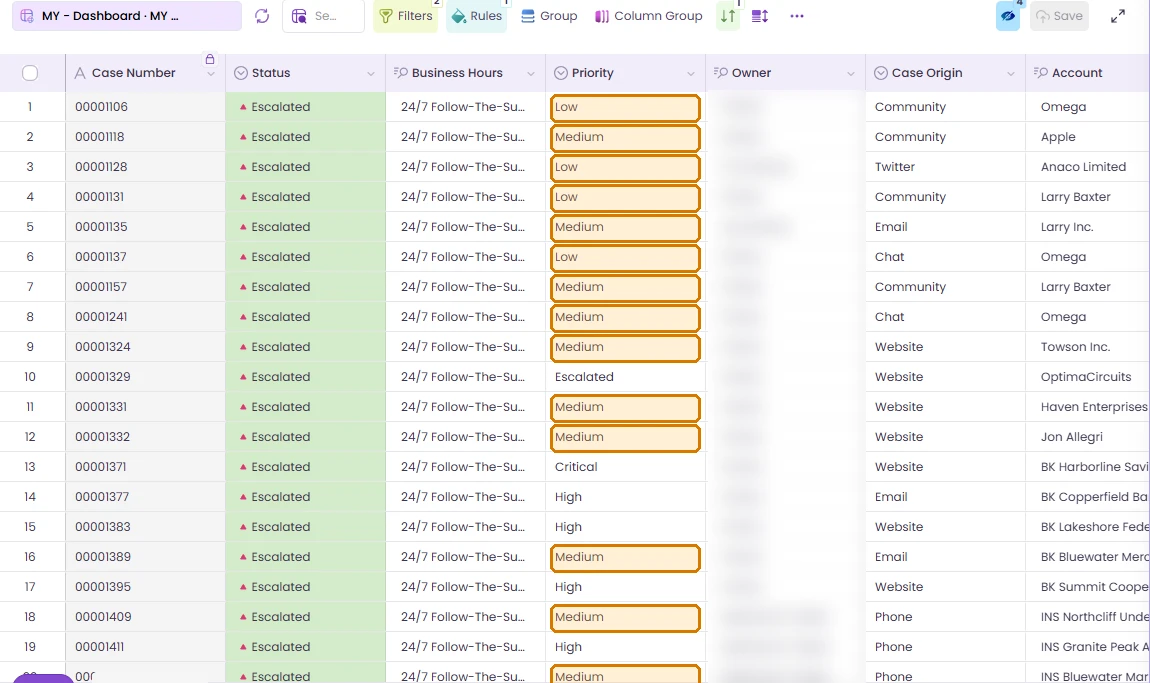 ↔Before · Low and MediumAfter · High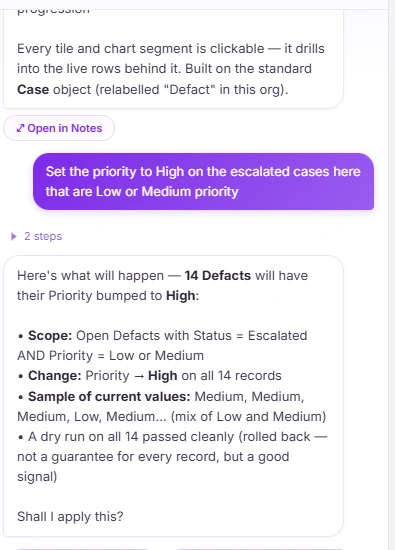
Then we typed "Undo that", confirmed, and every priority went back. We checked all 229 open cases in Salesforce against a copy taken before the test. Zero differences.
229
open cases charted from one sentence
28
escalated cases, one click on a bar away
14
priorities fixed in one reviewed change
1
Undo to put all 14 back, checked in Salesforce
0
imports, refreshes or files exported
Looking for a Power BI alternative? Compare the jobs first
Power BI is a strong analytics platform, and for reporting across Salesforce, finance and the rest of your data it's often the right tool. The comparison below is about one narrower job: seeing a problem in Salesforce and fixing the records behind it. Where we describe Power BI, it's from Microsoft's own documentation and pricing page, linked.
| The job | Power BI | Wave AI |
|---|---|---|
| Where the data sits | Imported from Salesforce through the Salesforce Objects or Salesforce Reports connector, then refreshed on a schedule: up to eight times a day on shared capacity, 48 on Premium Per User or Fabric capacity.234 | The live records, inside Salesforce. Nothing to import or refresh. |
| Reports as a source | "The number of rows you can access in Salesforce Reports is limited by Salesforce to 2,000 rows." Microsoft points to the Objects connector for more.2 | A grid of every matching record, beside the chart. |
| Building from a sentence | Copilot creates and edits report pages from a prompt. It needs Fabric F2 or Premium P1 capacity; "A Power BI Pro or Premium Per User (PPU) license alone isn't sufficient."5 | One sentence builds the dashboard and the grid behind it. |
| Acting on the records | Translytical task flows write back to Fabric databases and can call an external API. The Power Automate visual runs a flow from a button, on up to 1,000 records.67 | Click a bar and the records open beside it. Change them in one reviewed step. 14 in the run above. |
| Undo | Not described on the pages above. | One Undo takes the whole change back. |
Power BI pricing, and what Wave AI costs
Power BI, as published
Power BI Free1$0
Power BI Pro, paid yearly1$14 / user / month
Premium Per User, paid yearly1$24 / user / month
Fabric capacity and Power BI Embedded1variable
Copilot in Power BI5needs Fabric F2 or Premium P1
List prices from microsoft.com, read 23 September 2026. Your contract may differ.
Wave AI
Freein beta
- No card
- No seat limit
- Einstein or your own AI key
- Your data never trains a model
Pricing arrives at public launch. Beta members hear first.
What each team gets
Support managers
"28 escalations, and half of them look routine."
Click the escalated bar, see the priorities that disagree, and fix them in one reviewed step. The queue sorts right again.
Service operations
"Our dashboard is only as fresh as the last refresh."
Wave AI reads the cases as they are now, so the chart and the grid match what agents see.
Salesforce admins
"Every new chart is a new dataset to maintain."
People build their own view in a sentence, on the objects you've already secured. Permissions and sharing rules still apply.
IT and platform owners
"How many copies of CRM data do we keep?"
None, for this job. The dashboard, the grid and the change all run on the live records inside Salesforce.
The prompts from this post
These are word for word what we typed. Swap in your own object and values.
In Wave AI
Build a service dashboard for the open cases with a bar chart by status, a bar chart by priority and one by origin
Then click a bar
Escalated, on the cases by status chart
Fix it, naming the rule
Set the priority to High on the escalated cases here that are Low or Medium priority
After checking the review
Yes, apply it
If you change your mind
Undo that
What people ask about Power BI and Wave AI
Is Wave AI a Power BI alternative?
For reporting across many data sources, no: Power BI is built for that. For seeing a problem in Salesforce data and fixing the records behind it, Wave AI does the whole job in one place: the dashboard, the records behind any chart, and a reviewed change.
How does Power BI get Salesforce data?
Through the Salesforce Objects and Salesforce Reports connectors. Microsoft's docs say the Reports connector is limited by Salesforce to 2,000 rows, and point to the Objects connector for more. Data is loaded and refreshed on a schedule.
How often does Power BI refresh?
Microsoft's docs list up to eight scheduled refreshes a day on shared capacity, and up to 48 on Premium Per User or Fabric capacity.
Can Power BI write data back?
Translytical task flows let report users update, add or delete data in Fabric databases and call an external API, and the Power Automate visual runs a flow from a button on up to 1,000 records.
How much does Power BI cost?
Microsoft lists Power BI Pro at $14 per user per month and Premium Per User at $24, paid yearly, with a free tier. Copilot needs Fabric F2 or Premium P1 capacity. Those are list prices read on 23 September 2026.
What's live in the beta today?
Grids and the fix-in-place work are live. Dashboards and matrices are in testing and rolling out to beta members.
What does Wave AI cost?
It's free for the whole beta, with no card and no seat limit. Pricing is published at public launch.
See the queue. Fix the cases behind it.
Bring the dashboard your team checks every morning. We'll help you open the records behind it in the beta.
Wave AI builds it. Valorx Wave runs it for the whole team.
Join the betaSources
- Microsoft, Power BI pricing.
- Microsoft Learn, Salesforce Reports connector.
- Microsoft Learn, Salesforce Objects connector.
- Microsoft Learn, Data refresh in Power BI.
- Microsoft Learn, Copilot in Power BI.
- Microsoft Learn, Translytical task flows.
- Microsoft Learn, Power Automate visual for Power BI.
The recordings were made in a Salesforce demo org on 23 September 2026. Waiting time is cut out of the videos, and names in the owner column are blurred. Power BI, Microsoft Fabric and Power Automate are trademarks of Microsoft. Salesforce is a trademark of Salesforce, Inc. Account names are demo data.

Choose the workflow you need:
Try Wave in browser Extension

Try Wave in Salesforce

Try Fusion In Excel

Enhancing Salesforce for industry leaders