How Western Digital unified Salesforce and ERP forecasting into one view — and finally got forecasts teams trust

THE PROBLEM
Salesforce had the forecast. The ERP had the actuals. Nobody had the full picture.
Western Digital is one of the world's largest manufacturers of hard drives and data storage products — a business built on precision forecasting. When you're manufacturing physical hardware at global scale, getting the forecast wrong doesn't just affect pipeline reports. It affects production lines, supply chains, and inventory commitments worth millions.
Their sales teams needed to do something deceptively simple: view multiple accounts, opportunities, and products simultaneously — and forecast for future months while comparing to actuals.
The actuals lived in the ERP. The forecasts lived in Salesforce. And the two systems didn't talk to each other.
Salesforce's standard UI compounded the problem. Native list views displayed only a few fields at a time. There was no way to organize and display forecast information across different time periods— weekly, monthly, quarterly — in a single view. Teams couldn't model the complex forecast patterns their business demanded.
So they worked around it. They exported from Salesforce. They pulled from the ERP. They built spreadsheets that tried to bridge the two systems manually. Every forecast cycle meant hours of data assembly — and every assembled view was a snapshot that started going stale the moment it was finished.
With the standard UI in Salesforce, users were only able to view a list of a few fields — making it difficult to analyze accurate data. Without the ability to display forecast information across different time periods, we couldn't model the complex forecast patterns our business requires.Sales Operations, Western Digital
WHAT THE FORECAST CYCLE ACTUALLY LOOKED LIKE (Before Valorx)
THE THREE PROBLEMS THAT MADE FORECASTING IMPOSSIBLE :
1. The Salesforce-ERP gap
The forecast lived in Salesforce. The actuals — real purchase data, real shipments, real revenue — lived in the ERP. There was no native integration between the two. Every comparison required manual data pulls from both systems and painstaking alignment in spreadsheets.
Sales managers couldn't answer the most basic forecasting question — 'How does our forecast compare to what actually shipped?' — without days of manual work.
2. No time-phased forecasting
Western Digital's business runs on time-phased forecasts: weekly production schedules, monthly revenue targets, quarterly business reviews. Salesforce's standard UI had no way to display forecast data across multiple time periods in a single view. Teams couldn't see the progression from week to week or compare a monthly forecast to a quarterly aggregate without building custom reports from scratch.
3. Poor user experience killed data quality
When the forecasting workflow is painful, people avoid it. When people avoid it, data quality suffers. Western Digital' steams were stuck in a cycle: Salesforce was too cumbersome for real forecasting work, so teams did the work in spreadsheets — which meant the data in Salesforce was incomplete, which made Salesforce even less useful for forecasting.
Our ERP and Salesforce were not integrated, making it extremely difficult to analyze actual and future data together. The manual process left room for errors and created a poor user experience.
Forecasting & Planning, Western Digital
THE DECISION
Western Digital needed a solution that could bridge two completely separate systems — Salesforce and their ERP —without requiring a full integration project. They needed time-phased forecasting views that Salesforce's native UI couldn't provide. And they needed a user experience familiar enough that adoption wouldn't be another barrier.
During the Fusion proof-of-concept, a Western Digital analyst opened Excel, connected to Salesforce and the ERP simultaneously, pulled opportunity data alongside actual purchase history, and built a time-phased forecast comparing projections to actuals — across weekly, monthly, and quarterly periods.
All in a single spreadsheet. All syncing back to Salesforce in real time.
The same view that previously took days to assemble manually was built in minutes. And because it used Excel — a tool every team member already knew — there was no adoption curve to climb.
Valorx uses a familiar UI, so it doesn't take long for users to adopt. This enables users to focus on their projects rather than spending time learning a new program.
Sales Operations, Western Digital
THE SOLUTION
Valorx Fusion connects Excel directly to Salesforce — and serves as the middleware layer that also pulls actuals from the ERP. Teams get a single Excel workspace where forecasts and actuals live side by side, with real-time sync back to Salesforce. No manual exports. No stale snapshots. No system-switching.
Key capabilities
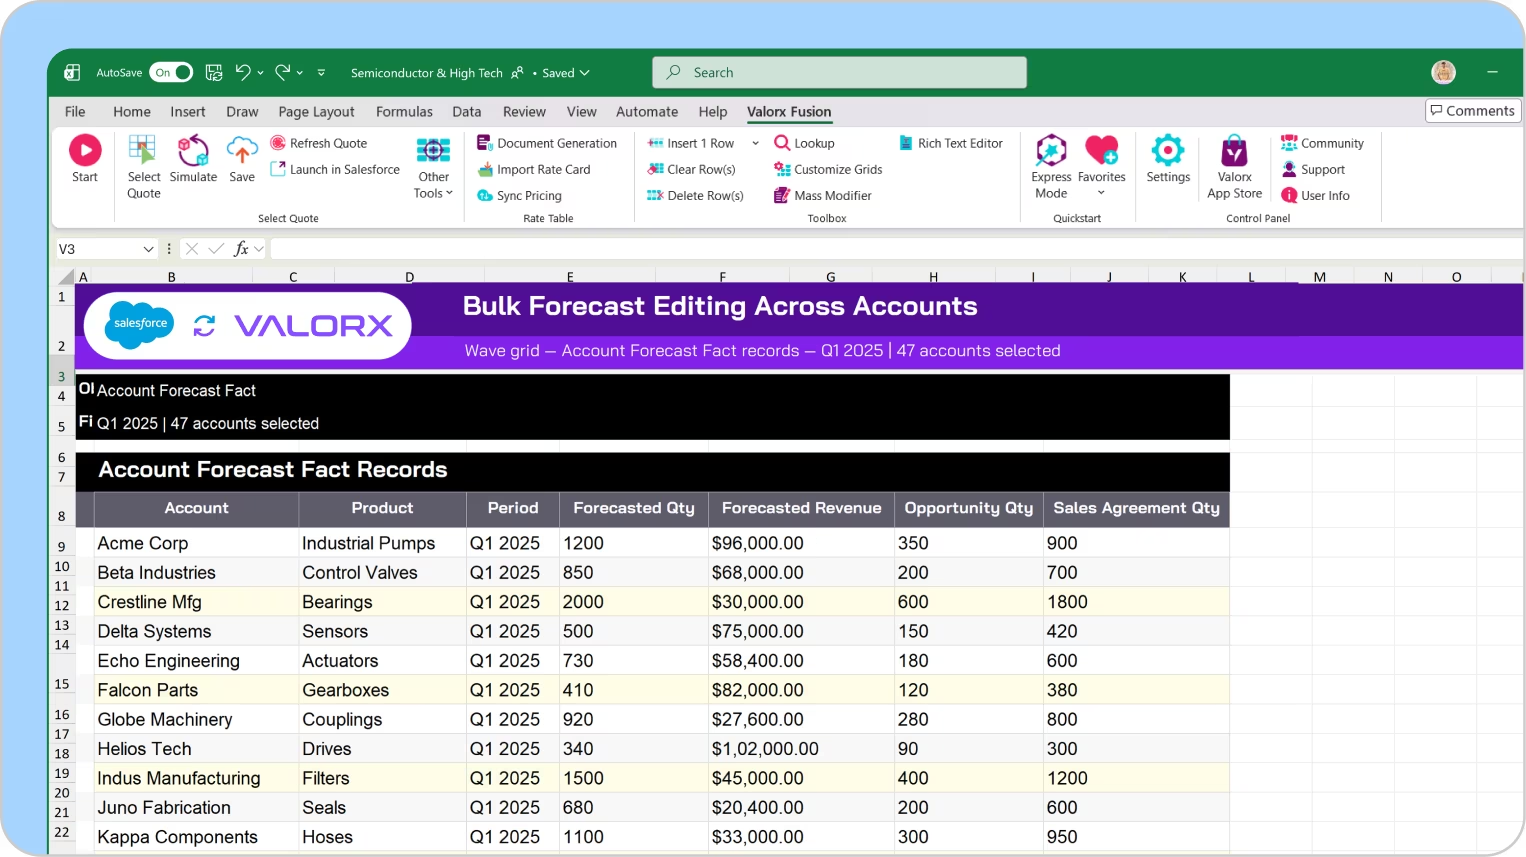
Forecast across any time period in one view
Build weekly, monthly, or quarterly forecasts with aggregate customer and product data — all in a single Excel view. Compare time periods side by side, spot trends, and adjust projections without switching between systems or rebuilding reports.
Compare forecasts to actuals — instantly
View Salesforce opportunity and product data alongside actual purchase data from the ERP. No manual exports. No schema alignment. The data is live, linked, and always current.
See multiple accounts, opportunities, and products simultaneously
View and manage forecast data across dozens of accounts and hundreds of products in a single grid. Filter, sort, group, and pivot — the way you already work in Excel, but powered by live Salesforce and ERP data.
Update forecasts in bulk, sync in one click
Adjust forecast numbers across multiple accounts, products, or time periods simultaneously. Every change syncs back to Salesforce — no manual re-entry, no copy-paste errors, no version conflicts.
Data stays in Salesforce. Always.
Every forecast update syncs to Salesforce in real time. Validation rules, field dependencies, and security permissions remain enforced. Fusion doesn't bypass governance — it works within it, while giving teams the flexibility they need.
See how Fusion connects Salesforce data with Excel for live updates and opportunity forecasting.
THE RESULT
WHAT THE TEAM SAYS
Western Digital's forecasting capabilities were no longer limited thanks to Valorx. Users are now willing to invest the necessary time to ensure data accuracy and timeliness.
Valorx served as the middleware solution for analysis — and then synced updated data to Salesforce. We finally had one place to do all the forecasting work.
Users didn't need to learn a new program. They opened Excel, connected to Salesforce, and started working. Adoption wasn't a challenge — it was immediate.
SEAMLESS INTEGRATION
Fusion connected Western Digital's existing systems without requiring changes to either:
- Salesforce (Sales Cloud): All opportunity, account, product, and forecast data preserved. Standard and custom objects fully supported.
- ERP System: Actual purchase and shipment data pulled into Fusion for side-by-side comparison with Salesforce forecasts. No changes to the ERP required.
- Security & Permissions: Salesforce sharing rules, field-level security, and profile permissions fully enforced within Fusion.
- Reports & Dashboards: Existing Salesforce reports and dashboards now reflected more accurate, more current forecast data — because teams were actually updating Salesforce.
- Downstream Processes: Supply chain planning, production scheduling, and inventory management all benefited from improved forecast accuracy flowing through Salesforce.
- No custom development. No complex integration project. Fusion served as the middleware layer that bridged the gap.
KEY TAKEAWAYS
- Forecasting requires the full picture. When forecasts live in Salesforce and actuals live in the ERP, you need a unified workspace — not manual merges.
- Time-phased views aren't optional in manufacturing. Weekly, monthly, quarterly — if your forecasting tool can't display data across time periods, teams will build spreadsheets that can.
- Adoption follows familiarity. Western Digital's teams adopted Fusion immediately because it uses Excel — the tool they already knew. No retraining. No resistance.
- Data quality is a workflow problem. When forecasting is painful, people avoid it. Make it easy, and teams willingly invest in accuracy.
Choose the workflow you need:
Try Wave in browser Extension

Try Wave in Salesforce

Try Fusion In Excel
