Salesforce Inventory Management
Update stock levels in bulk. Track inventory across locations. Stop managing Salesforce inventory record by record.
Trusted by leading Salesforce partners
Implementation and consulting partners choose Valorx to deliver spreadsheet experiences on top of Salesforce.


USE CASES
What your inventory management has been missing
Salesforce tracks your inventory. Valorx makes it manageable at scale.

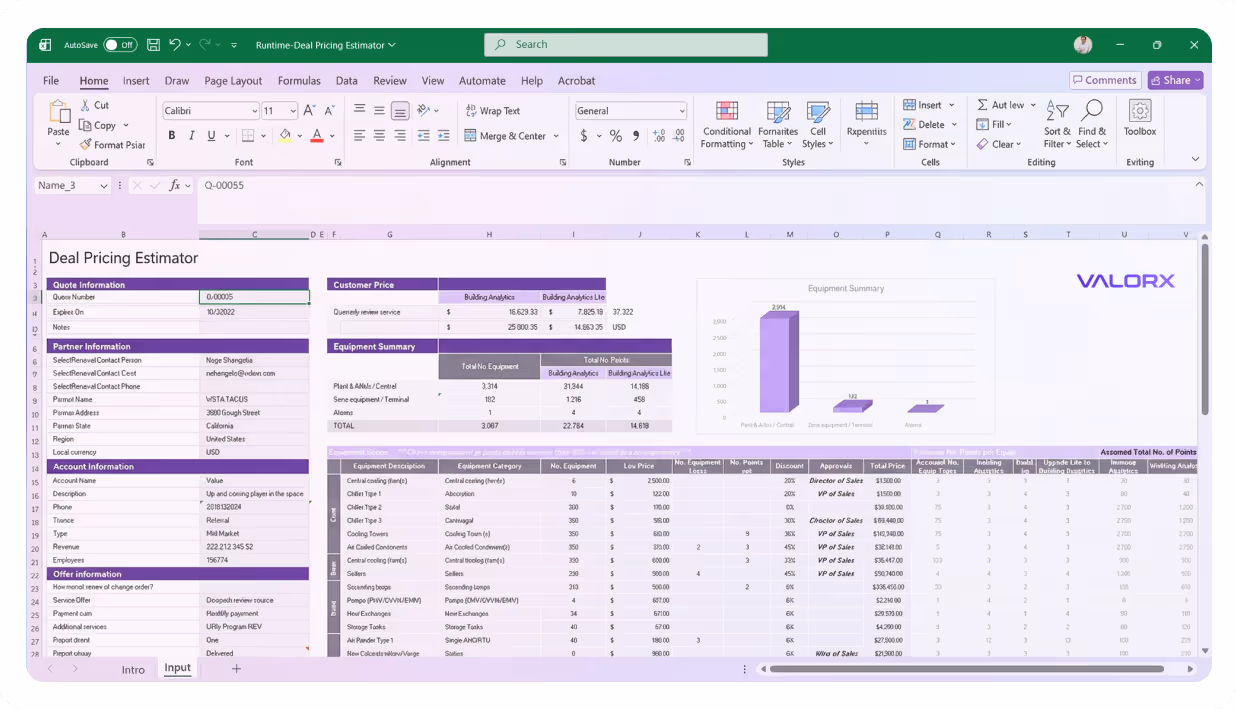
Manage Bill of Materials in one grid
Edit BOM components, quantities, and costs across assemblies. See parent products and their parts together.
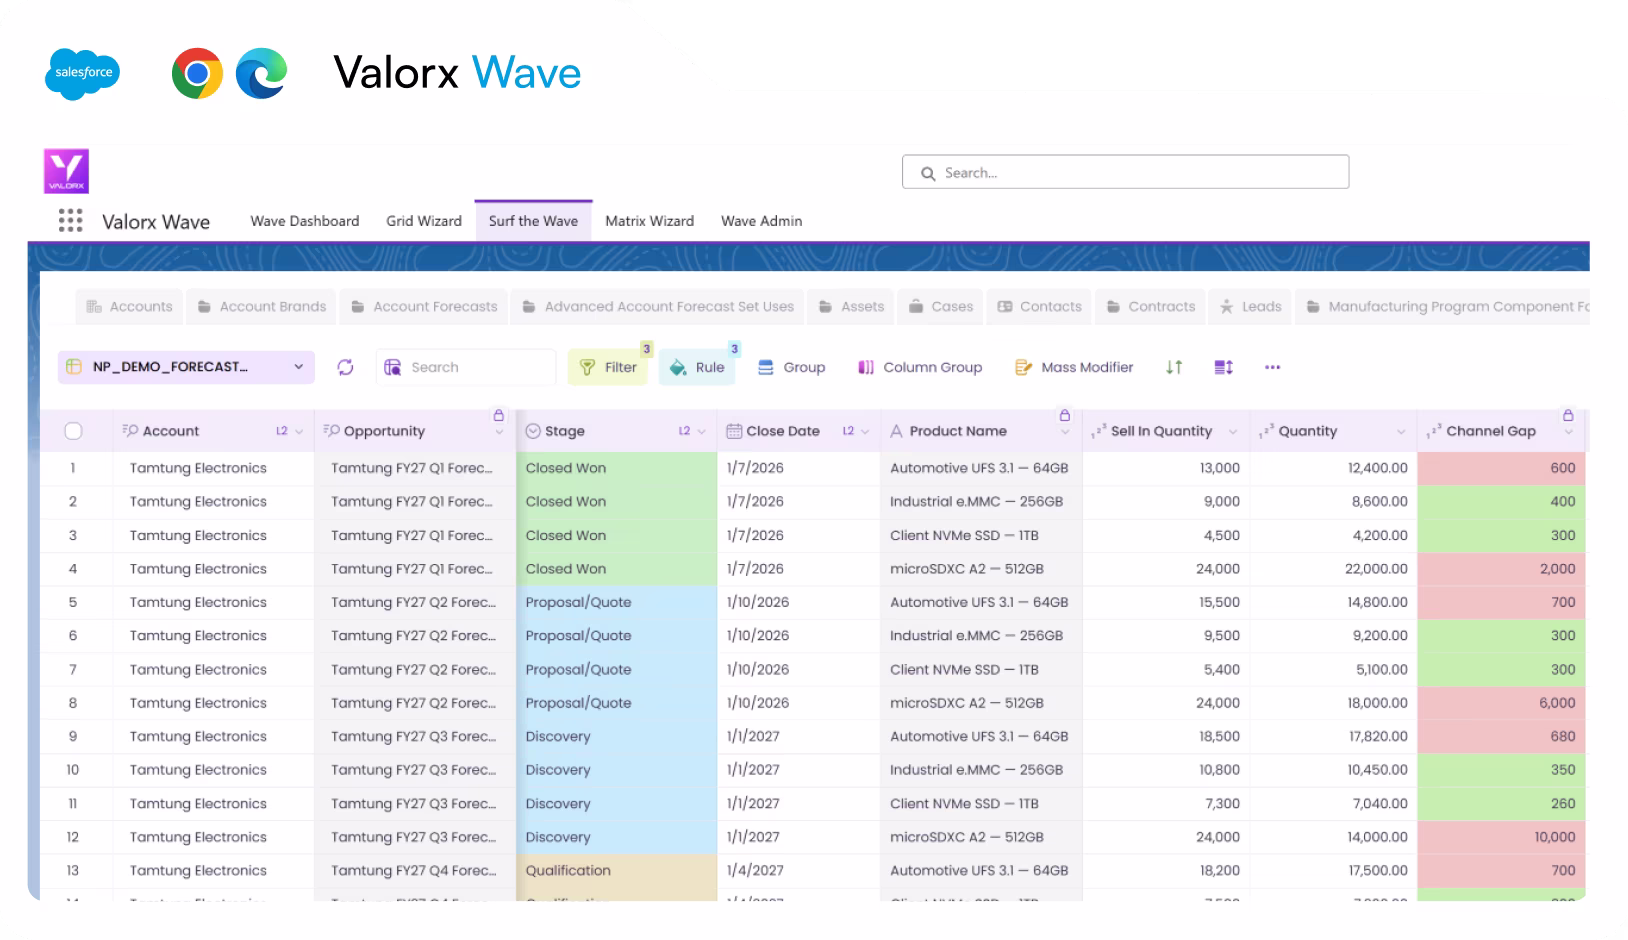
Close the channel gap in one grid
Sell-in, sell-through, and the gap between them—side by side, every edit writing straight back to Salesforce.
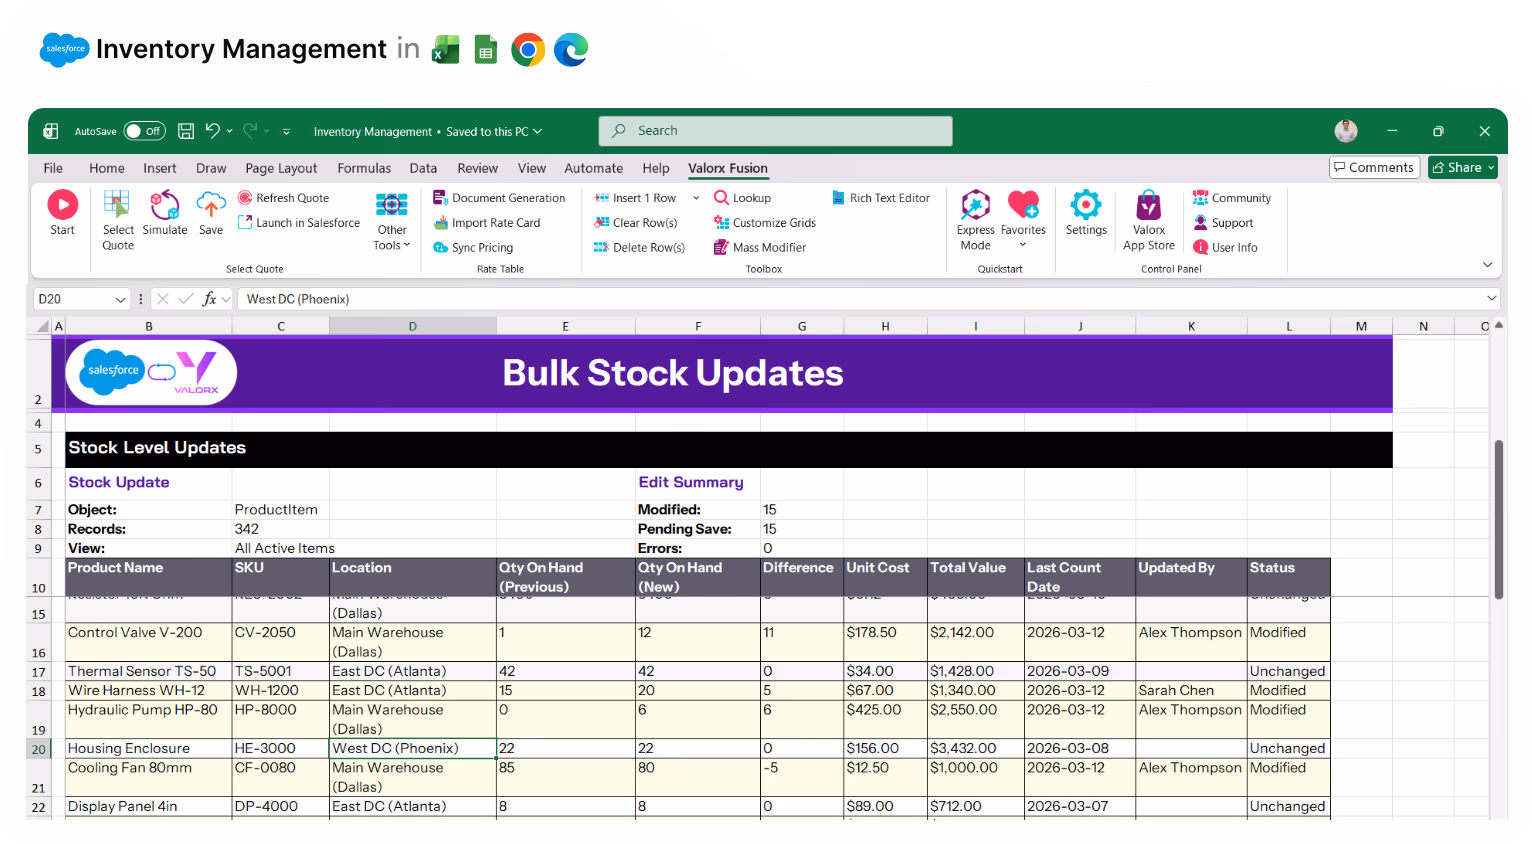
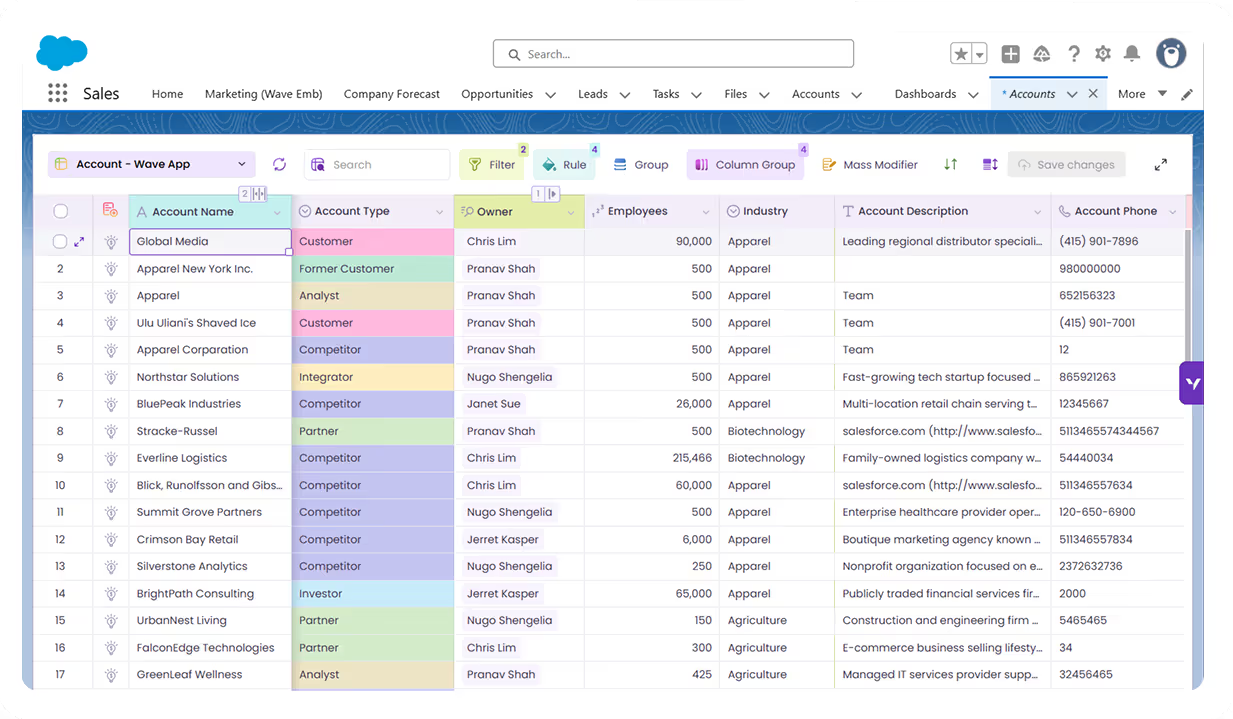
Update stock levels in bulk
Edit hundreds of ProductItems at once with copy/paste, drag/fill, and mass modifier.
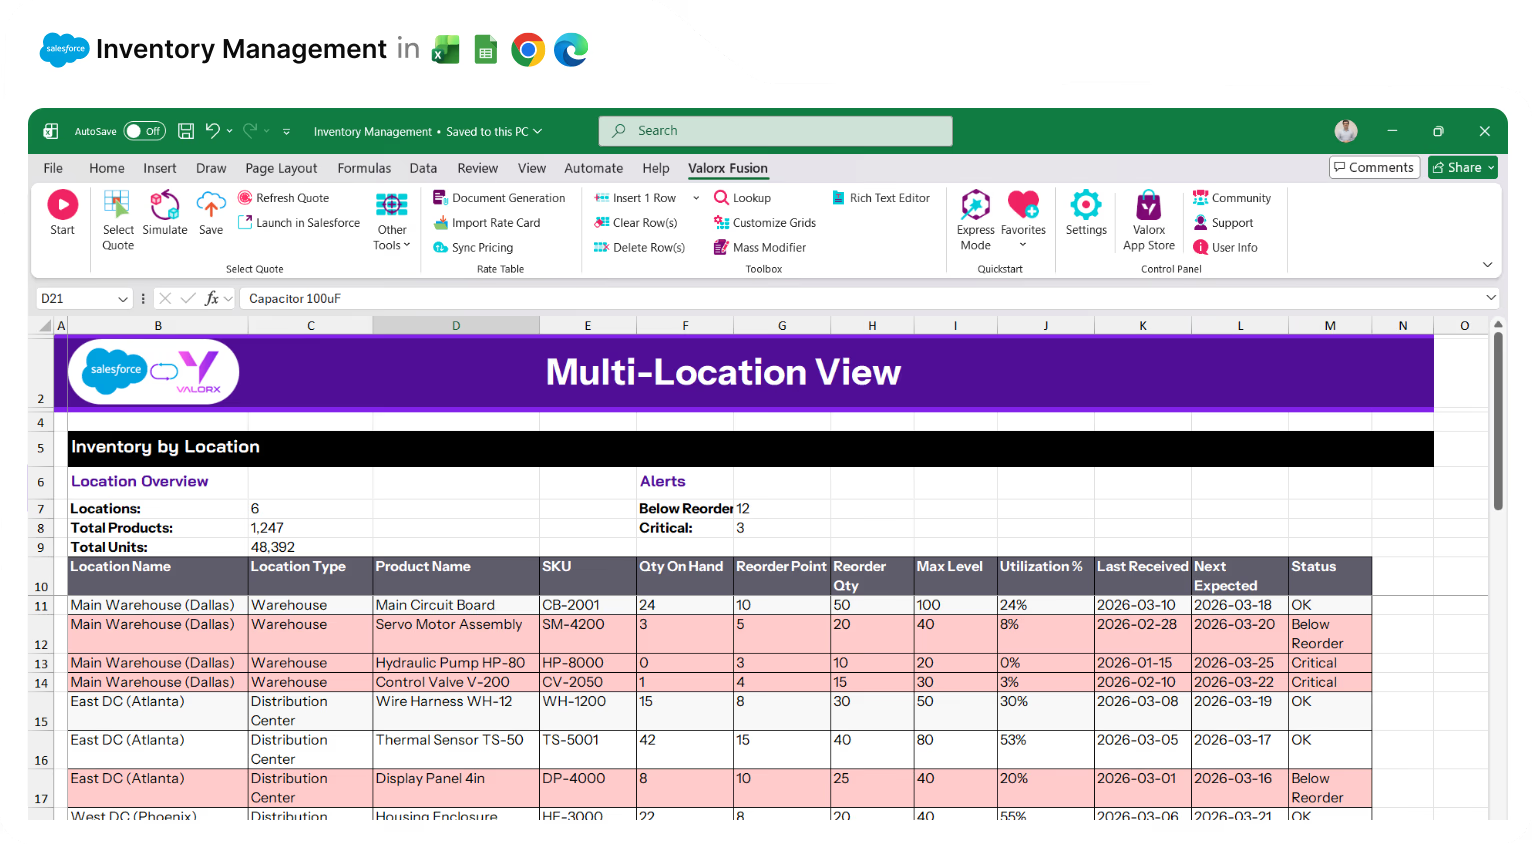
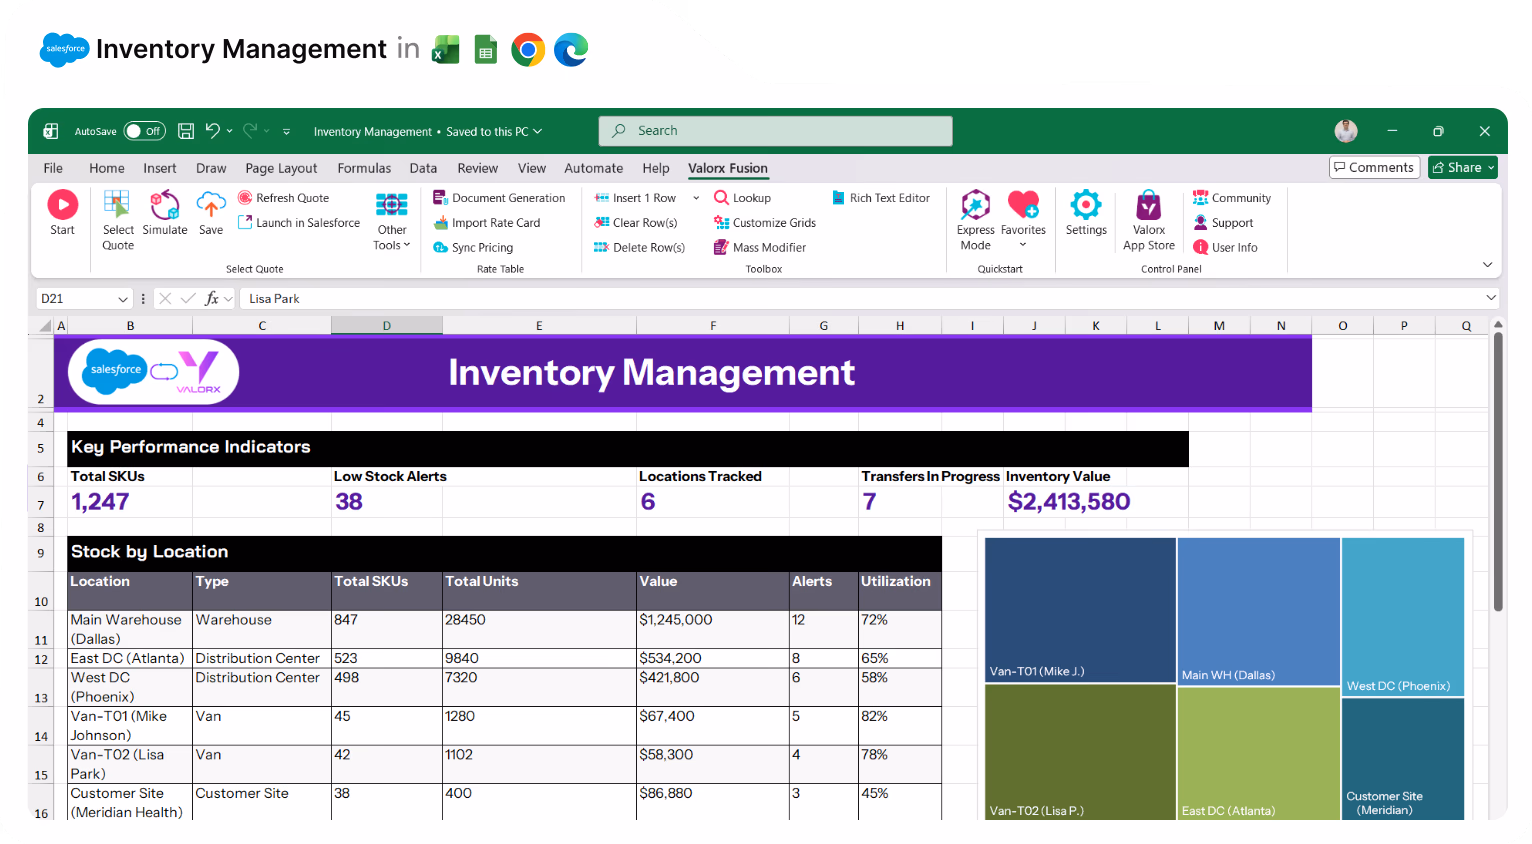
See all locations in one view
Warehouses, vans, customer sites—view stock across every location in a single grid.
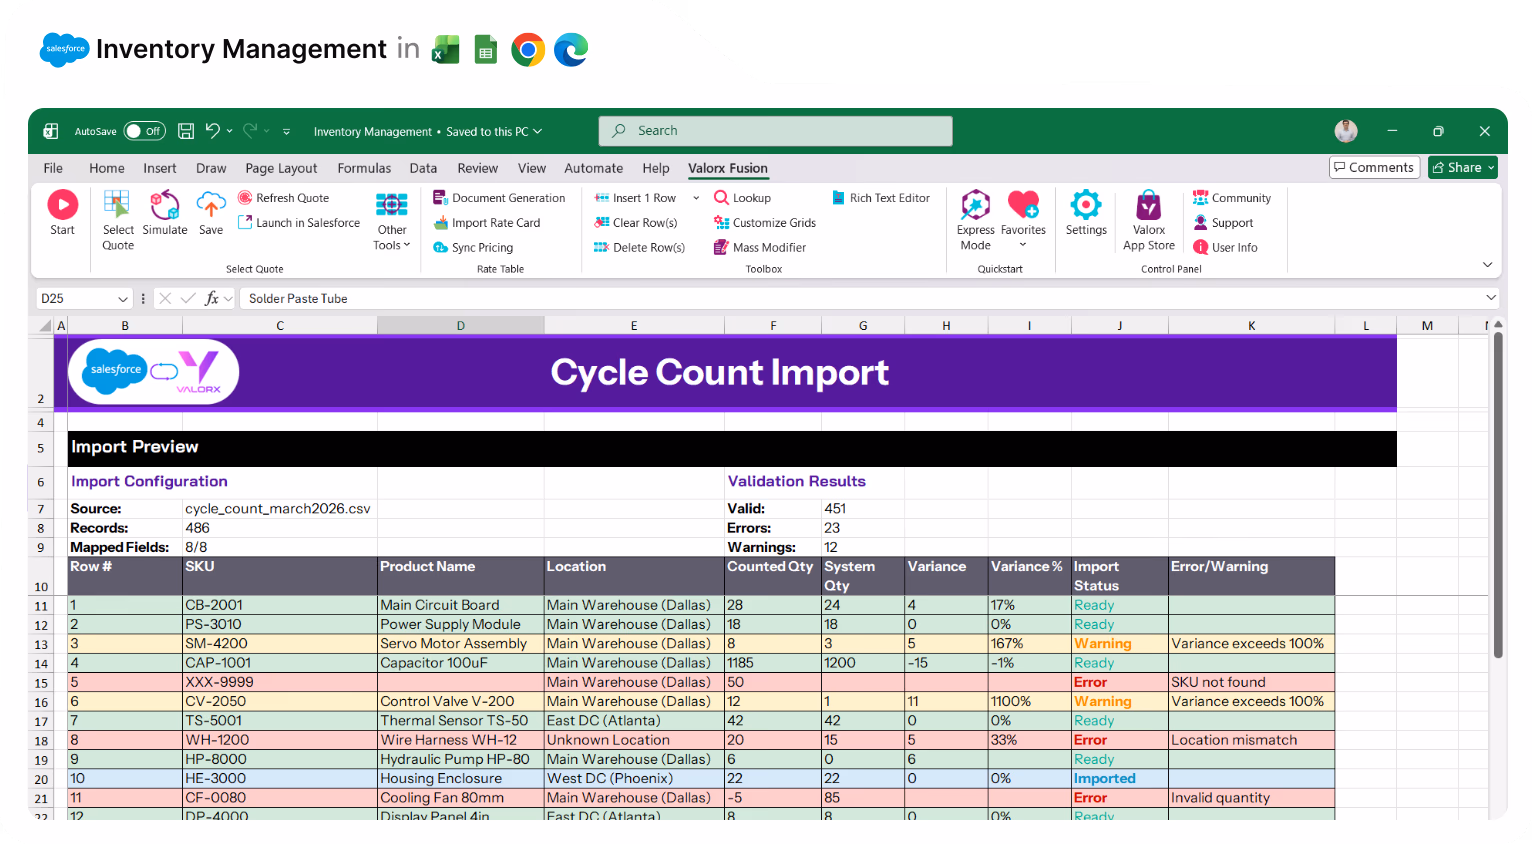
Import cycle counts without errors
Smart Import maps your data, flags issues, and lets you fix them before updating Salesforce.
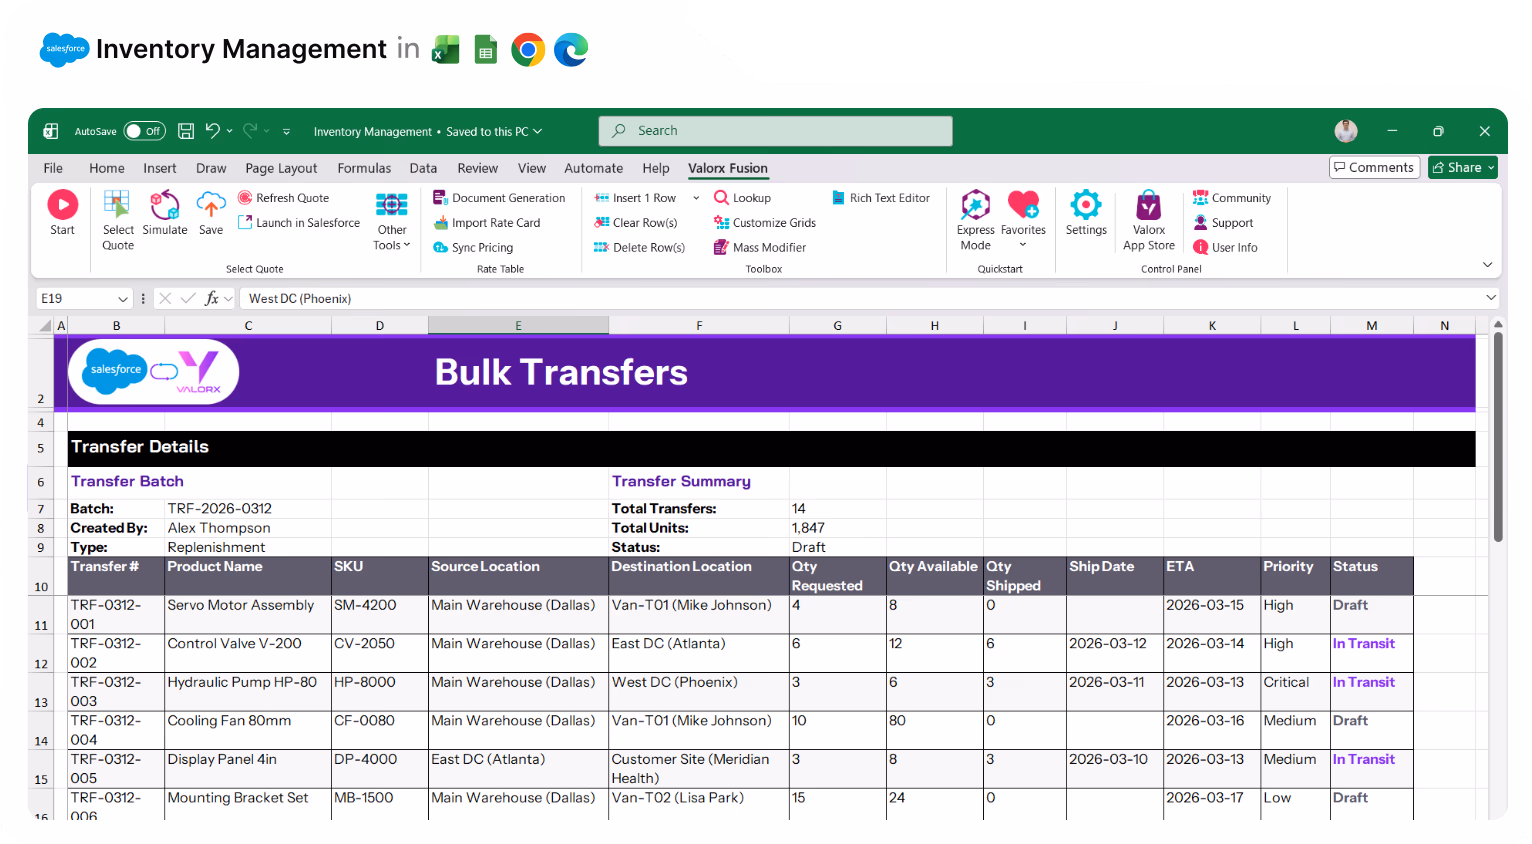
Create transfers in bulk
Build dozens of ProductTransfers at once—warehouse to van, van to site, site to return.
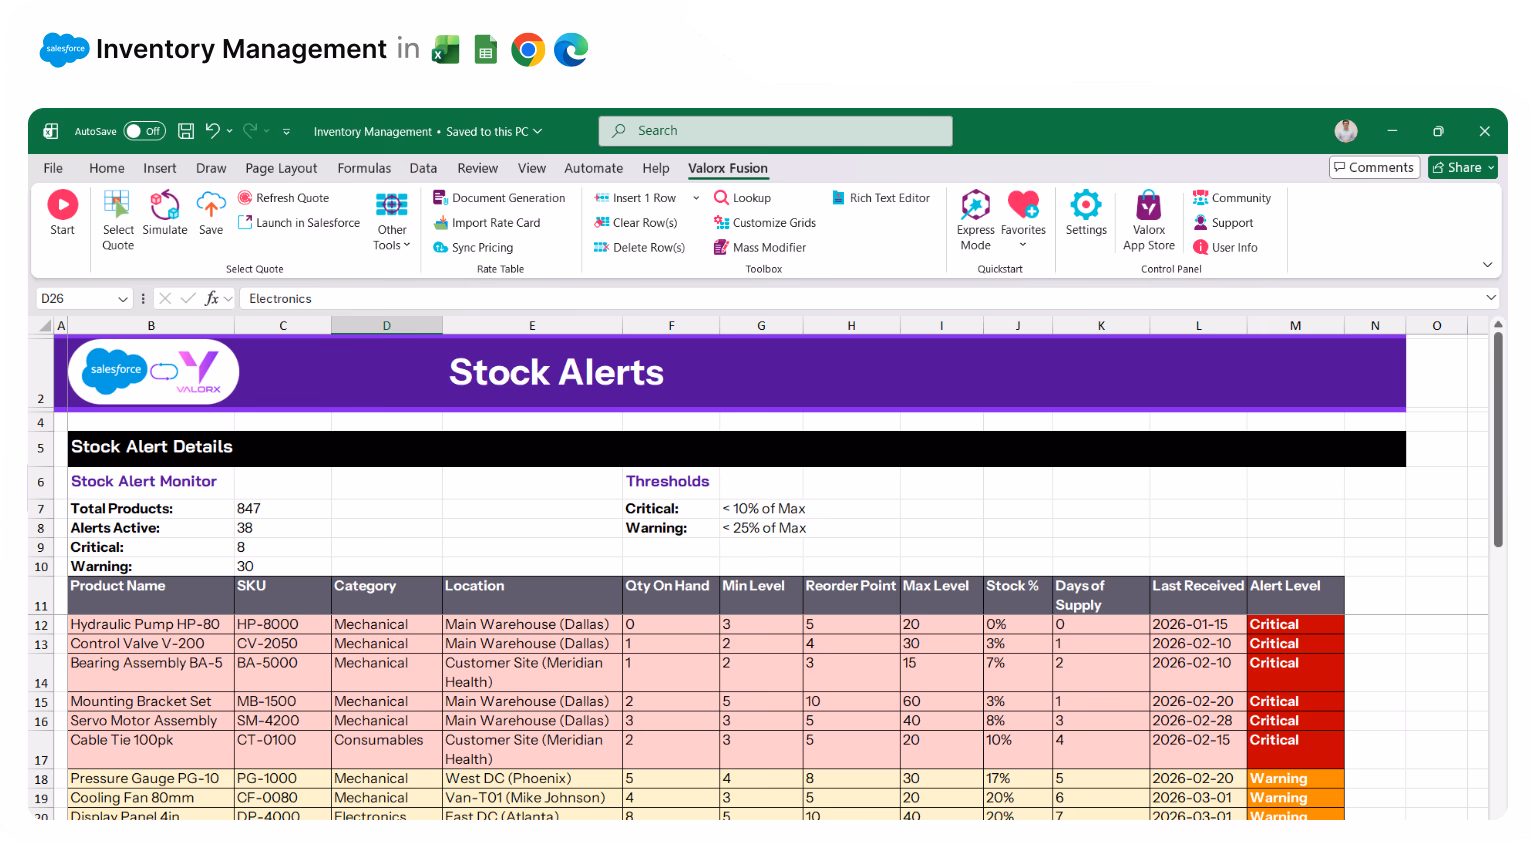
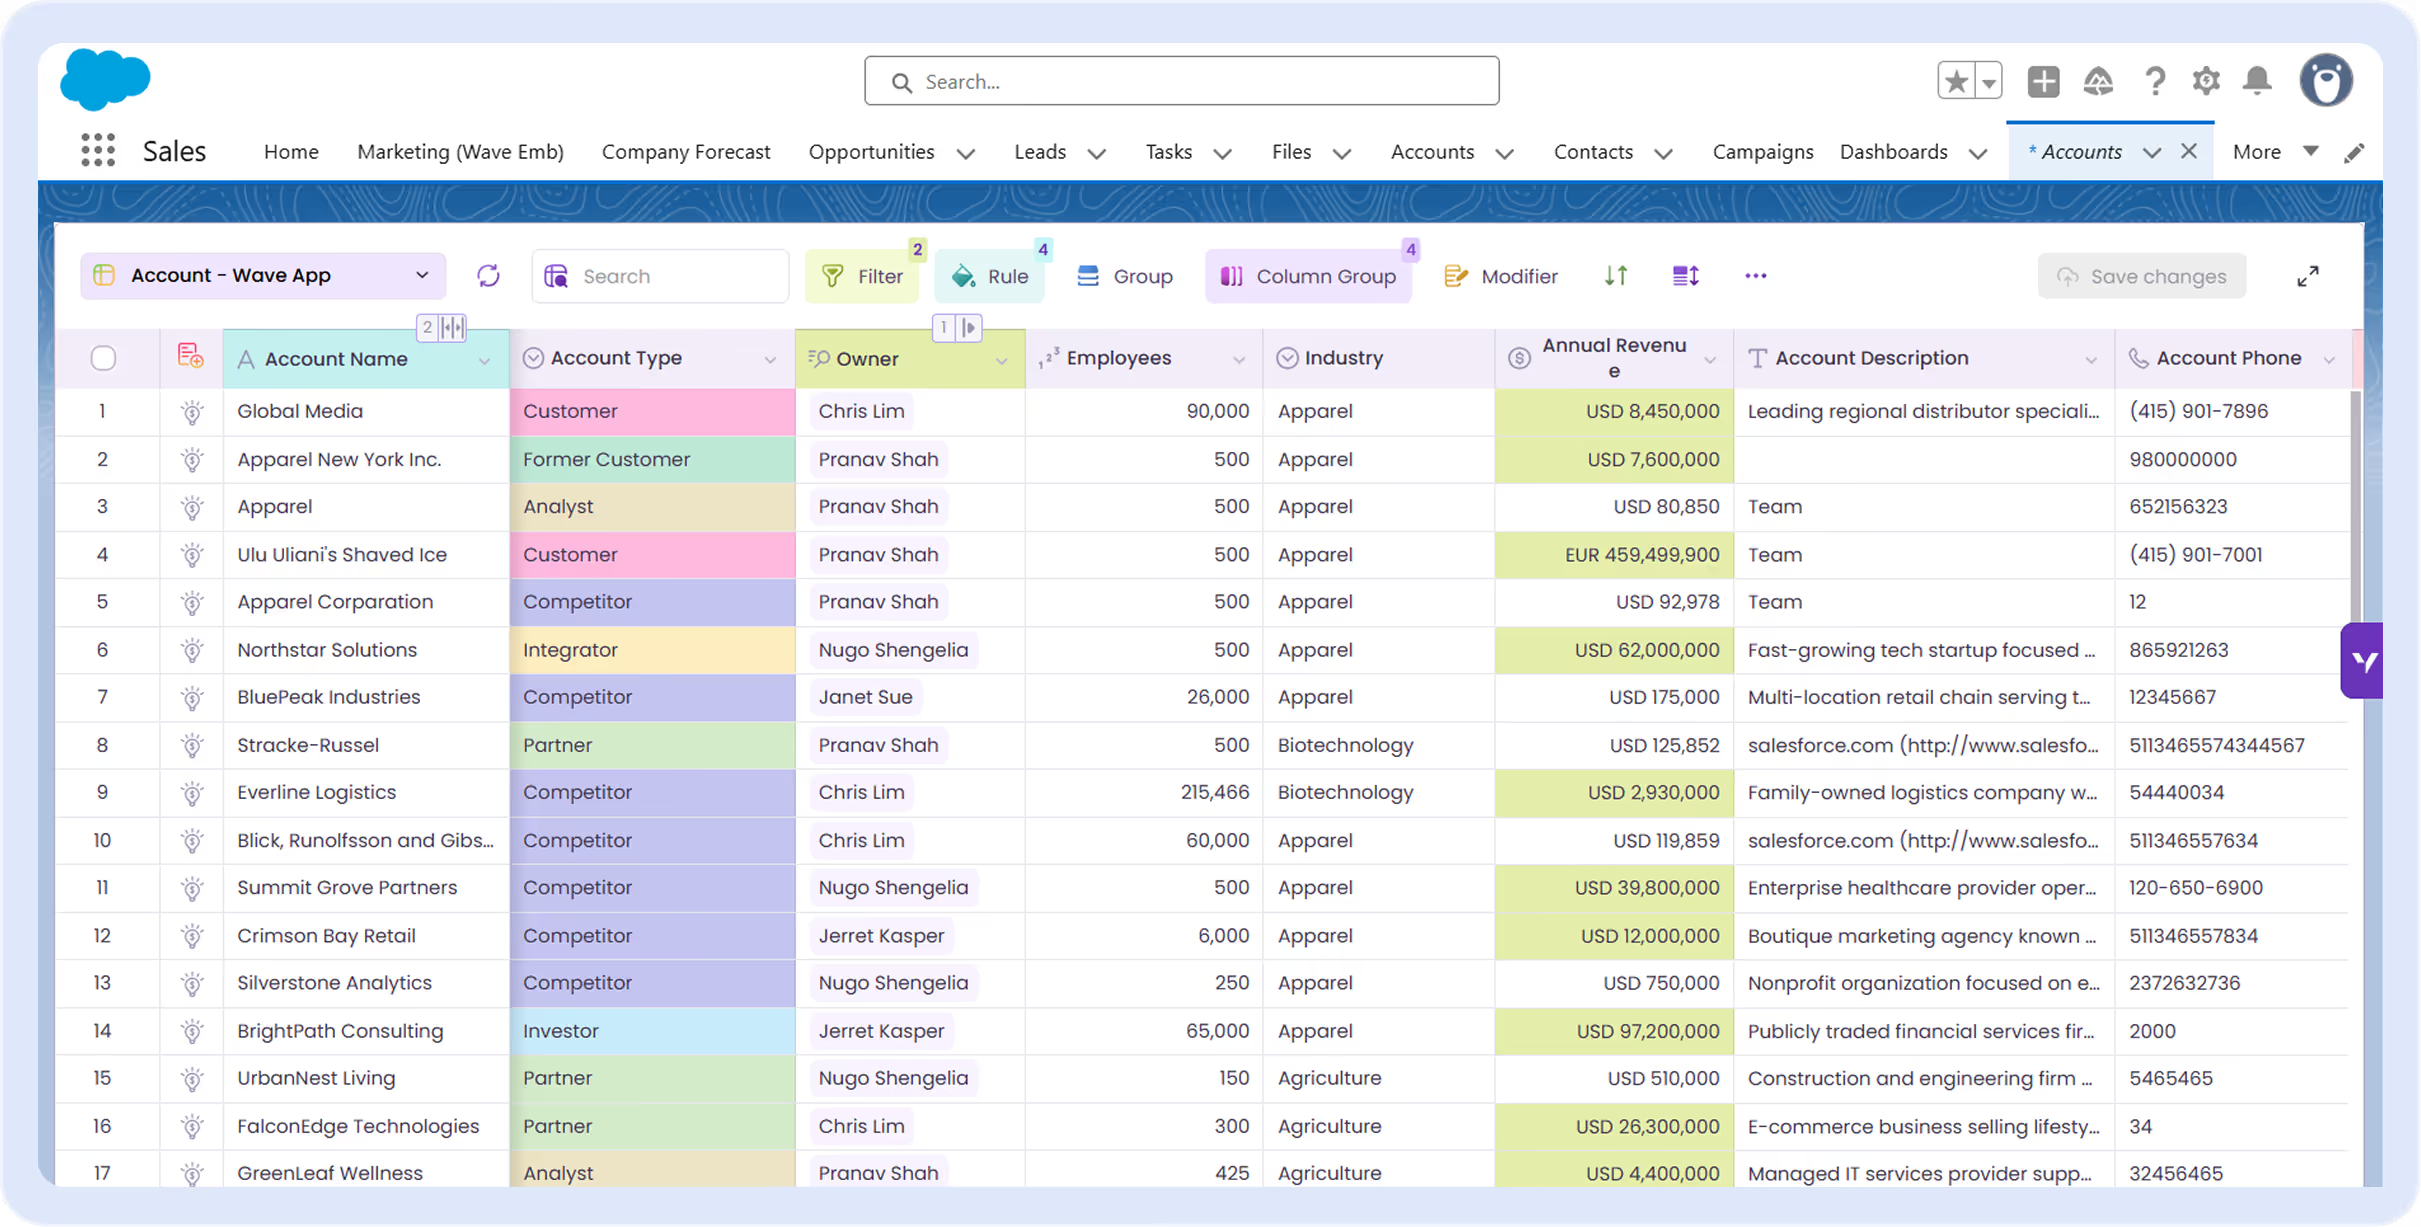
Spot low stock instantly
Conditional formatting highlights items below thresholds. Red for critical, yellow for warning.
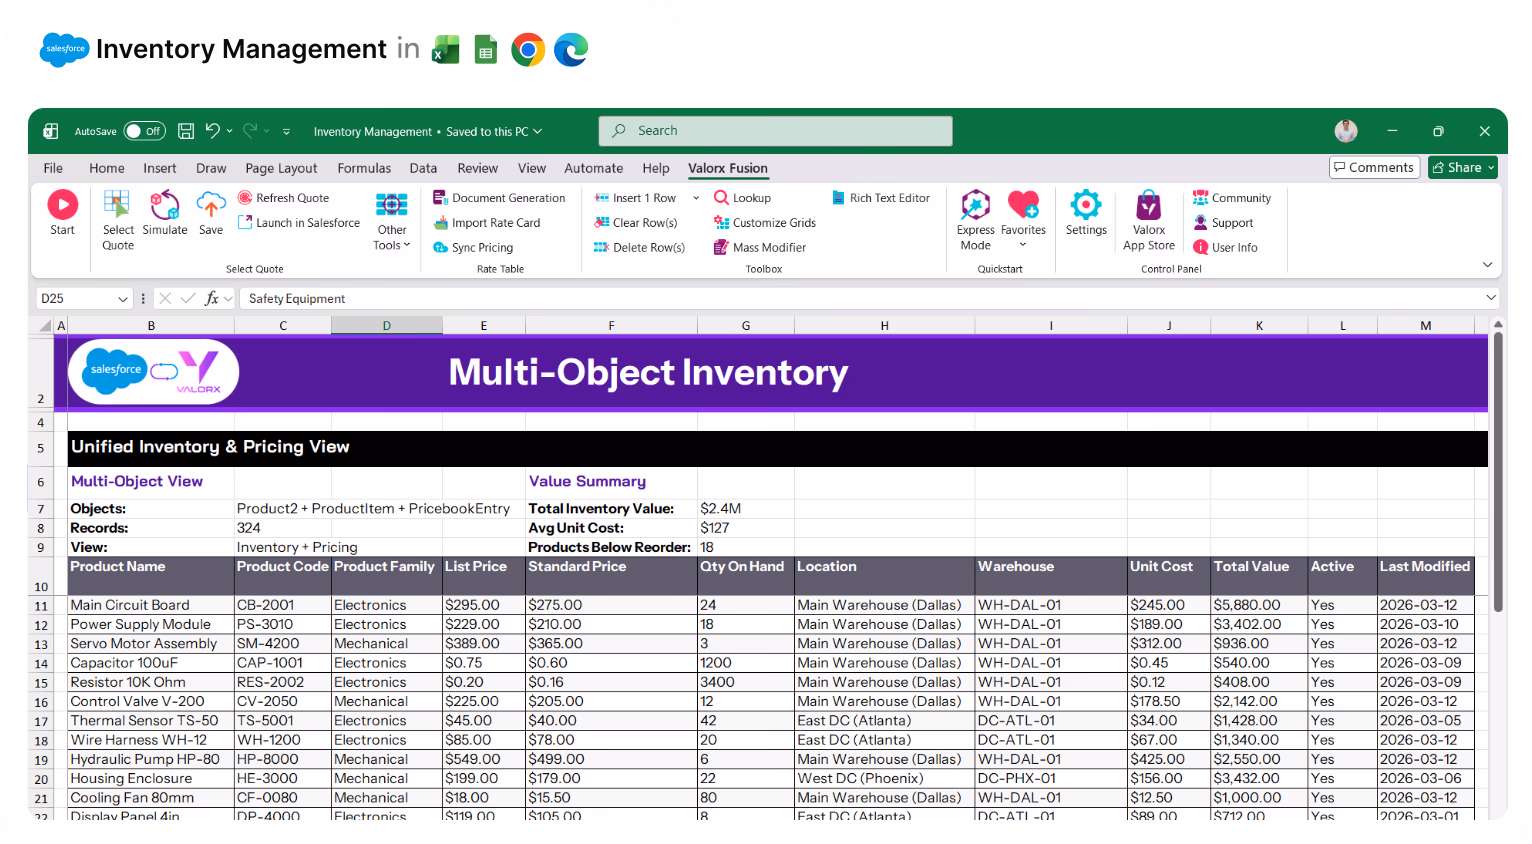
Manage multiple objects together
Products, pricebooks, and stock levels—all in one view instead of jumping between tabs.
Real results from enterprise teams
Book a demo
1000 s
of stock updates in minutes
100 %
data stays in Salesforce
0
failed imports

See what Valorx adds to Salesforce inventory management
Salesforce tracks inventory. Valorx makes it manageable.
Without Valorx
Edit stock levels one record at a time
Inventory data scattered across locations
Low stock identified in reports
BOM components across separate records
With Valorx
Bulk update hundreds of ProductItems at once
All locations visible in one grid
Low stock highlighted in the grid
Parent products + components in one view

Built for teams managing inventory in Salesforce

Field Service
Van stock, parts consumption, technician inventory.

Manufacturing
Bill of materials, raw materials, finished goods, multi-warehouse.

Healthcare
Medical supplies, device tracking, expiration dates

Distribution
Multi-location warehouses, bulk stock updates.
Retail
Store inventory, replenishment, stock balancing.
Two ways to manage inventory in Salesforce
Choose the approach that fits your workflow.