Wave Matrix for Salesforce Forecasting

Forecast every product by day, week, month, quarter or year, on one editable screen. Save once and Salesforce is updated.
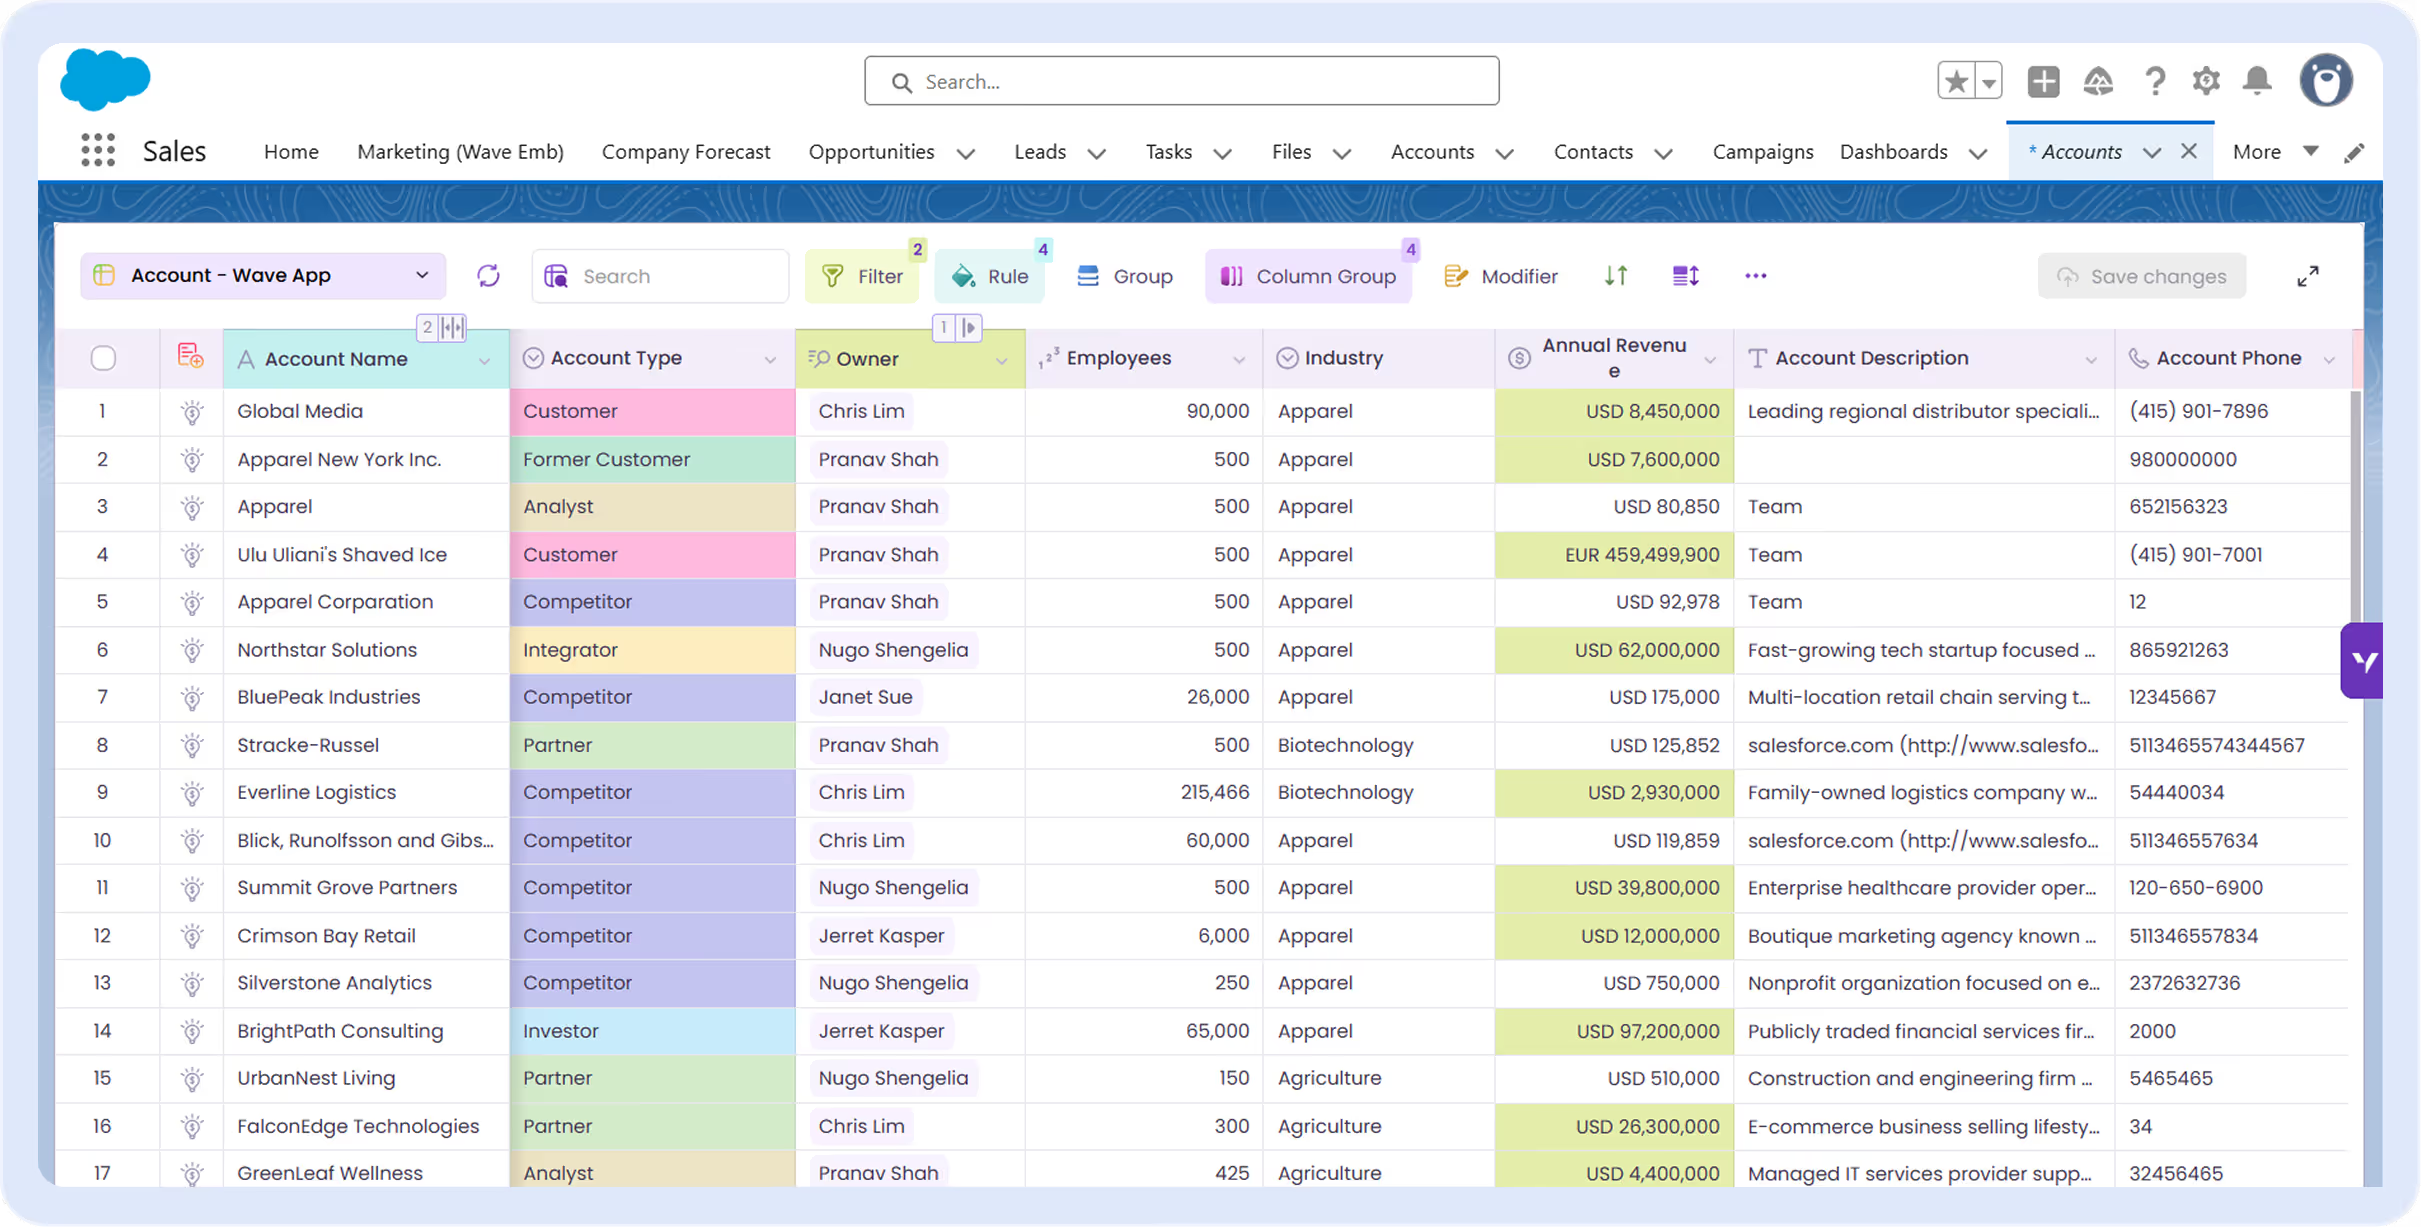
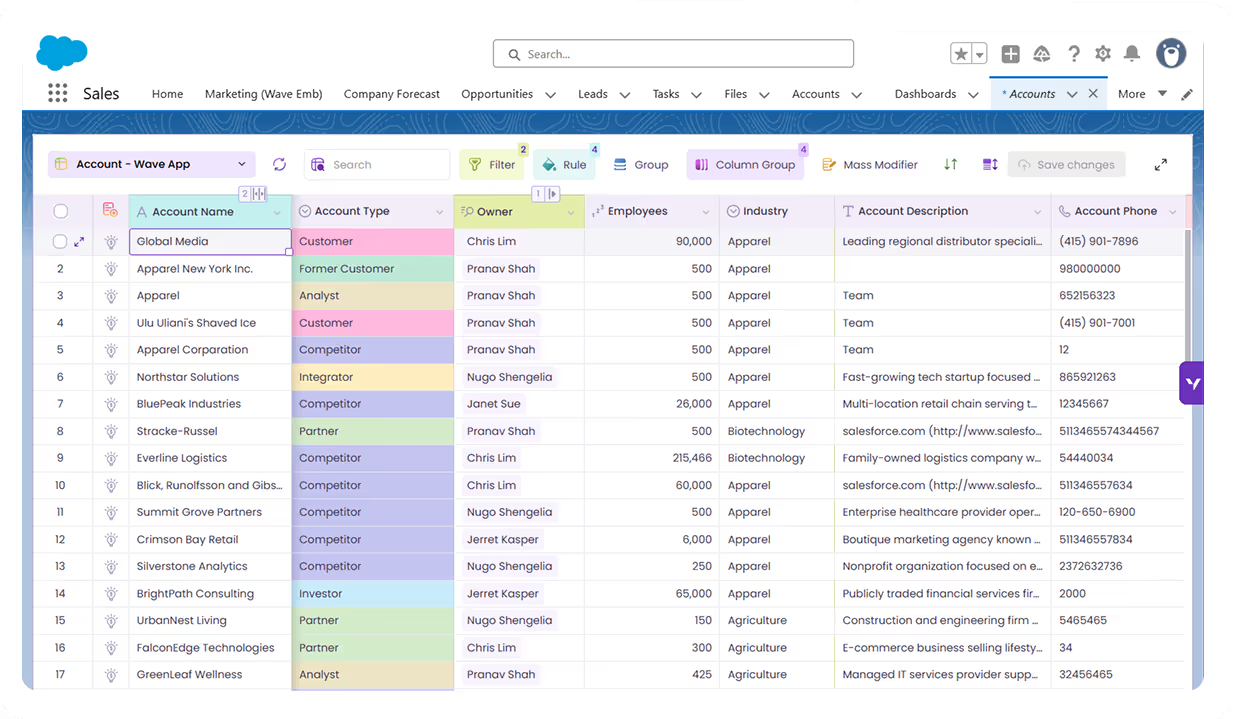
Sales dashboard showing company accounts with columns for account name, type, owner, employees, industry, revenue, and phone.

Wave AI inside Salesforce: a prompt on the Wave AI home screen builds a grid of 3M's 1,074 open opportunities with stages colored from early to late.
HOW IT WORKS

How a Wave Matrix is built

Pick the objects, anchor the rows, choose the timeline.

Before: a Salesforce list of opportunities, edited one at a time. After: Wave AI moves the close date on 549 overdue deals in one reviewed change.

One object, every period on one screen

A single-object matrix turns records like product schedules into rows, with days, weeks, months, quarters or years across.

Before: a Salesforce dashboard snapshot as of 12:09 PM. After: a live Wave AI pipeline dashboard where a click on the Discovery bar opens the 55 deals behind it.

Accounts, agreements and products in one grid

A multi-object matrix joins up to three related objects, so every row carries the account, the agreement and the product.

Before: a Salesforce pipeline report with no way to test a slip. After: Wave AI shows what happens if the three biggest deals slip, with a before and after dashboard and the three deals highlighted in a grid.

Anchor fields to triangulate the forecast

Anchor rows on account, category and product. Each forecast sits where they meet, next to the manager's adjustment, so you can check it from every side.

Before: the Salesforce edit form for a single opportunity. After: one sentence to Wave AI moves the close date on the five biggest deals, reviewed before it saves.

Days, weeks, months, quarters or years

Switch the timeline in one click and every total rolls up, on your fiscal or calendar year.
Before: a Salesforce list of opportunities, edited one at a time. After: Wave AI moves the close date on 549 overdue deals in one reviewed change.
Before: a Salesforce dashboard snapshot as of 12:09 PM. After: a live Wave AI pipeline dashboard where a click on the Discovery bar opens the 55 deals behind it.
Before: a Salesforce pipeline report with no way to test a slip. After: Wave AI shows what happens if the three biggest deals slip, with a before and after dashboard and the three deals highlighted in a grid.
Before: the Salesforce edit form for a single opportunity. After: one sentence to Wave AI moves the close date on the five biggest deals, reviewed before it saves.
FORECASTING

Forecasting with Wave Matrix

From account plans to revenue schedules, planned where the data lives.

Account-based forecasting

Forecast, actuals and backlog for every product of an account, period by period.
Get Demo
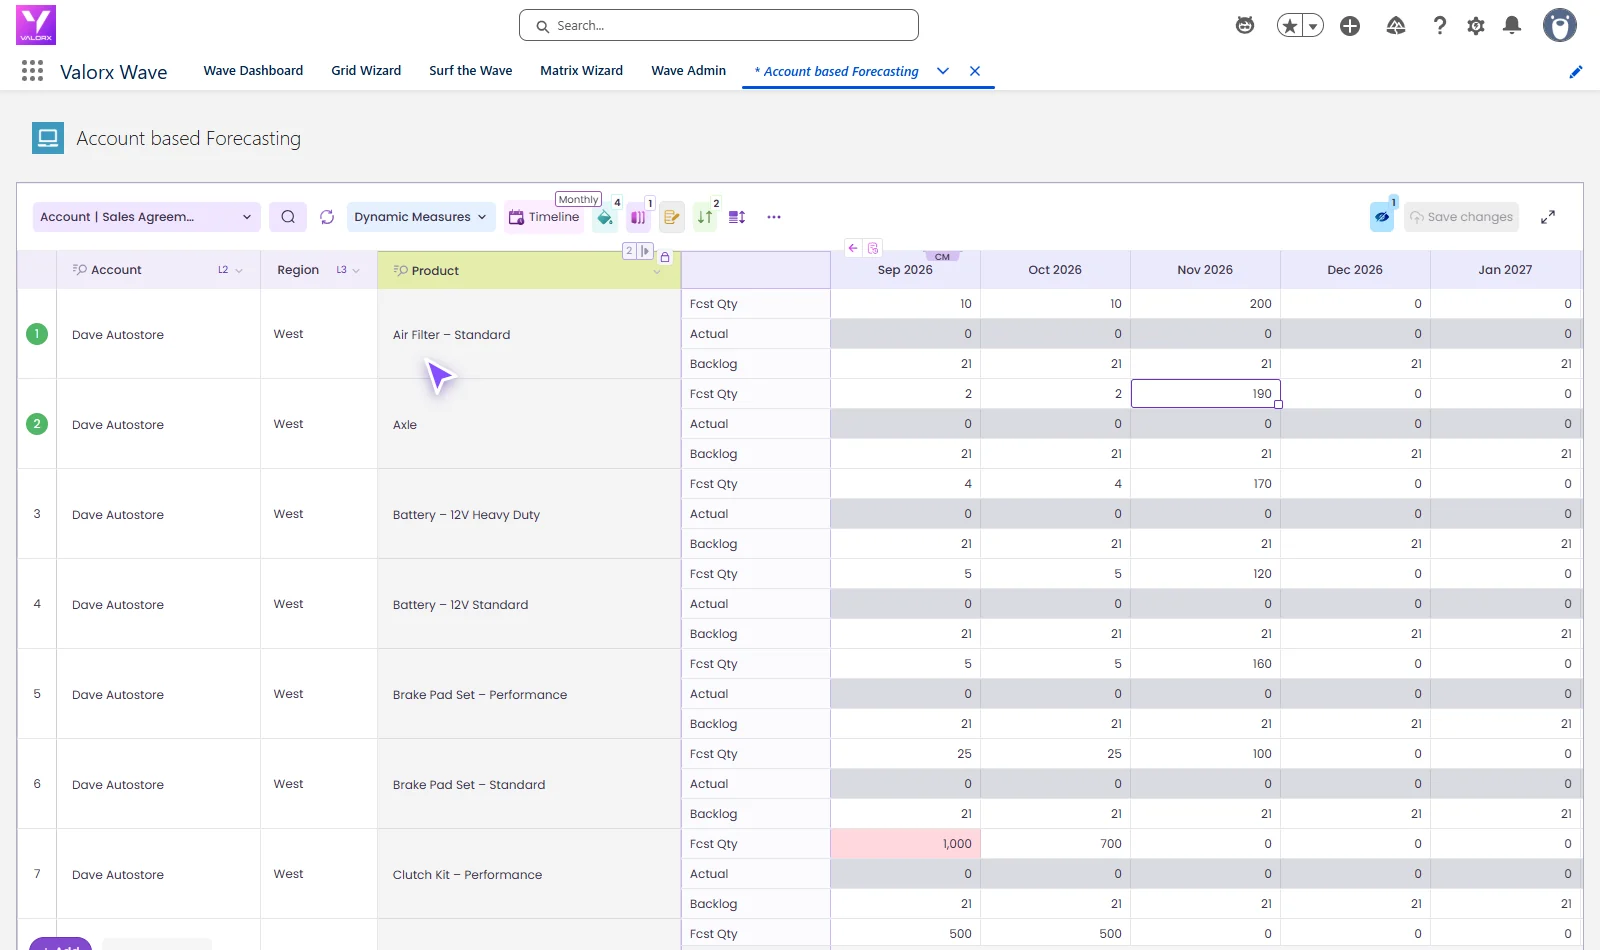
Valorx Wave Matrix showing forecast, actual and backlog quantities for every Dave Autostore product by month.

Pick the measures you plan with

Show or hide forecast, actuals, price, discount, backlog and upside from one list.
Get Demo
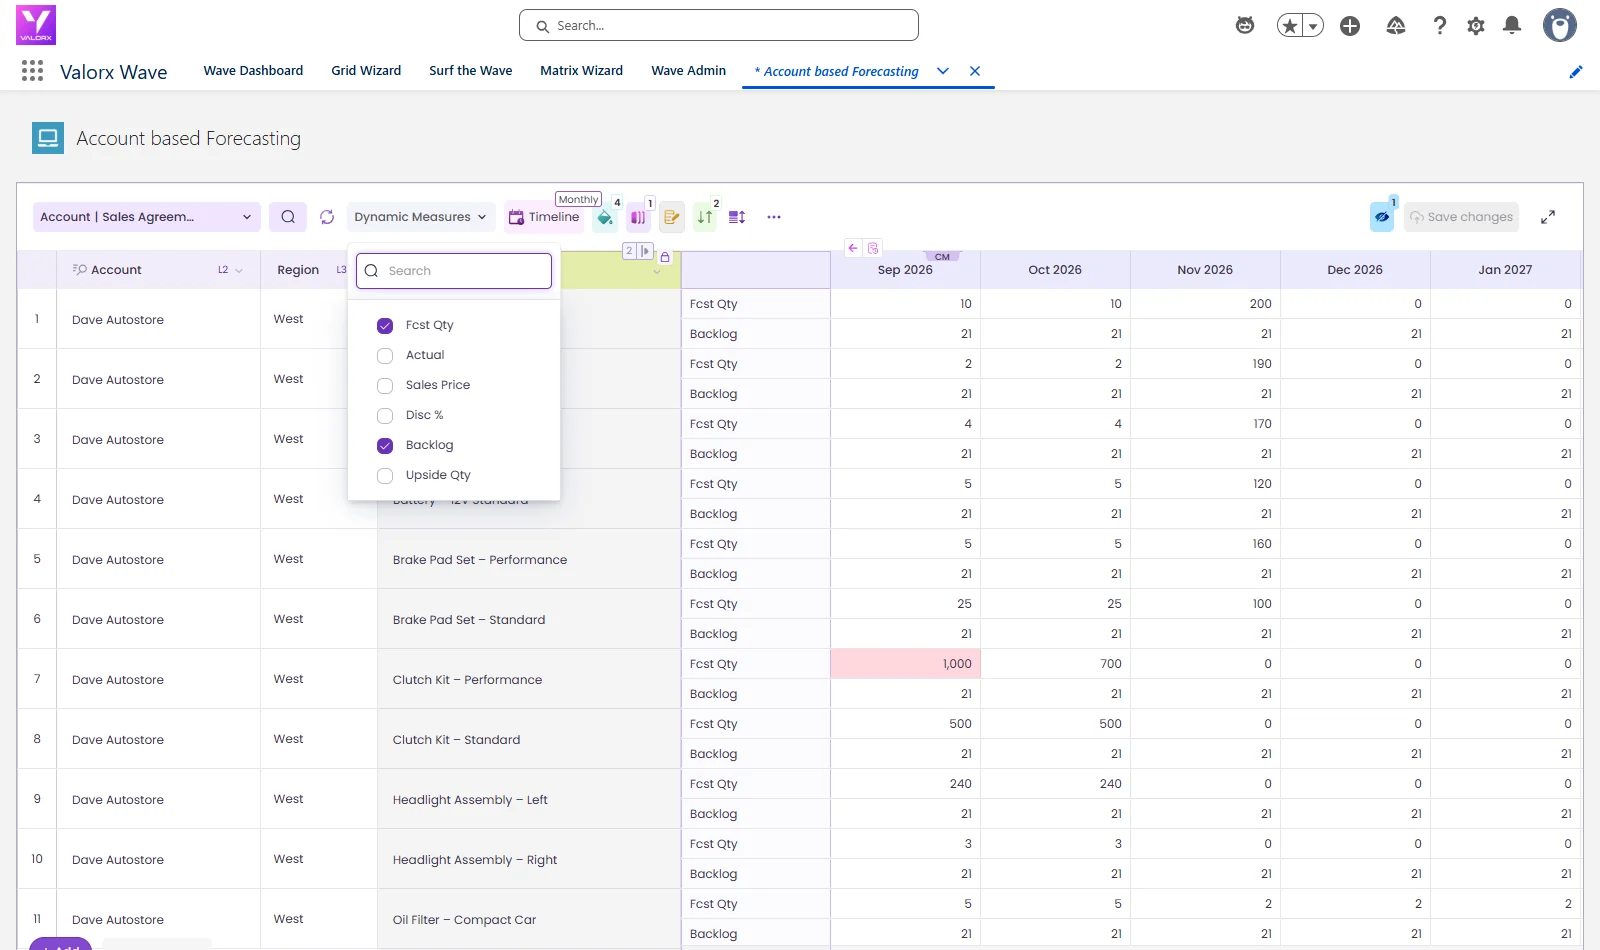
The Dynamic Measures list in Valorx Wave Matrix with forecast, actual, sales price, discount, backlog and upside quantity.

Change a total, Wave spreads it

Edit a combined number and Wave spreads it across the records beneath it, by weight or evenly. One save updates them all.
Get Demo
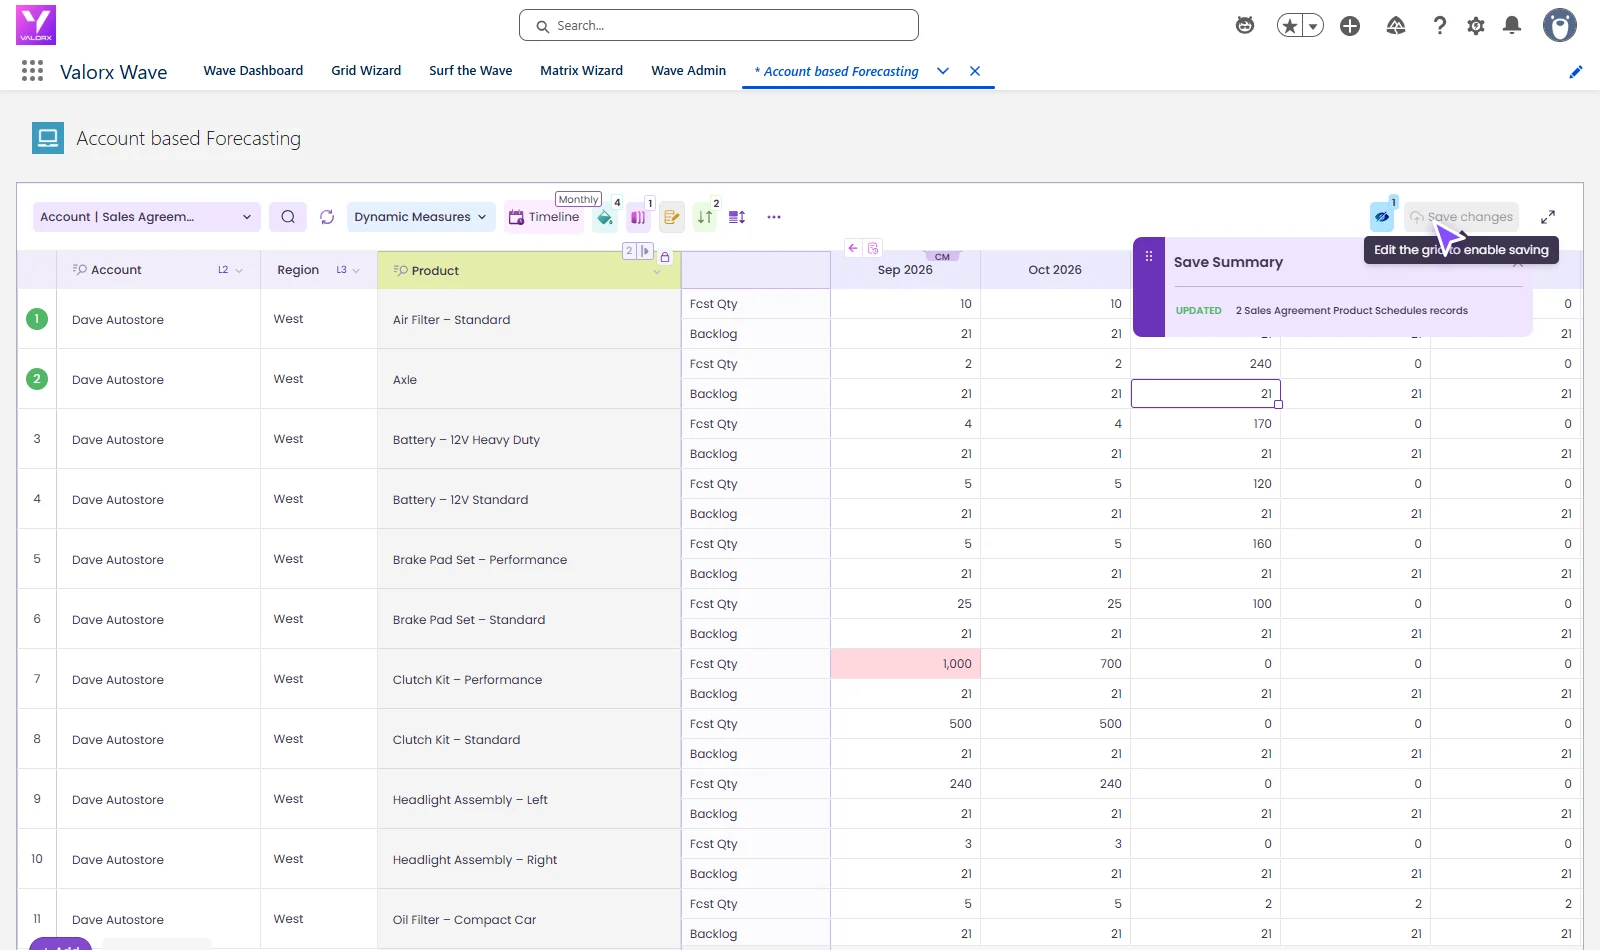
The Valorx Wave Matrix save summary after two forecast changes were written back to Salesforce sales agreement product schedules.

Open the record behind any number

The detail view shows the schedule behind a cell, ready to edit in place.
Get Demo
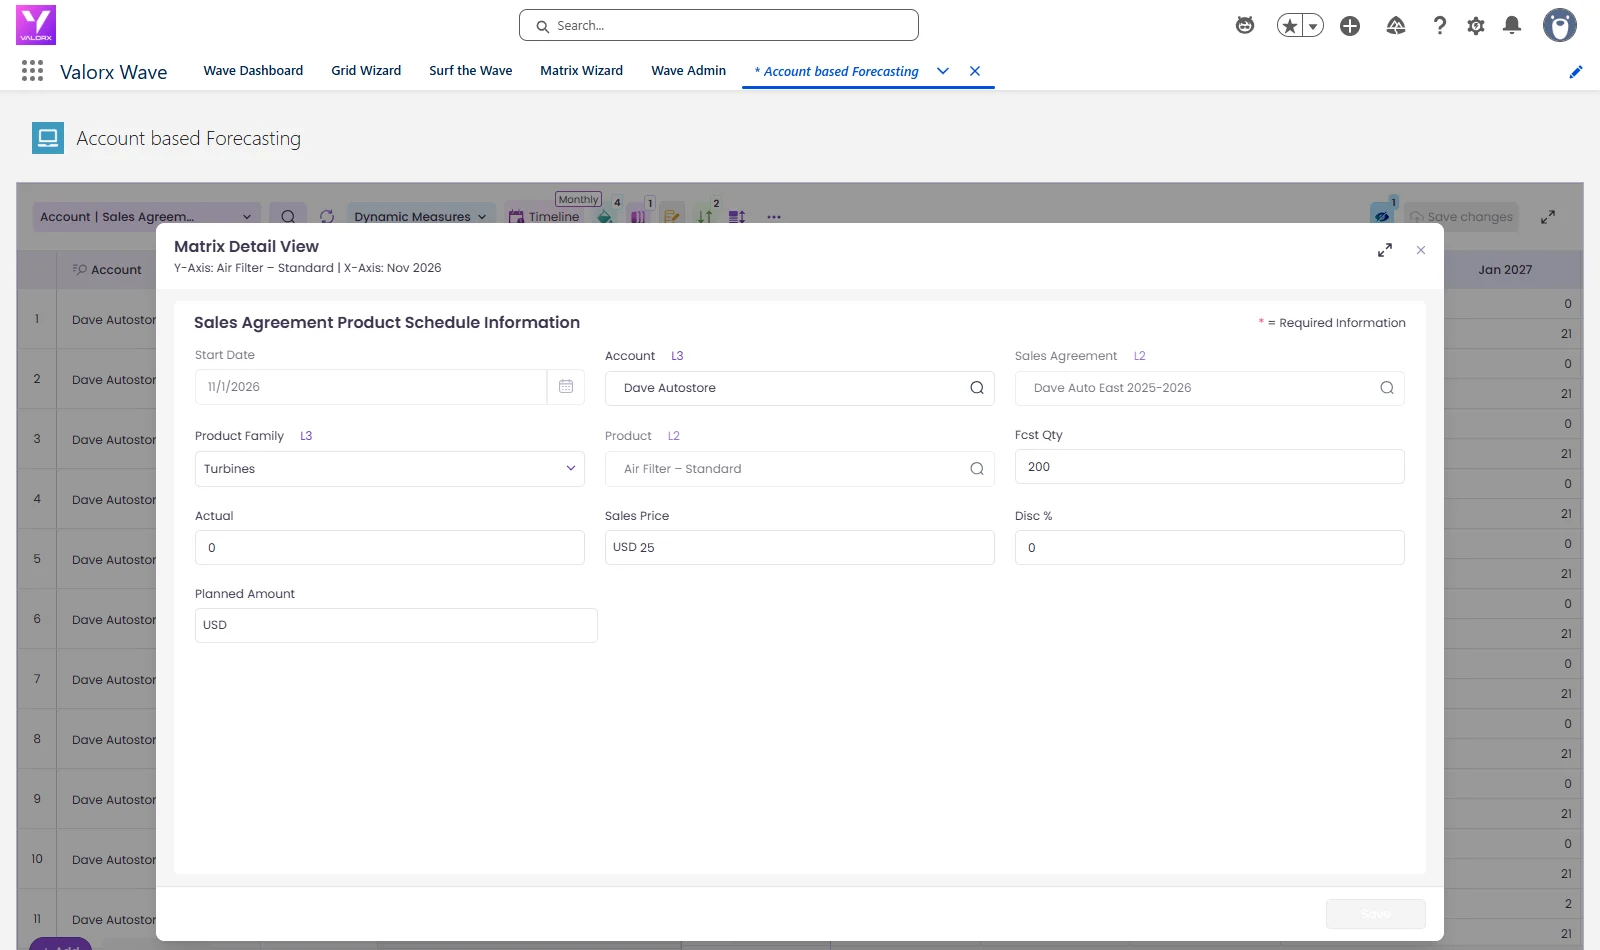
The Matrix Detail View in Valorx Wave showing the sales agreement product schedule behind one forecast cell.

Plan on your own calendar

Straight-line or rolling timelines on your fiscal or calendar year, from exact dates to years.
Get Demo
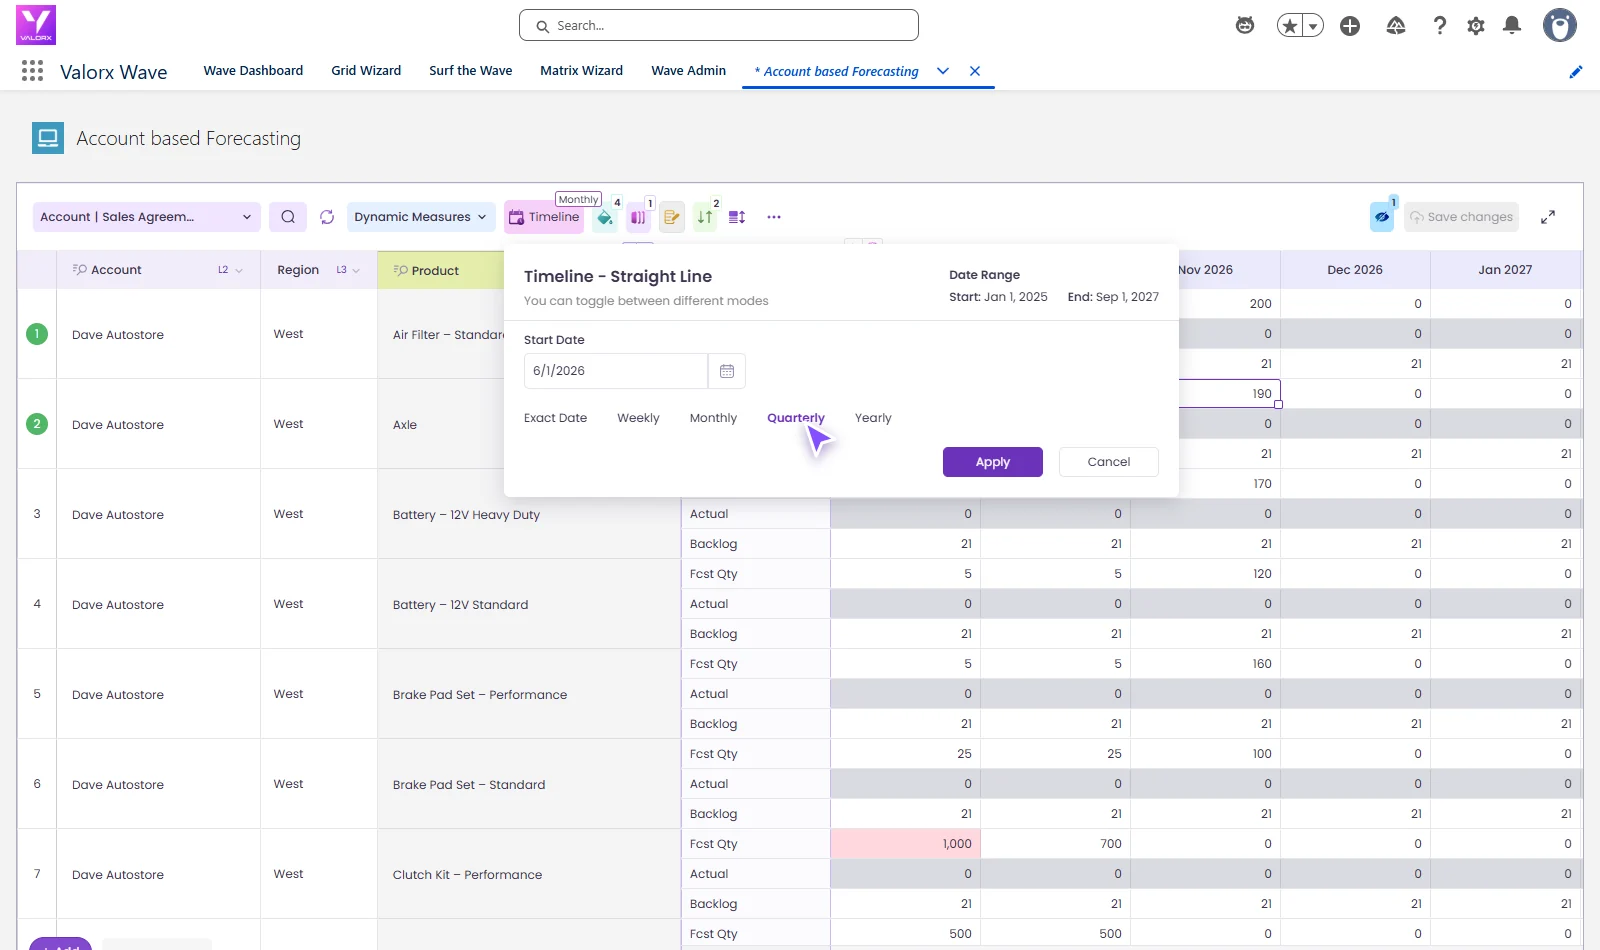
Valorx Wave Matrix timeline settings with a start date, date range and exact date, weekly, monthly, quarterly and yearly views.

CMC forecasts in Salesforce, not spreadsheets

Read the CMC story

75%

less time on the monthly forecast cycle

10x

faster forecast updates in Salesforce

3

objects joined in one matrix

Abstract soft pastel-colored gradient background with blurred lavender, blue, and pink hues.

What changes when you add Valorx to Salesforce

Salesforce stores the forecast. Valorx is where you plan it.
Without Valorx
One product's schedule at a time
Forecasts rebuilt in spreadsheets every month
Reports you can read but not edit
One row per period, no week, quarter or year view
With Valorx
Every product and period on one screen
Plan in Salesforce, nothing exported
Edit numbers where you see them, save once
Days to years in one click
Smiling young man with glasses and a beard wearing a black shirt on a light gray circular background with a small purple circle in the top right.
Eric Winston
Service Supervisor
Book a demo
Soft gradient background fading from light gray to pale blue and white.

Two ways to work, one goal: better data in Salesforce

Choose the interface that fits how your team works.
Abstract purple outline of four connected circles inside a rounded square frame on a black background.
Abstract geometric logo featuring a circle above layered semicircles within a rounded square border.
Venn diagram with three overlapping purple circles on a black background.
Purple crescent shapes forming a circle on a black square background with rounded corners.
Purple outline icon of a briefcase inside a rounded square border on a black background.
Abstract black and purple geometric design with layered squares and rounded corners.
Green spreadsheet file icon representing an Excel document on a light background.
Abstract black and purple geometric design with layered squares and rounded corners.
Smiling young man with glasses and a beard wearing a black shirt on a light gray circular background with a small purple circle in the top right.
Eric Winston
Service Supervisor
Book a demo
Icon with three nested rectangles inside a rounded square outline, representing a scaling or resizing concept.
Microsoft Excel app icon with an overlapping white X on a green abstract background.
Purple geometric icon with three nested diamond shapes on a black background.
Three purple abstract human figures representing a group or team on a light background.
Icon with three stacked rounded rectangles in purple outline on a black background.
Abstract purple outline of four connected circles inside a rounded square frame on a black background.
Icon showing four interconnected circles forming a square with a horizontal line extending from the right circle.
Google Chrome web browser logo.
Salesforce logo with white text inside a blue cloud shape.
Abstract geometric design with multiple rounded squares outlined in purple on a black background.
Purple circular abstract icon with overlapping partial rings on a black square background with rounded corners.
Three overlapping purple circles forming a triangular Venn diagram on a black background.
Abstract geometric logo featuring a circle above layered semicircles within a rounded square border.