Why finance and sales forecasts don't match in manufacturing

Sales and finance forecasts rarely match in manufacturing because they measure different things. Sales forecasts customer demand, often at standard pricing and including demand that is not yet contracted. Finance forecasts the net revenue it expects to recognize in the period, after weighting uncommitted demand, applying negotiated pricing and rebates, and timing shipments. The fix is not one number. It is a labeled bridge between the two numbers, built on the same live Salesforce data.
- Sales and finance forecasts rarely match because sales forecasts customer demand and finance forecasts recognizable net revenue.
- The gap comes from six places: units vs dollars, committed vs probable demand, gross vs net revenue, time horizon, granularity, and update cadence.
- A good S&OP meeting does not force one number. It shows a bridge from sales demand to the finance forecast, with every adjustment labeled.
- Most reconciliation time goes on moving data between systems, not on debating assumptions.
- Connecting Manufacturing Cloud data live to finance's Excel models removes the export step, so S&OP time goes to assumptions.
Every S&OP meeting tells the same story. Sales presents a quarterly forecast built from customer conversations, account plans, and sales agreements. Finance presents a revenue projection built from historical conversion, pricing terms, and budget constraints.
Sales says $12M. Finance says $9.3M.
That $2.7M is not rounding error, and usually neither team is wrong. They are looking at the same business through different lenses, in different systems, using the same words to mean different things.
In manufacturing, the gap has real consequences: excess inventory when operations builds to the high number, stockouts and longer lead times when it builds to the low one, and leadership that cannot say where the business stands. Below, we break down where the gap comes from and how to turn it into something both teams can sign off on.
Six reasons sales and finance forecasts diverge
1. Units vs dollars
Sales thinks in volume: "Customer X will take 10,000 units of the pump family this quarter." Finance needs revenue: which SKUs, at what price tier, after which rebates?
In Salesforce Manufacturing Cloud, account forecasts are typically built by product or product family and period, and the dollar value often assumes list or standard pricing. Finance knows this customer has negotiated pricing and a volume rebate that will take points off that number. The sales forecast can be accurate on demand and still not be the number finance needs.
2. Committed vs probable demand
Manufacturing Cloud separates two kinds of demand:
- Sales agreements capture contracted volumes and prices a customer has committed to over a term.
- Account forecasts roll up expected demand from sources such as orders, opportunities, and sales agreements, depending on how your forecast sets are configured.
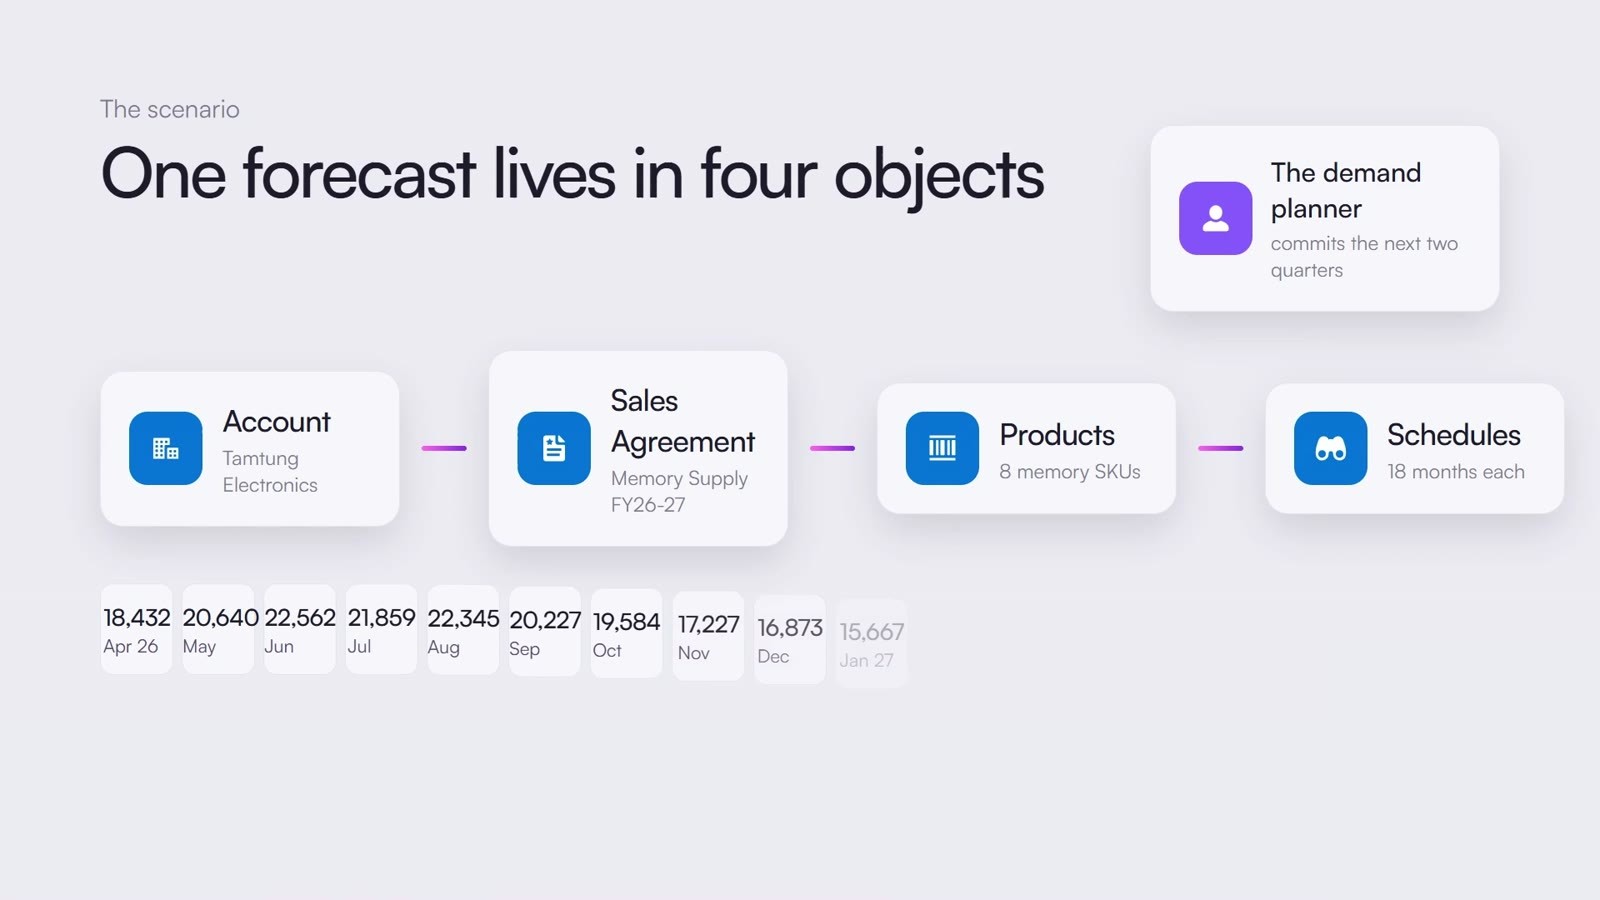
Sales often presents the total as one confident number: "$8M is under agreement, and we are confident about another $4M."
Finance treats the two differently. Volume under agreement goes into the forecast at close to full value. Opportunity-driven demand gets weighted by historical conversion. If 60 percent of that kind of demand has typically turned into orders, the $4M becomes $2.4M in finance's model.
Same pipeline, different math. That alone takes $12M to $10.4M.
3. Gross vs net revenue
A rep forecasting a $500K deal is thinking top line. Finance is working out what will actually hit the income statement:
- List value: $500K
- Negotiated discount: minus $50K
- Volume rebate accrual, if the customer hits its annual target: minus $25K
- Expected returns: minus $10K
- Net value: $415K
Then timing. Revenue on manufactured goods is generally recognized when control transfers to the customer, usually at shipment. If this order ships in three roughly equal deliveries across three quarters, only about $138K lands this quarter.
The rep's $500K and finance's $138K are both right. They answer different questions.
4. Time horizon
Sales forecasts focus on this quarter and maybe the next. Finance maintains a rolling 12-month forecast that feeds production planning, capital allocation, and board reporting, so it needs a view of Q3 and Q4 before sales has built that pipeline.
So finance extrapolates from history while sales works from live customer signals. By the time sales has Q3 visibility, the budget may already be locked.
5. Granularity that does not translate
Sales forecasts by account: "Acme will order $2M, GlobalTech $1.5M." Finance rolls up by product family, region, and business unit: "How much pump revenue in North America, and how does it compare to Q3 last year?"
Every time finance asks for the forecast re-sliced by product line, someone exports, reshapes, and pastes. It takes hours, and the result never quite ties back to the source.
6. Live demand signals vs a static plan
Sales hears about changes weekly. GlobalTech is pulling orders forward because a competitor has supply problems. Acme is pushing out because a funding round slipped. Those signals land in Salesforce within days.
Finance's model often updates monthly, against a budget set months earlier. By the time a customer signal reaches the financial plan, the chance to act on it may have passed. For more on that lag, read our guide to demand sensing vs demand forecasting.
Build the bridge, not a second number
The way out is not to force sales into finance's model, or to ask finance to accept sales' gut calls. It is to make the path from one number to the other explicit, with every step labeled. Using the example above:
| Step | Adjustment | Running total |
|---|---|---|
| Sales forecast (customer demand) | $12.0M | |
| Opportunity demand weighted at 60% historical conversion | minus $1.6M | $10.4M |
| Negotiated pricing and volume rebate accruals | minus $0.5M | $9.9M |
| Shipments scheduled after quarter end | minus $0.6M | $9.3M |
| Finance forecast (recognizable net revenue) | $9.3M |

Every row is an assumption you can test. Maybe 60 percent conversion is too low for this product family this year. Maybe a rebate tier will not be reached. The disagreement becomes productive because both teams can point at the same row.
The bridge only works if both sides build it from the same data. That is where most teams get stuck.
Why reconciliation eats the first week of every month
The usual process is painful. Export forecasts and sales agreements from Salesforce, paste them into finance's workbook, reshape them by product family, apply adjustments, compare, then email questions back and forth. Meanwhile sales keeps updating Salesforce.
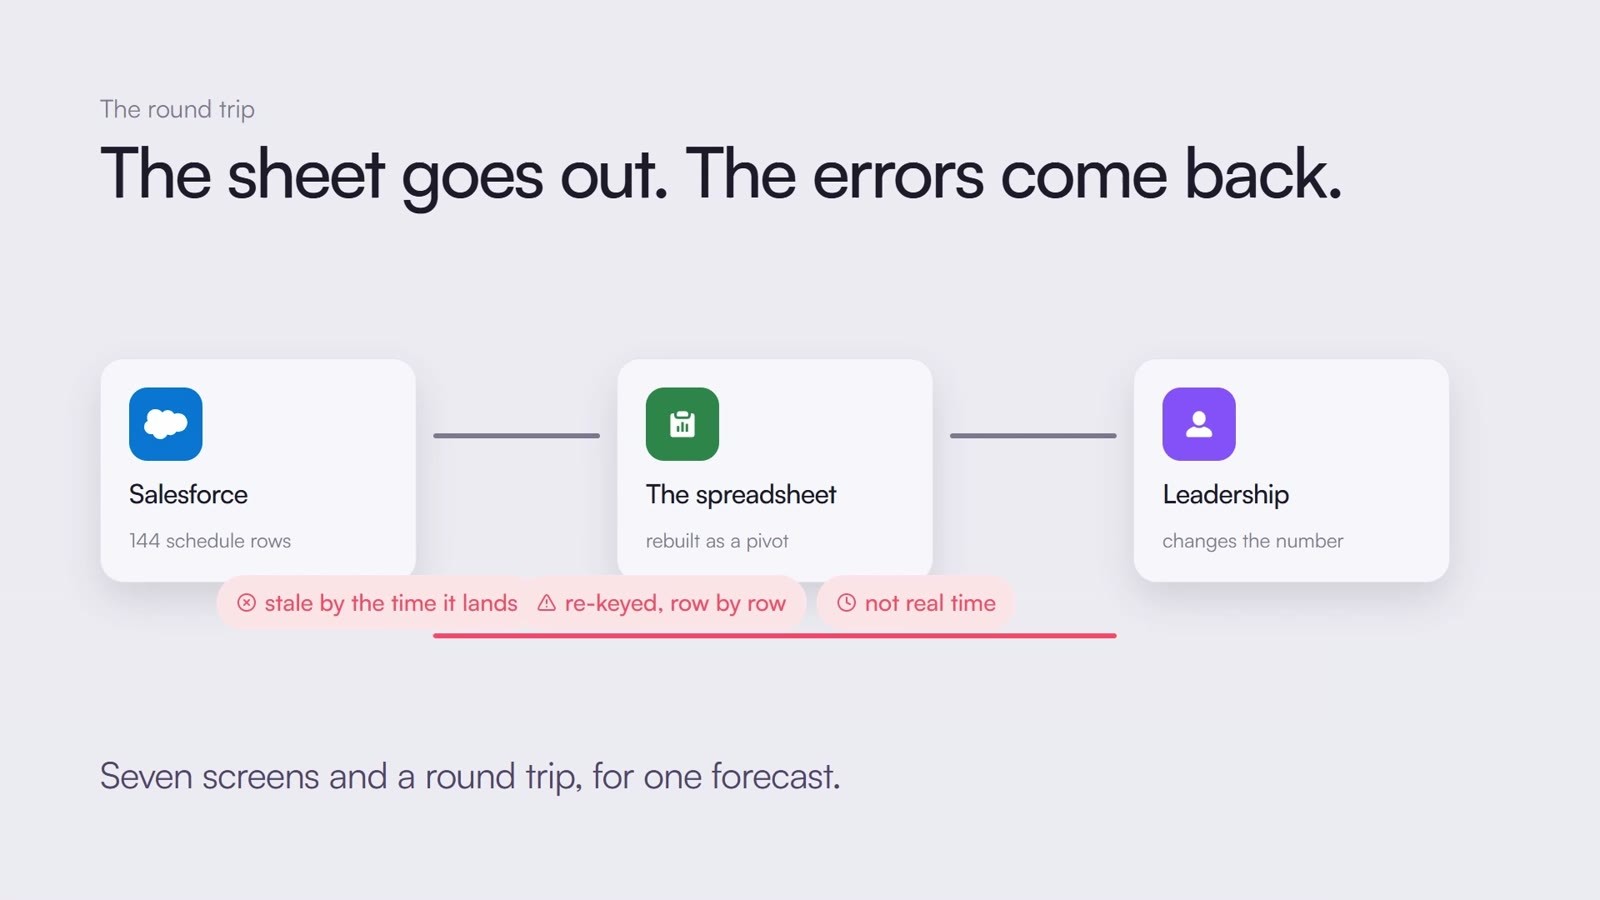
By the time the reconciliation is done, both forecasts have moved. Finance spends its time checking whether the data is current instead of testing assumptions. And because finance's working copy lives outside Salesforce, it quietly becomes a parallel system that nobody in sales can see.
Process design matters too: who owns which number, when adjustments lock, and how the bridge is reviewed. Our guides to collaborative forecasting and mapping S&OP to Manufacturing Cloud cover that side. But no process survives if every cycle starts with a stale export.
Connect finance's Excel models to Manufacturing Cloud
Finance teams build their models in Excel for good reasons. Formulas, scenario modeling, and bridge logic are faster there than anywhere else. The problem is not Excel. It is the copy of Salesforce data inside it.
Valorx Fusion connects Excel directly to Salesforce, so the data in finance's model is live instead of exported:
- Live Salesforce data in Excel. Pull the records your forecast depends on, including Manufacturing Cloud sales agreements, account forecasts, and opportunities, without an export.
- Keep your existing models. Point the workbook finance already trusts at live data instead of rebuilding it in a new tool.
- Apply the bridge in Excel. Conversion weights, rebate accruals, and timing adjustments stay as formulas finance controls.
- Save back to Salesforce. Fusion is bidirectional, so forecast updates made in Excel can be saved back to Salesforce, within your users' Salesforce permissions.
Try it in this interactive demo: load accounts by region into Excel, update quarterly forecasts from sales agreements and opportunities with formulas, and save them back to Salesforce.
Forecast 360 in Excel: sales agreement and opportunity forecasts on a rolling basis, saved back to Salesforce.
When sales updates a forecast in Manufacturing Cloud, finance refreshes the model and works from the current figure. The gap between the two numbers is still there, as it should be. Now it is explained by the bridge, not by stale data.
The S&OP conversation changes
When both teams work from connected data, the meeting sounds different.
Instead of: "Your number is $12M, ours is $9.3M. Who is wrong?"
It becomes: "We agree on $12M of customer demand. Finance is weighting $4M of opportunity demand at 60 percent, accruing $0.5M of rebates, and moving $0.6M of shipments into next quarter. Here is the bridge."
That is a conversation about assumptions, not a fight over numbers. To see how other manufacturers run this cycle, watch our S&OP in Manufacturing Cloud webinar.
Start with one account
You do not need to overhaul planning to close the gap. Pick one high-value account with both sales agreements and opportunity-driven demand. Connect its Manufacturing Cloud data to finance's model, build the bridge for one quarter, and walk it through your next S&OP review.
If the conversation goes faster, extend the approach to the next product family.
Put live Manufacturing Cloud data in your finance models
See how Fusion connects Salesforce forecasts, sales agreements, and opportunities to the Excel models your finance team already uses. We will walk through it on your own forecast setup.
See Fusion in action →Frequently asked questions
Why do sales and finance forecasts differ in manufacturing?
They measure different things. Sales forecasts expected customer demand, often at list or standard pricing. Finance forecasts net revenue it expects to recognize in the period, after weighting uncommitted demand, applying negotiated pricing and rebates, and timing shipments.
Should sales and finance forecasts ever be the same number?
Usually not. A healthy process keeps both numbers and agrees on the bridge between them. The goal is that every difference is explained by a labeled assumption, not by stale or mismatched data.
What is the difference between a sales agreement and an account forecast in Manufacturing Cloud?
A sales agreement records a customer's committed volumes and prices over a term. An account forecast projects expected demand for an account by product and period, and can draw on orders, opportunities, and sales agreements depending on configuration.
How do rebates affect the revenue forecast?
Volume rebates are usually estimated and accrued as a reduction of revenue, so finance forecasts net revenue below the gross deal value. Sales forecasts typically show the gross figure.
Can finance keep using Excel if sales forecasts in Salesforce?
Yes. With Valorx Fusion, finance's Excel models pull live Salesforce data, including Manufacturing Cloud sales agreements and opportunities, and can save forecast updates back to Salesforce. Finance keeps its models, and there are no exports to reconcile.






Choose the workflow you need:
Try Wave in browser Extension

Try Wave in Salesforce

Try Fusion In Excel

Enhancing Salesforce for industry leaders