How to simplify Salesforce forecasting without changing how your team works

Key takeaways
- Salesforce forecasting slows down because updating many records is slow, so teams export to spreadsheets and the forecast goes stale.
- Gartner research finds only 7% of sales organizations reach 90% forecast accuracy.
- The fix is to bring spreadsheet speed to live Salesforce data, not to add another tool or process.
- Valorx Wave is a spreadsheet-style grid on Salesforce data. Teams filter, bulk edit, review, and save forecast updates without exports.
- Wave works with your existing objects, validation rules, and permissions, so nothing about your Salesforce setup has to change.
- Qualcomm's sales team works from 27 active Wave grids inside Salesforce, covering pipeline and forecast updates, with zero custom code.
The forecast call is in an hour. The numbers are from last week.
Samantha runs a region of 16 reps across three time zones. It is the last week of the quarter, and she should be helping close late-stage deals.
Instead she is in a spreadsheet. She exported the pipeline on Monday, emailed reps for updates, and is now fixing close dates and amounts by hand before the call with her CRO. Three deals marked Commit have not moved in weeks. By the time her file is clean, Salesforce says something different.
Samantha is not unusual. Gartner research finds that only 7% of sales organizations reach 90% forecast accuracy, and 69% of sales operations leaders say forecasting is getting harder.
The cause is rarely effort. It is the workflow.
Why Salesforce forecasting breaks down
Salesforce holds the right data. Getting many records updated quickly is the hard part, and that is where forecasts go wrong.
- Updates happen one record at a time. Changing stage, amount, and close date on 40 opportunities means opening 40 records. Reps put it off until someone asks.
- Exports go stale the moment they are created. A spreadsheet copy of the pipeline starts drifting from Salesforce as soon as it is downloaded.
- Changes come back slowly, or not at all. Edits made in the spreadsheet have to be retyped or re-uploaded, so the CRM and the forecast deck stop matching.
- Nobody can see what changed. A file passed around by email has no validation rules, no field permissions, and no record of who edited what.
None of this is a people problem. Teams reach for spreadsheets because spreadsheets are fast. The gap is between where the data lives and where the work gets done. It widens as the team grows, which is why growing teams need more than native forecasting tools.
The exact problem: the forecast is built on a copy of Salesforce, not on Salesforce. Every export creates a second version of the pipeline, and every hour it sits in a spreadsheet, the two versions drift further apart.
The forecast gets built on a copy, not on Salesforce
Salesforce
Where the data lives
Rules, permissions, change history
Exported spreadsheet
Where the work gets done
Fast, but a copy with no rules
What a simpler forecasting workflow needs
A simpler workflow keeps the speed of a spreadsheet and removes the copy of the data. In practice that means three things:
- Spreadsheet speed. Sort, filter, fill down, and edit many rows at once.
- Live Salesforce data. Every edit lands on the real record, so there is one version of the forecast.
- Your existing rules. The same objects, validation rules, flows, and permissions you already run.
That is what we built Valorx Wave to do. Wave is a spreadsheet-style grid on your Salesforce data. You can start with the free browser version or run it inside Salesforce.
How to simplify Salesforce forecasting in five steps
Try the forecast roll-up yourself in this interactive demo, then follow the steps below.
1. Build one forecast grid on the objects you already use
Start with Opportunities and add the fields your forecast call runs on: owner, stage, amount, forecast category, close date, and next step. Wave works with standard and custom objects, so the grid follows your data model as it is.
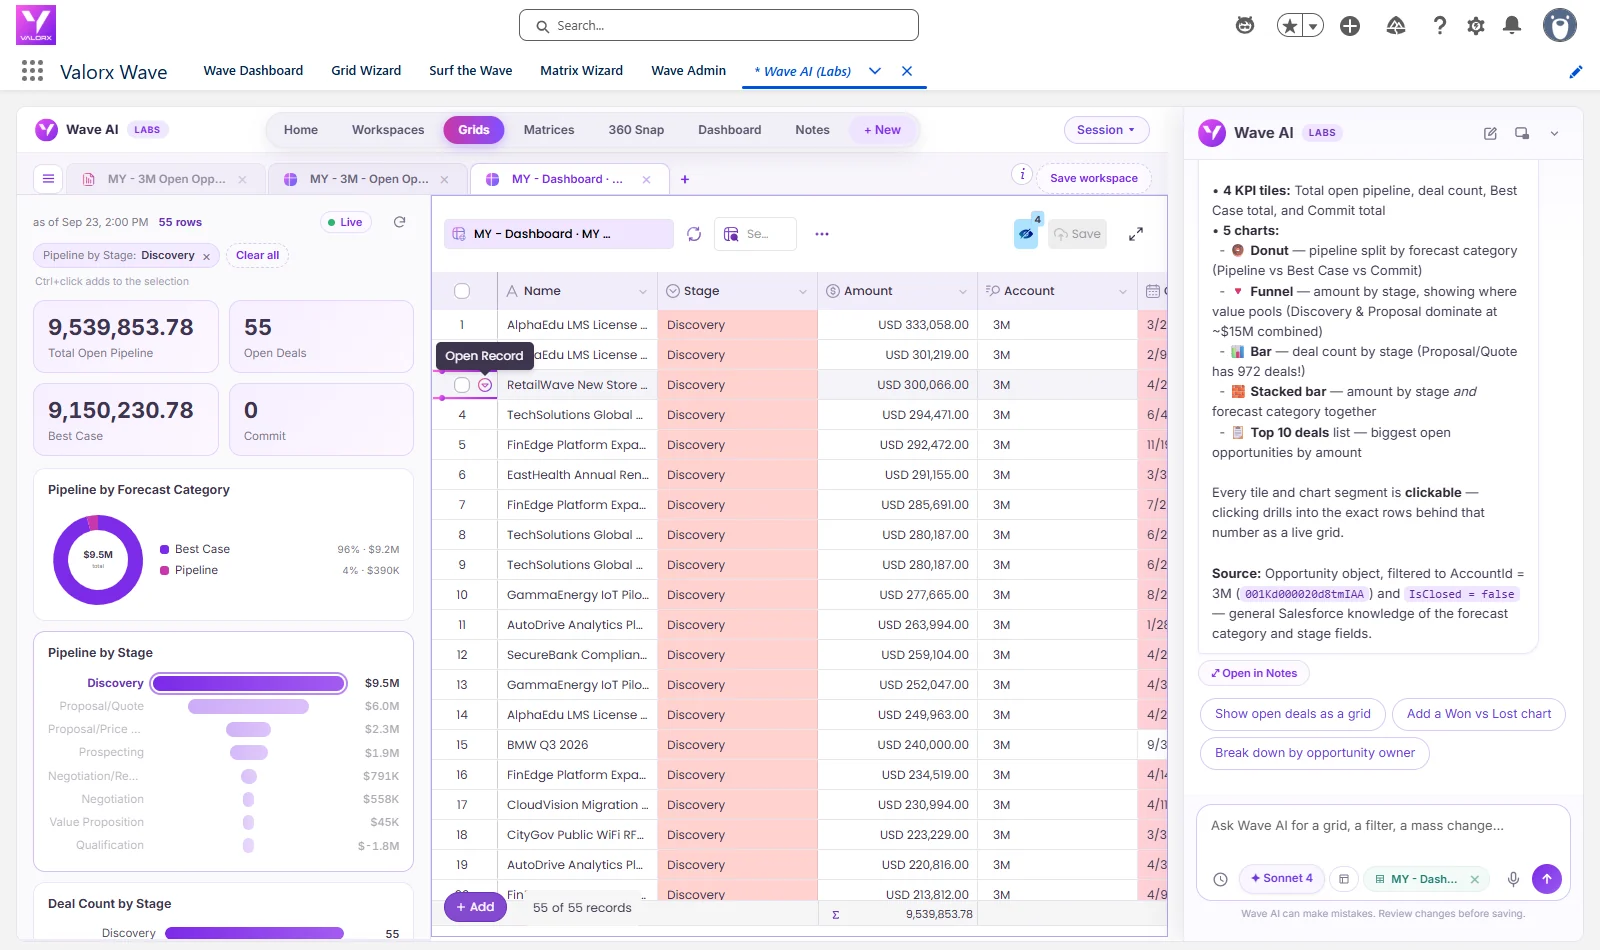
Or ask for it. In the Wave AI beta, you type a prompt such as "Pipeline review." Wave AI shows you the plan first: a dashboard, the grid behind it, and a monthly matrix. Then it builds them on your Salesforce records. Click into a chart to reach the deals behind it, fix what is wrong, and save.
2. Filter down to what needs attention
Filter the grid to open deals and sort by close date, so the deals due soonest sit at the top. Then add conditional formatting so problems stand out: give each stage its own colour, and highlight deals that have no next step.
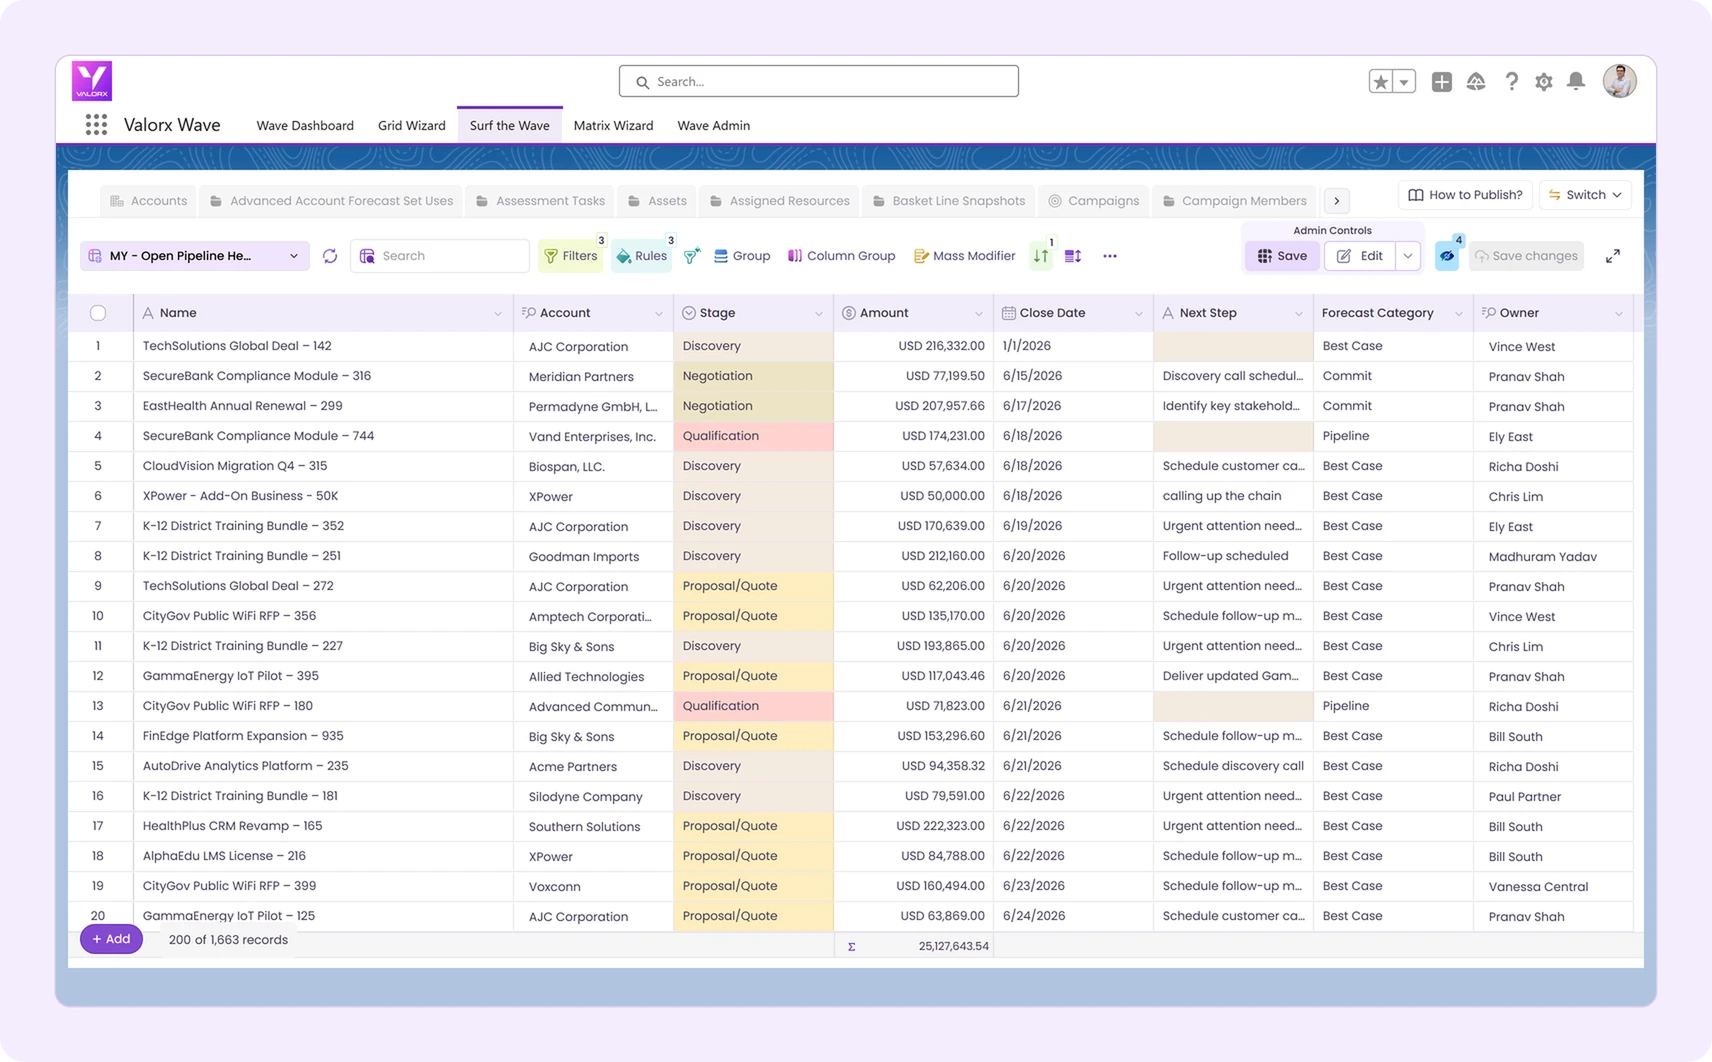
3. Update in bulk, not record by record
Edit cells inline, copy and paste a value across rows, or use Mass Modifier to change one field on every selected record in one action. Wave counts the pending changes on the save button. Your validation rules still run, so a bad value is caught in the grid, not in next week's report.
The same bulk editing works on other objects too. Read more: how to bulk update Salesforce price books and products.
4. Review changes before you save
Before anything is written to Salesforce, Wave shows the pending changes. Go through them, revert what you do not want, then save.
5. Run the forecast call from the live view
Share the grid with managers and leadership. Everyone sees the same records, limited by their own Salesforce profile, sharing rules, and field-level security. On Wave Pro, Matrix views roll the same data up by rep, region, or month.
With the numbers current, the call can move from fixing data to testing decisions. Read more: how to run what-if forecasting scenarios in Salesforce.
What changes for your team
| Forecasting task | Export and spreadsheet | Wave grid on Salesforce |
|---|---|---|
| Updating 50 opportunities | Open each record, or edit a copy offline | Edit in one grid, save once |
| Data freshness | As old as the last export | Live Salesforce records |
| Validation and permissions | Lost once the data leaves Salesforce | Enforced on every edit |
| Getting changes back into the CRM | Retype or re-upload | Already there |
| Manager review | Chasing reps by email | Filter the shared view by rep or stage |
| What reps have to learn | Nothing new, but the work is done twice | A grid that behaves like a spreadsheet |
What this looks like in practice
Qualcomm's Salesforce admin built 40 Wave grids for the sales team, covering pipeline, accounts, pricing, and forecast updates. Grids in active use grew from 7 to 27 in two years, with zero custom code. Read the Qualcomm case study.
If your forecast model lives in Excel: some teams need their own formulas, pivots, and planning models. That is a better fit for Valorx Fusion, which connects Excel and Google Sheets to live Salesforce data in both directions. Many teams use Wave for day-to-day pipeline updates and Fusion for modeling.
Forecasting should not be a quarter-end scramble
Valorx Wave
See your forecast in Wave
Your team already knows how to work in a grid. Your Salesforce org already has the data and the rules. Put the two together and the forecast stays current because updating it takes minutes.
FAQs
What is Salesforce forecasting?
Salesforce forecasting is the process of predicting future revenue from the opportunities in your pipeline. Salesforce groups deals into forecast categories such as Pipeline, Best Case, and Commit. The forecast is only as accurate as the stage, amount, and close date on each record.
Why is Salesforce forecasting hard to keep accurate?
Updating many opportunities in the standard interface is slow, so updates get delayed. Teams then export to spreadsheets to work faster, and the exported copy drifts from the live data. The forecast ends up built on old numbers.
How can I simplify Salesforce forecasting without changing my setup?
Give your team a faster way to update the records they already have. A spreadsheet-style grid such as Valorx Wave sits on your existing objects, fields, validation rules, and permissions. The process stays the same. The export step goes away.
What is Valorx Wave?
Valorx Wave is a spreadsheet-style grid for Salesforce data. Users filter, sort, and bulk edit records, review their pending changes, and save them to Salesforce. Wave is available as a free browser version and as an app inside Salesforce.
Does Wave respect Salesforce security and validation rules?
Yes. Wave follows your Salesforce profiles, sharing rules, and field-level security. Validation rules run on every edit, so users can only see and change what Salesforce already allows.
How is Wave different from Salesforce reports and dashboards?
Reports and dashboards show data. Wave lets you change it. You can correct a close date or forecast category in the same view where you spotted the problem.
Should I use Wave or Fusion for forecasting?
Use Wave to update and review pipeline data inside Salesforce. Use Fusion when your forecast depends on Excel or Google Sheets formulas and models and you want them connected to live Salesforce data. Many teams use both.
.svg)




Choose the workflow you need:
Try Wave in browser Extension

Try Wave in Salesforce

Try Fusion In Excel

Enhancing Salesforce for industry leaders