Salesforce sales forecasting: 6 proven methods for revenue prediction in 2026
- Salesforce sales forecasting fails most often because of stale or incomplete data, not because of the method.
- The six proven methods are opportunity stage, historical trend, pipeline coverage, time-phased (account-based), AI-assisted, and scenario-based forecasting.
- Every method breaks the same way: teams export to Excel or Google Sheets, and Salesforce falls a version behind.
- Most teams combine two or three methods based on sales motion, deal complexity, and data maturity.
- Valorx Wave and Fusion keep forecasting work inside Salesforce, so every method runs on current data.
Most sales teams do not have a forecasting problem. They have a data problem.
The forecast is only as good as the information feeding it. If that information lives in disconnected spreadsheets, manually exported CSVs, and outdated Salesforce records, no methodology will save you from a quarter-end surprise.
That is the reality most revenue leaders are navigating in 2026. Salesforce is the system of record. Excel is where the actual work happens. And the gap between those two worlds is where forecast accuracy quietly dies.
This guide covers six proven Salesforce sales forecasting methods: what they are, when to use them, and what breaks them in practice. We will also show how leading teams are closing the gap between how forecasting is supposed to work and how it actually does.
Why sales forecasting in Salesforce still fails
Salesforce reports that Sales Cloud customers see a 28% increase in forecast accuracy. Yet only 35% of sales professionals completely trust the accuracy of their data, according to the Salesforce State of Sales report.
increase in forecast accuracy reported by Sales Cloud customers
of sales professionals completely trust the accuracy of their data
The gap exists for a predictable reason. Salesforce is powerful, but its native interface was not designed for the way forecasting teams actually work. When a pricing analyst needs to update 200 line items, or a regional manager needs to compare actuals against forecasts across multiple product lines at once, the standard UI forces slow, record-by-record editing.
So they export. They build spreadsheets. They do the real work outside Salesforce. By the time anyone looks at the Salesforce data, it is already stale.
The result? Forecast reviews that become reconciliation meetings. Leadership making strategic decisions from snapshots that are days old. And sales ops spending more time chasing data than analyzing it.
The six methods below only work if your Salesforce data is current, complete, and trustworthy. We will come back to how to fix that.
Method 1: Opportunity stage forecasting
Best for: Teams with a clearly defined, consistent sales process.
Opportunity stage forecasting assigns a probability percentage to each stage in your pipeline: Prospecting (10%), Discovery (25%), Proposal (60%), Negotiation (80%), and so on. Those probabilities are applied to deal values to generate a weighted revenue forecast.
In Salesforce, each stage also maps to a forecast category (Pipeline, Best Case, Commit, Closed), and those categories are what native forecasts roll up. It is the right starting point for most teams.
What works
It is simple, scalable, and visible. When configured correctly, it gives managers a clear view of pipeline health without complex modeling.
What breaks it
Stage definitions drift. Reps interpret "Proposal Sent" differently. Close dates get pushed without stage changes. Over time, the probabilities stop reflecting reality, and the forecast shows how reps feel about deals rather than where those deals actually are.
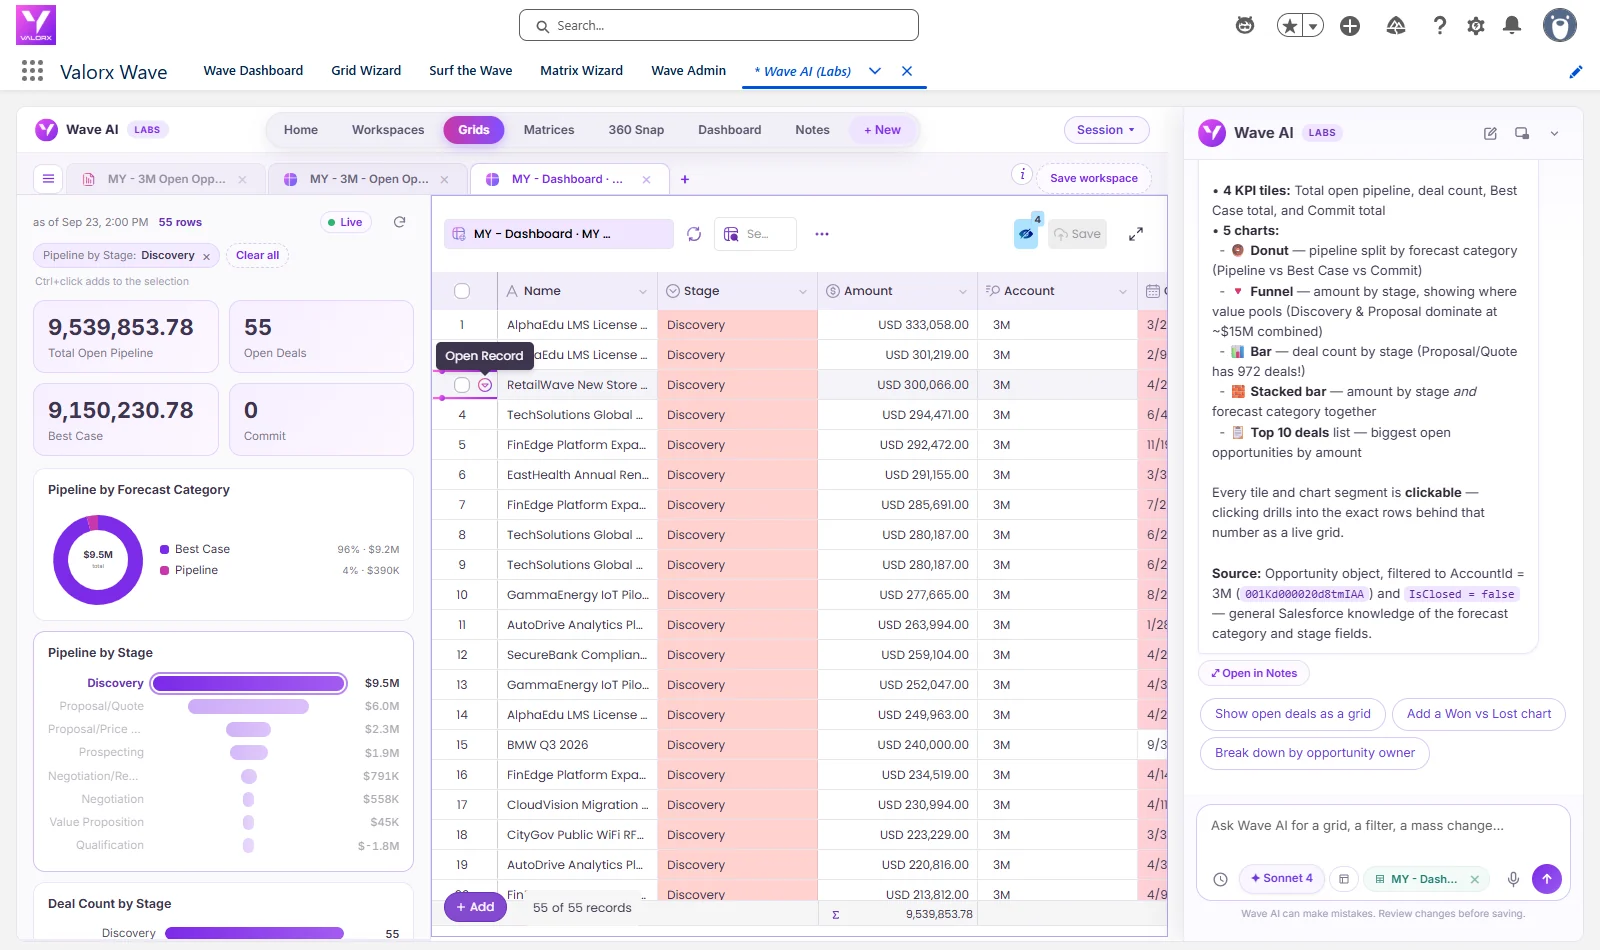
The fix is rigorous pipeline hygiene: clear exit criteria for each stage, enforced close-date discipline, and a regular review cadence. Valorx Wave makes this practical. Sales ops can bulk-update stage, close date, and opportunity fields across hundreds of records in a single grid inside Salesforce, without exporting anything.
Bulk edit opportunities in the Wave grid inside Salesforce. Clean stage data keeps a weighted forecast honest.
Method 2: Historical trend forecasting
Best for: Established businesses with at least two to three years of consistent sales data.
Historical trend forecasting uses past performance to project future revenue. It accounts for seasonality, growth trajectories, and cyclical patterns, which makes it useful for businesses where revenue is predictable and repeatable.
In Salesforce, this typically means pulling historical opportunity data, win rates by stage, and average deal cycles to build a baseline projection.
What works
It removes gut feel from the equation. When your data is clean and your sales motion is consistent, historical trends are reliable predictors of near-term performance.
What breaks it
Incomplete records. Close dates pushed without documentation, deals marked Closed Won at the wrong amount, and skipped stages all corrupt the trend from the start. Data quality decides how far any forecasting model can go.
Every deal managed outside Salesforce is also a gap in your historical dataset. Teams using Valorx Fusion keep complex deals inside Salesforce: the multi-line, multi-product, high-volume quotes that usually end up in disconnected Excel files. Each one adds a clean record that makes trend forecasting more accurate over time.
.avif)
Method 3: Pipeline coverage forecasting
Best for: Sales leaders managing quota attainment across teams or regions.
Pipeline coverage forecasting answers one question: do we have enough in the pipe to hit the number?
The standard benchmark is 3 to 5x pipeline coverage relative to quota, adjusted for your historical win rate. If your team closes 25% of opportunities, you need four times your quota in active pipeline to be confident of hitting it.
Coverage needed = 1 ÷ win rate
25% win rate = 4x quota in pipeline. 33% win rate = 3x.
Salesforce makes coverage ratios visible through reports and dashboards, but only if the pipeline data is accurate.
What works
Coverage forecasting is an early warning system. It flags a pipeline problem weeks before it becomes a revenue problem, giving leadership time to accelerate deals, launch campaigns, or shift territory resources.
What breaks it
Lagging updates. Reps who update Salesforce only at the end of the week or month create coverage reports that trail reality. By the time leadership sees the gap, it is too late to act.
Valorx Wave gives reps a spreadsheet-style grid directly inside Salesforce, so updating opportunity data is as fast and familiar as updating a Google Sheet. The result is live pipeline data and coverage ratios leadership can trust.
Copy and paste across records in Wave, the way you would in a spreadsheet, so reps actually keep pipeline current.
Stop exporting your pipeline to keep it current.
See how teams update hundreds of opportunities in one grid, without leaving Salesforce.
Book a demo →Method 4: Time-phased (account-based) forecasting
Best for: Manufacturers, enterprise B2B teams, and businesses managing long-term volume commitments.
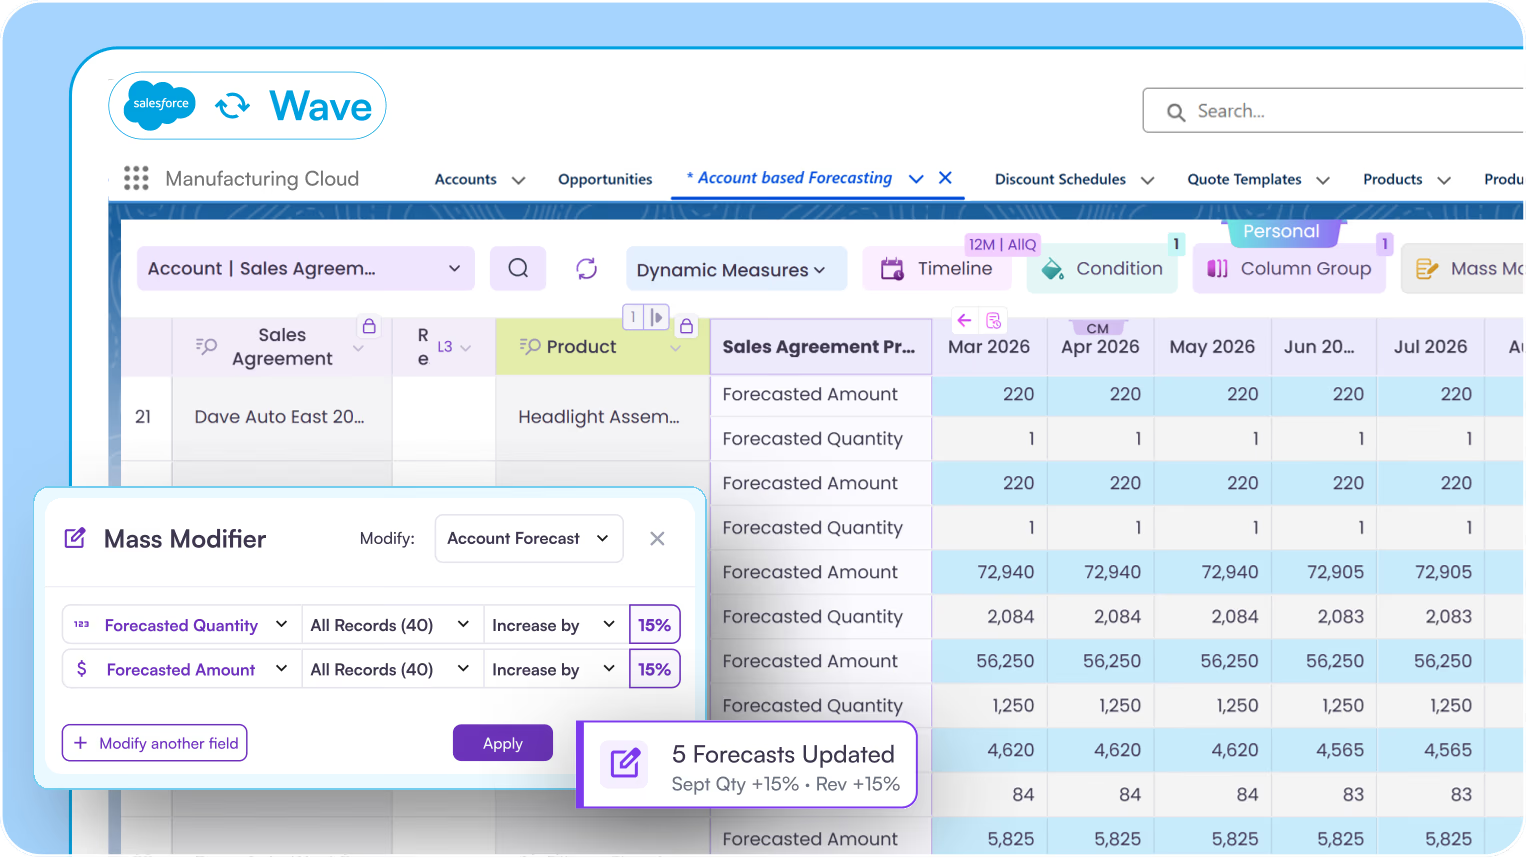
Time-phased forecasting moves beyond individual opportunities to forecast revenue across accounts over rolling horizons: weekly, monthly, quarterly. It is the model behind Account Forecasts and Sales Agreements in Salesforce Manufacturing Cloud, and it is how complex B2B businesses translate customer commitments into demand plans.
Instead of asking "which deals will close this quarter?" it asks "what volume will each account generate over the next 12 months, and how does that compare to what we have committed to supply?"
What works
For businesses managing multi-year supply agreements, distributor relationships, or high-volume repeat accounts, this method gives a far more accurate picture of future revenue than opportunity-based forecasting alone.
What breaks it
The native Salesforce interface is not built for the bulk editing, multi-timeframe views, and simultaneous multi-product updates that time-phased forecasting demands. Teams export to Excel to do the planning work, which leaves Salesforce a version behind.
Western Digital solved this with Valorx Fusion, bridging Salesforce forecasts and ERP actuals in a single workspace. That enabled live, time-phased forecasting without the manual data assembly that used to consume hours every planning cycle. Qualcomm used Valorx Wave to bring chipset design pipeline and S&OP forecasting fully inside Salesforce, eliminating the offline spreadsheets that had fragmented planning data across teams.
Method 5: AI-assisted forecasting
Best for: Teams with large pipelines, high deal volume, and enough historical data to train predictive models.
AI-assisted forecasting uses machine learning to analyze patterns across historical deals, including win rates, deal velocity, buyer engagement signals, and rep behavior. It then generates predictions that go beyond static probability percentages.
Einstein Forecasting is the native Salesforce implementation. It layers AI predictions over your existing forecast categories, flags deals where the model's confidence diverges from the rep's assessment, and surfaces risk earlier in the cycle.
Third-party tools like Clari and Gong extend this further, adding conversation intelligence, email activity, and external signals to the model.
What works
On large datasets, AI forecasting tends to outperform manual methods. It reduces the optimism bias in rep-submitted forecasts, and it spots deal risk (disengaged buyers, stalling close dates, reduced activity) before it shows up in the numbers.
What breaks it
AI models are only as good as the data they are trained on. If your Salesforce records are incomplete, inconsistently updated, or distorted by years of spreadsheet workarounds, the predictions will inherit that unreliability. Garbage in, garbage out, even with machine learning.
Before investing in AI forecasting tools, ask one question: is your Salesforce data complete enough to train a meaningful model?
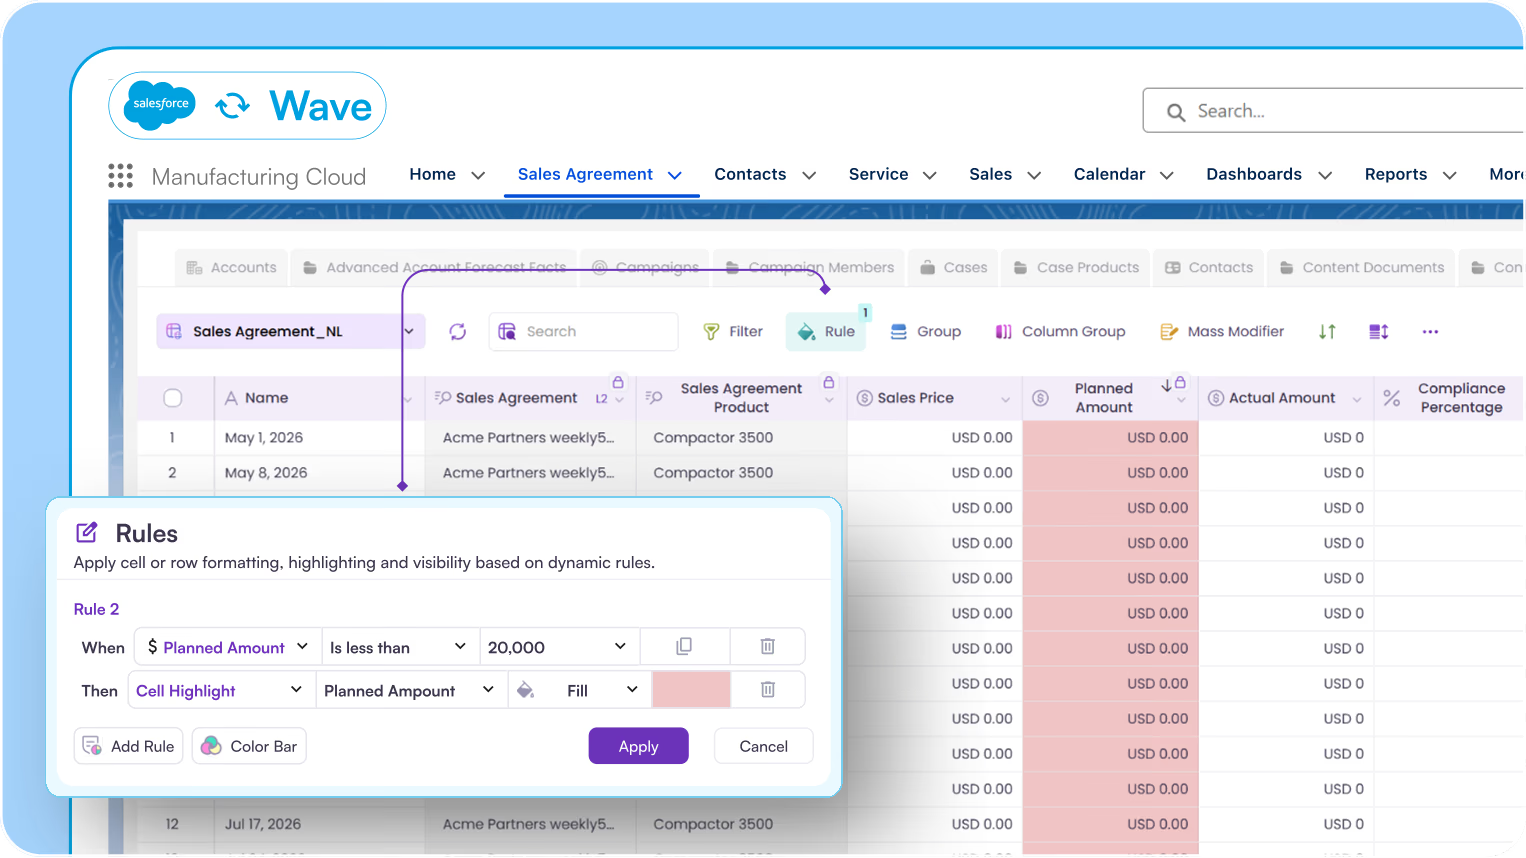
That readiness check takes minutes in Valorx Wave. Conditional formatting flags every opportunity with a missing amount, close date, or next step, and reps fill the gaps in the same grid. For more on where AI fits, see the role of AI in modern forecasting.
Method 6: Multivariate and scenario-based forecasting
Best for: RevOps teams, finance leaders, and businesses operating in volatile or complex markets.
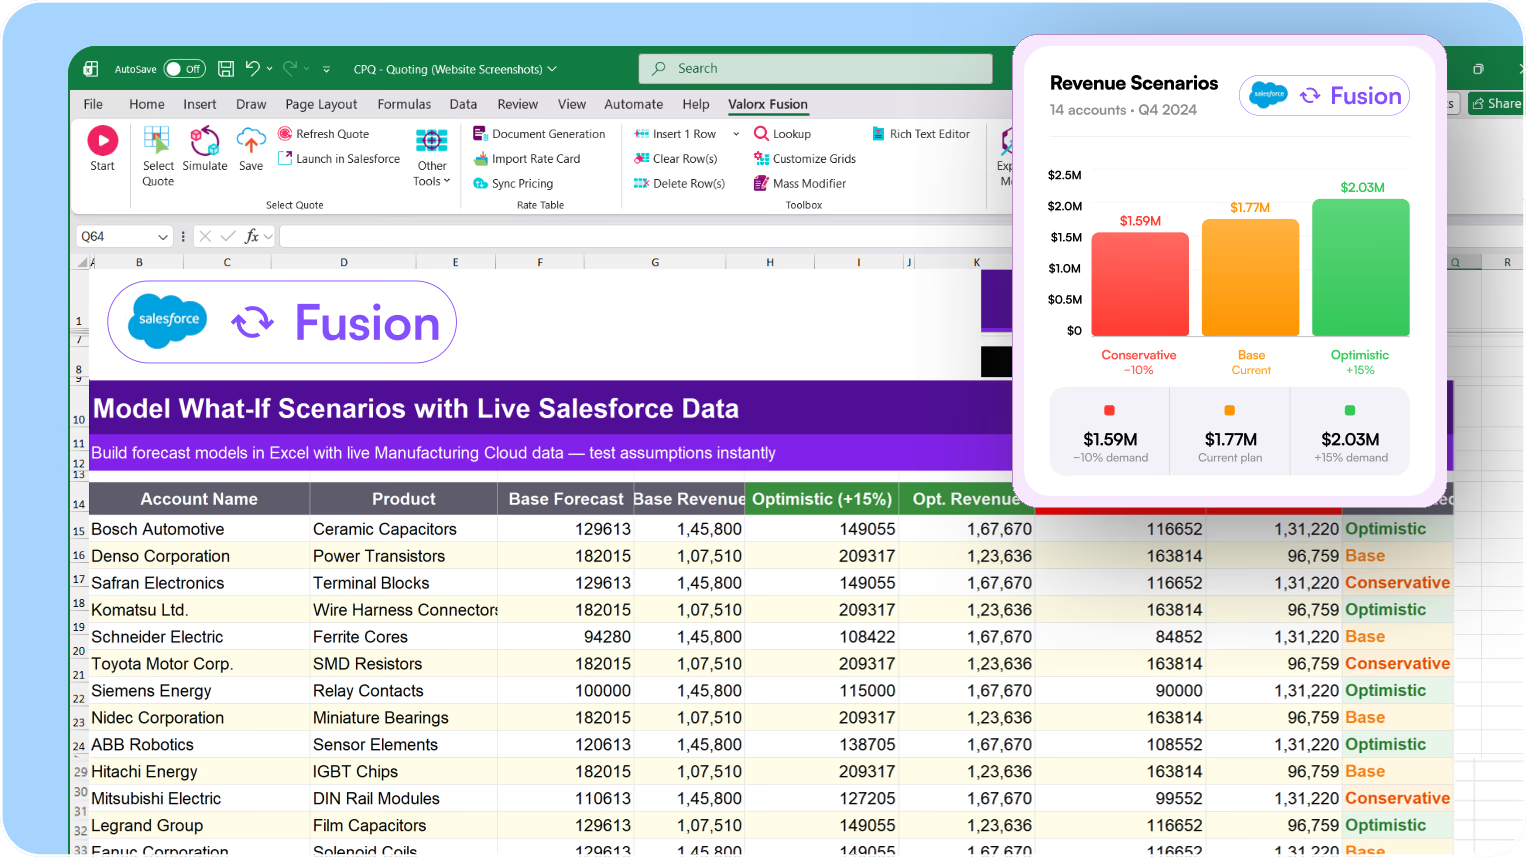
Scenario-based forecasting builds several revenue models at once (base case, upside, and downside) by adjusting key variables: win rate, deal velocity, average contract value, churn, market conditions. It answers not just "what will we sell?" but "what happens if our top deal slips?" or "what does Q3 look like if expansion revenue underperforms by 20%?"
In Salesforce, this typically requires custom reports, dashboard workarounds, or, more often, a move to Excel where analysts can model freely.
What works
Scenario forecasting gives leadership real decision-making support rather than a single-point estimate. It is how finance and RevOps leaders turn pipeline uncertainty into a range of outcomes they can plan around.
What breaks it
Offline drift. Scenarios modeled in disconnected spreadsheets need manual reconciliation every time the pipeline changes, which defeats the purpose.
The better approach is to model scenarios against live data. Valorx Fusion connects Excel to Salesforce, so analysts apply formulas, model scenarios, and run what-if analysis directly on the current pipeline, not a snapshot from three days ago.
Choosing the right method for your team
| Method | Best for | Key risk |
|---|---|---|
| Opportunity stage | Consistent sales process | Stage drift, stale data |
| Historical trend | Established, predictable businesses | Incomplete historical records |
| Pipeline coverage | Quota management, early warning | Lagging pipeline updates |
| Time-phased / account-based | Manufacturing, enterprise B2B | Planning work moves offline |
| AI-assisted | High-volume pipelines | Poor underlying data quality |
| Scenario-based | RevOps, volatile markets | Offline modeling drift |
Most teams combine two or three methods: typically stage-based forecasting for near-term visibility, coverage ratios for pipeline health, and either time-phased or AI-assisted models depending on business complexity.
The right combination depends on your sales motion, deal complexity, and data maturity. The prerequisite does not vary: forecasting only works when the data feeding it is clean, current, and trustworthy.
The method is not the problem. The data is.
The fix is not a better forecasting methodology. It is making Salesforce fast enough and flexible enough that teams do not need to leave it.
That is what Valorx is built for. Fusion brings Excel's speed and formula power directly to your Salesforce data. Wave gives reps a spreadsheet-style grid built natively inside Salesforce. The goal is the same: keep the work where the data lives, so your forecasts are built on current numbers.
BP Oil & Gas manages 15,000+ quotes a year across 200 account managers, entirely inside Salesforce. Adobe unified three Salesforce orgs into a single reporting view, cutting 40+ hours of manual work down to minutes. Western Digital runs time-phased forecasting across Salesforce and ERP in one workspace. Swoop went from Google Sheets to full Salesforce adoption in 21 days.
In every case, the forecasting method did not change. The interface did.
Pipeline management in Valorx Wave: grids, products, and dashboards inside Salesforce.
Ready to make your Salesforce forecast actually accurate?
If your team still manages forecast data in Excel, Google Sheets, or emailed CSVs, the problem is not your forecasting method. It is the gap between where the work happens and where the data needs to live. Valorx closes that gap.
Book a demo →Frequently asked questions
What is the most accurate Salesforce forecasting method?
There is no single most accurate method. Accuracy depends more on data quality than on the method. Most teams get the best results by combining stage-based forecasting, pipeline coverage, and one advanced model such as time-phased or AI-assisted forecasting.
What pipeline coverage ratio do I need?
The common benchmark is 3 to 5x quota. A more precise target is one divided by your win rate: a 25% win rate needs 4x coverage, and a 33% win rate needs about 3x.
Why are Salesforce forecasts inaccurate?
Usually because the data is stale. When teams do forecasting work in spreadsheets, Salesforce records fall behind, and every forecast built on them inherits the gap.
Does AI forecasting work with incomplete Salesforce data?
Not well. AI models learn from historical records, so missing stages, wrong amounts, and late updates produce unreliable predictions. Fix data completeness first.
Can you do scenario forecasting inside Salesforce?
Native Salesforce is limited to custom reports and dashboards. Valorx Fusion connects Excel to live Salesforce data, so analysts can run what-if models without exporting.
.svg)


Choose the workflow you need:
Try Wave in browser Extension

Try Wave in Salesforce

Try Fusion In Excel

Enhancing Salesforce for industry leaders