How to Build Pivot Tables in Salesforce (No Code, Editable)
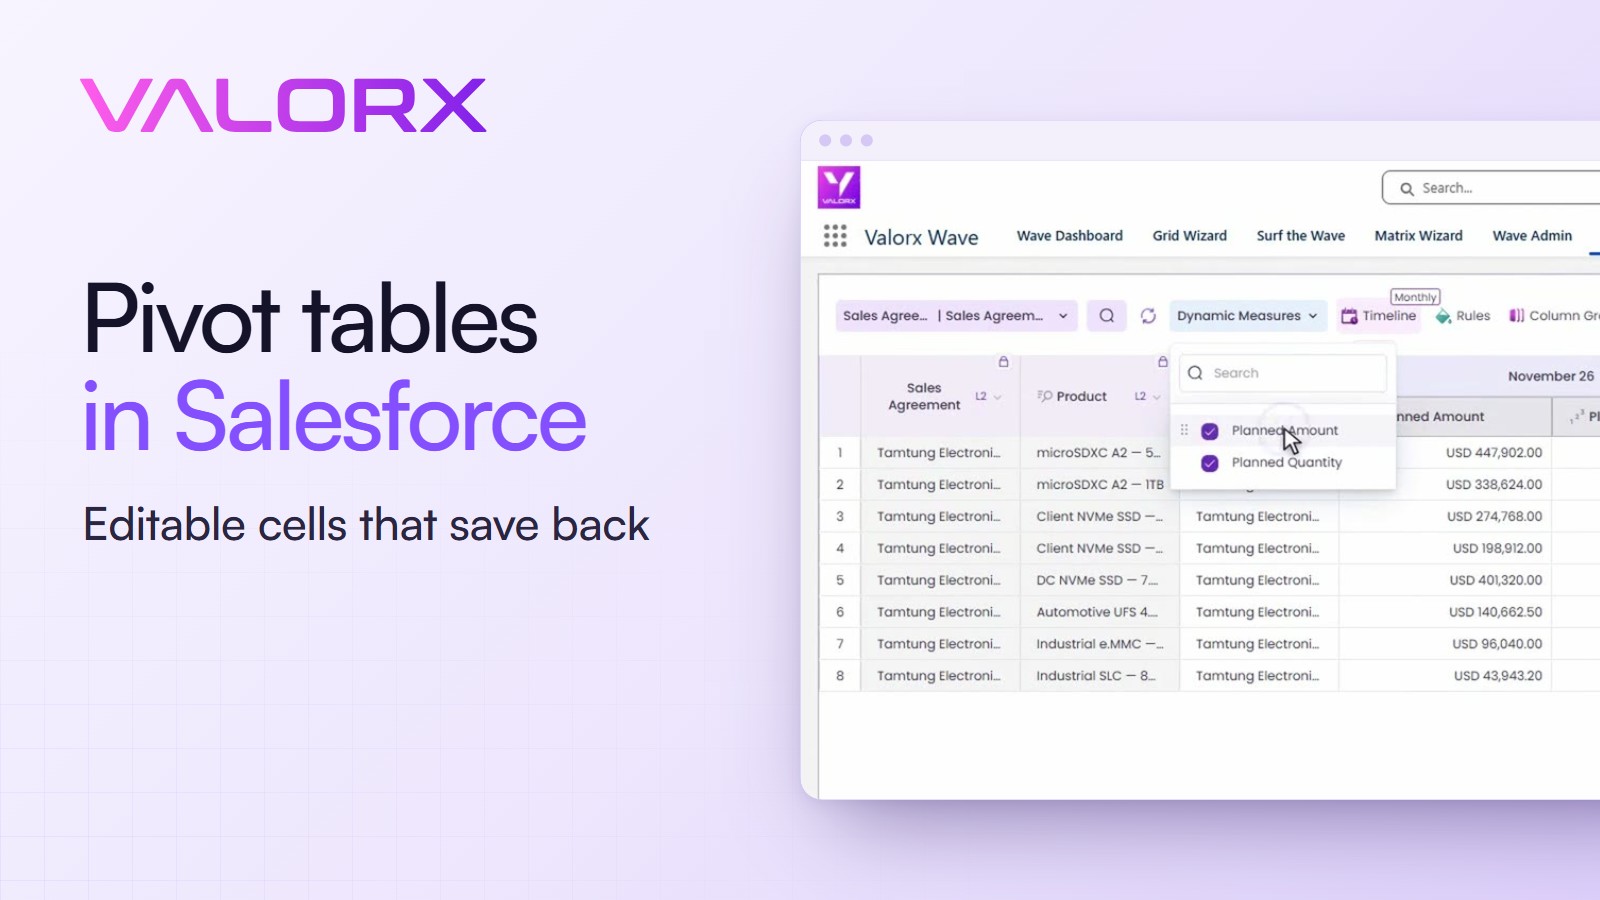
You can build a pivot table in Salesforce that you edit like a spreadsheet: products down the side, months across the top, a number in every cell. Type a new number, save, and the record in Salesforce changes. This guide follows the video step by step.
What you'll build
- A pivot table on live Salesforce records
- Products as rows, months as columns
- Cells you can type in and save
- One view by month, quarter or week
- No code, built in a wizard
- Video length: 5 minutes
What a pivot table in Salesforce looks like
Three parts, the same as in a spreadsheet. Rows are the records. Columns are the time frame. Cells hold the number. The difference is the last part: here the cells are editable, and saving writes to Salesforce.
Why this is hard today: one forecast, four objects
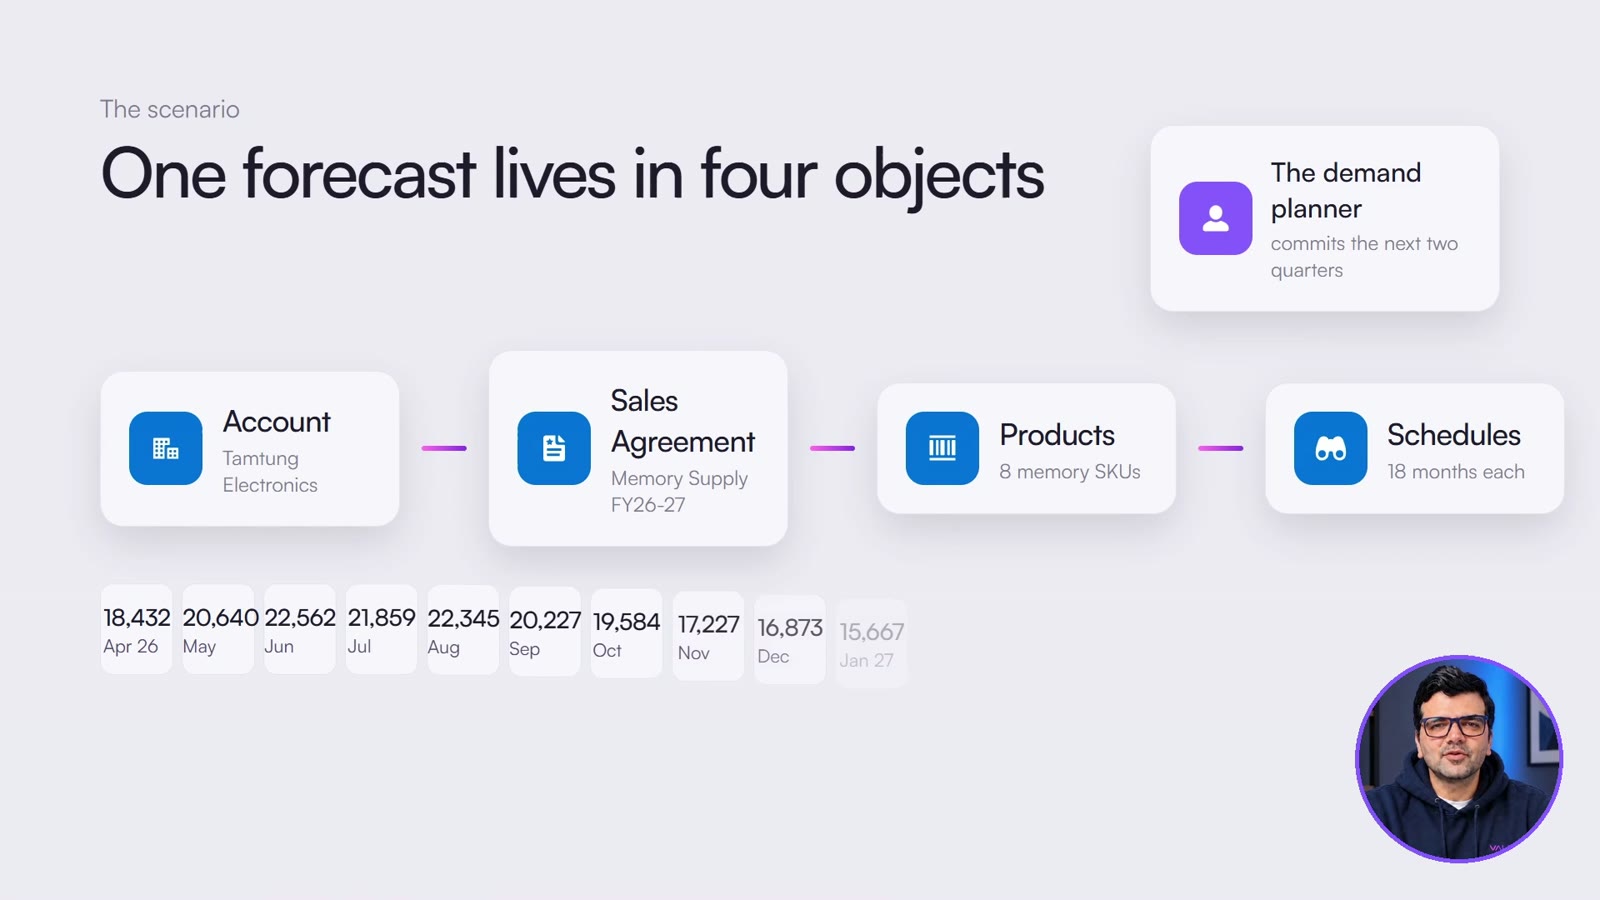
The example is a memory supply agreement in our demo org: $39 million, eight products, eighteen months. To forecast it, a planner needs four things that live in four places.
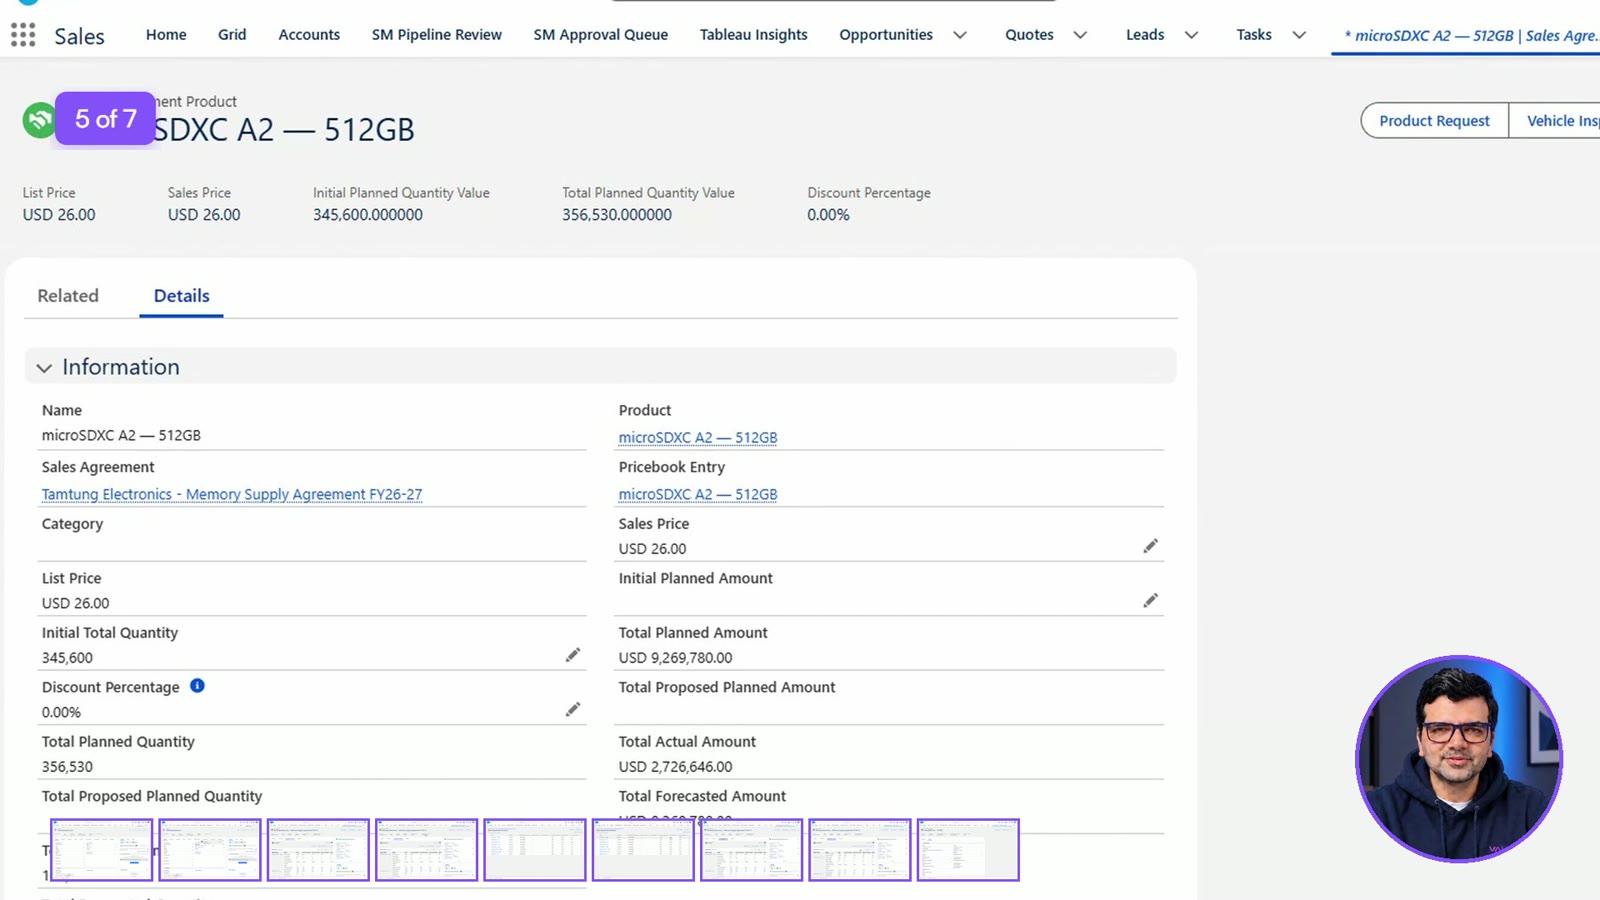
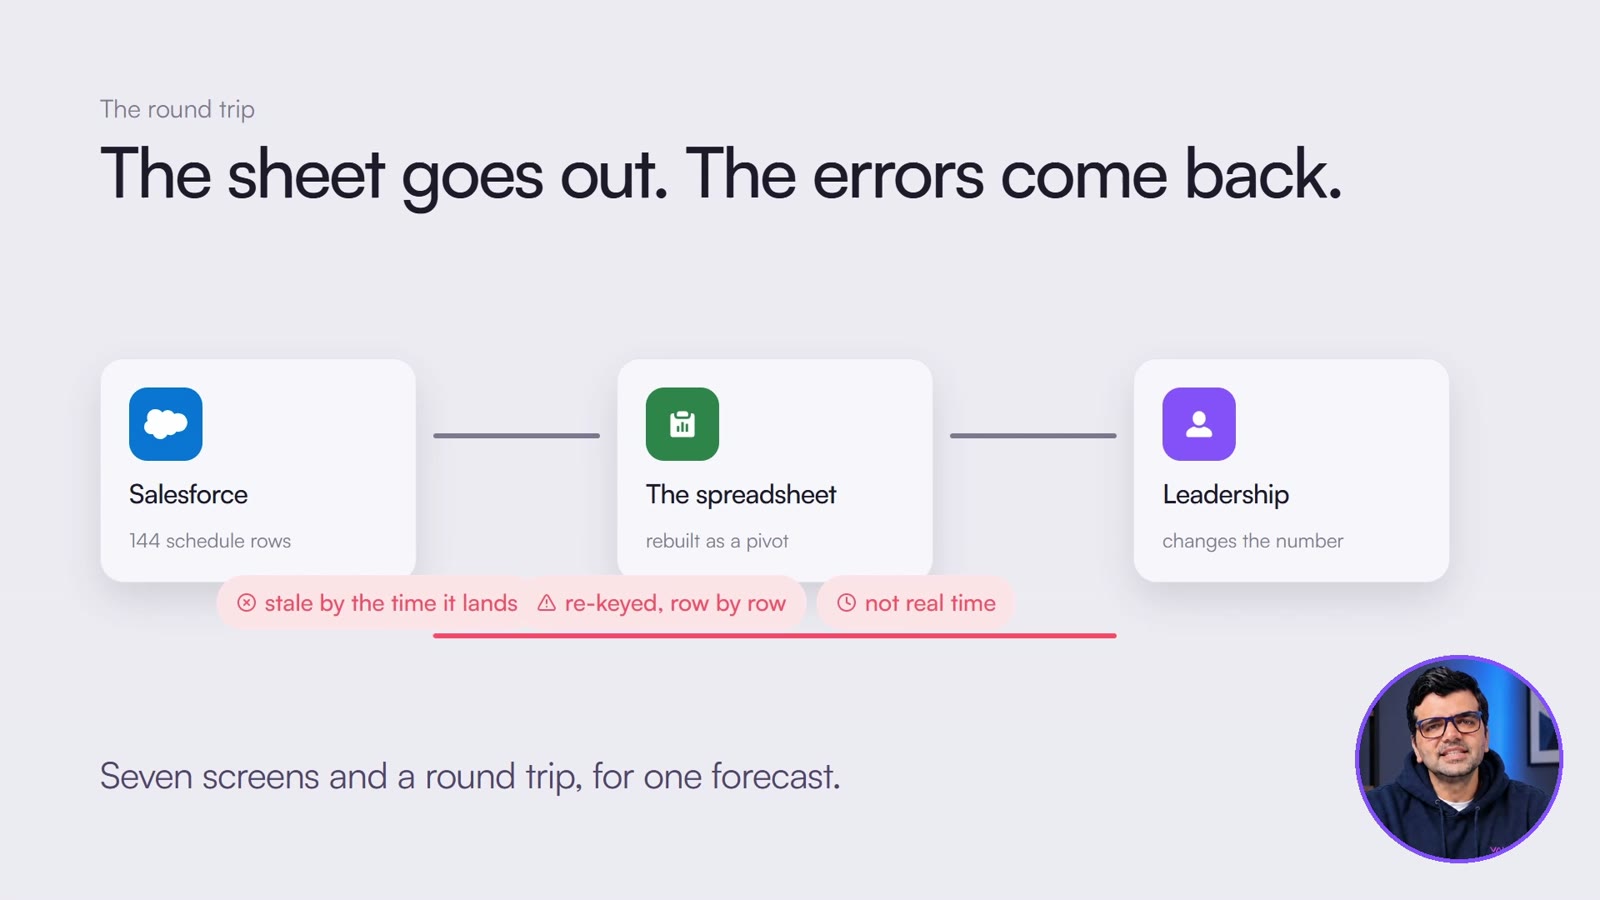
In the video we count the screens it takes to see one forecast. It comes to seven. This is the fifth: a single product on the agreement, with totals but still no months.
So the planner does what most planners do. They rebuild it as a pivot in a spreadsheet. Leadership changes the number. Someone keys it back into Salesforce row by row, and by then a quantity has moved.
| The usual way | With a Wave Matrix |
|---|---|
| Seven screens to see one agreement's forecast | One view: account, agreement, products and months |
| Rebuild the numbers as a pivot in a spreadsheet | The pivot is already built, on the live records |
| Key the agreed numbers back in, one schedule row at a time | Type in the cell and save |
| A separate sheet for the quarterly view | Switch the same view to quarters or weeks |
Build it in seven steps
You need Valorx Wave from the AppExchange and the Wave permission set. Everything below happens in the Matrix Wizard.
- Name the matrix. Ours is Memory Supply Forecast.
- Pick the rows. Choose the product schedule object, because that's where the monthly numbers live. For the row labels, pick the agreement, the product, and the account behind the agreement.
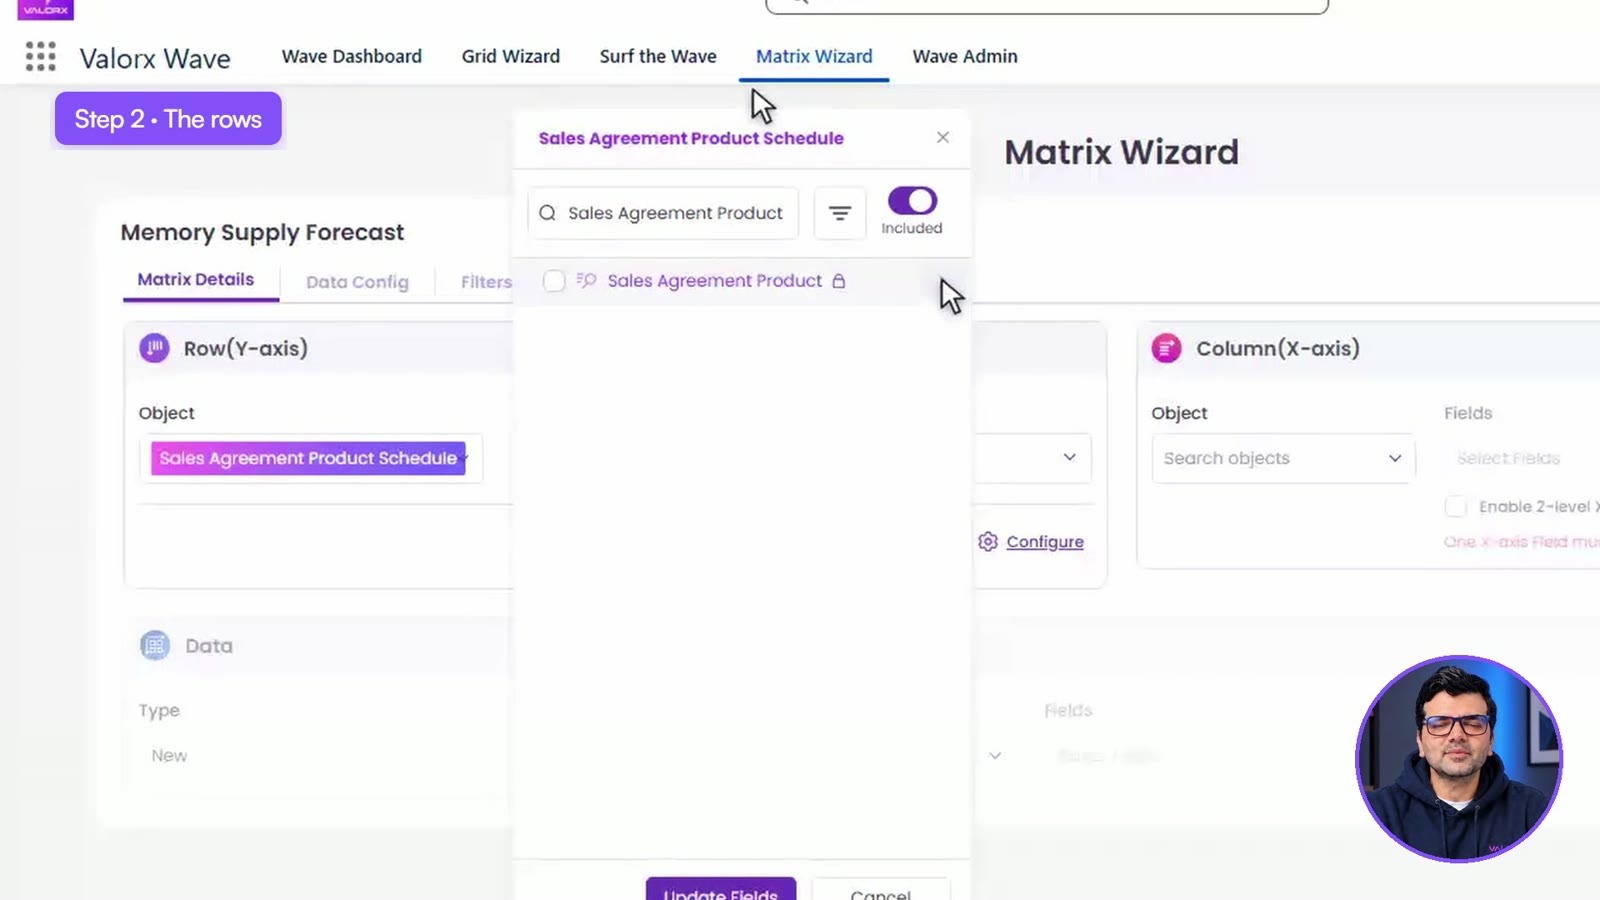
- Pick the columns. Same object. The field is the schedule's start date, and that becomes the months.
- Pick the data. Use existing records, then choose what goes in the cells. We chose planned quantity and planned amount.
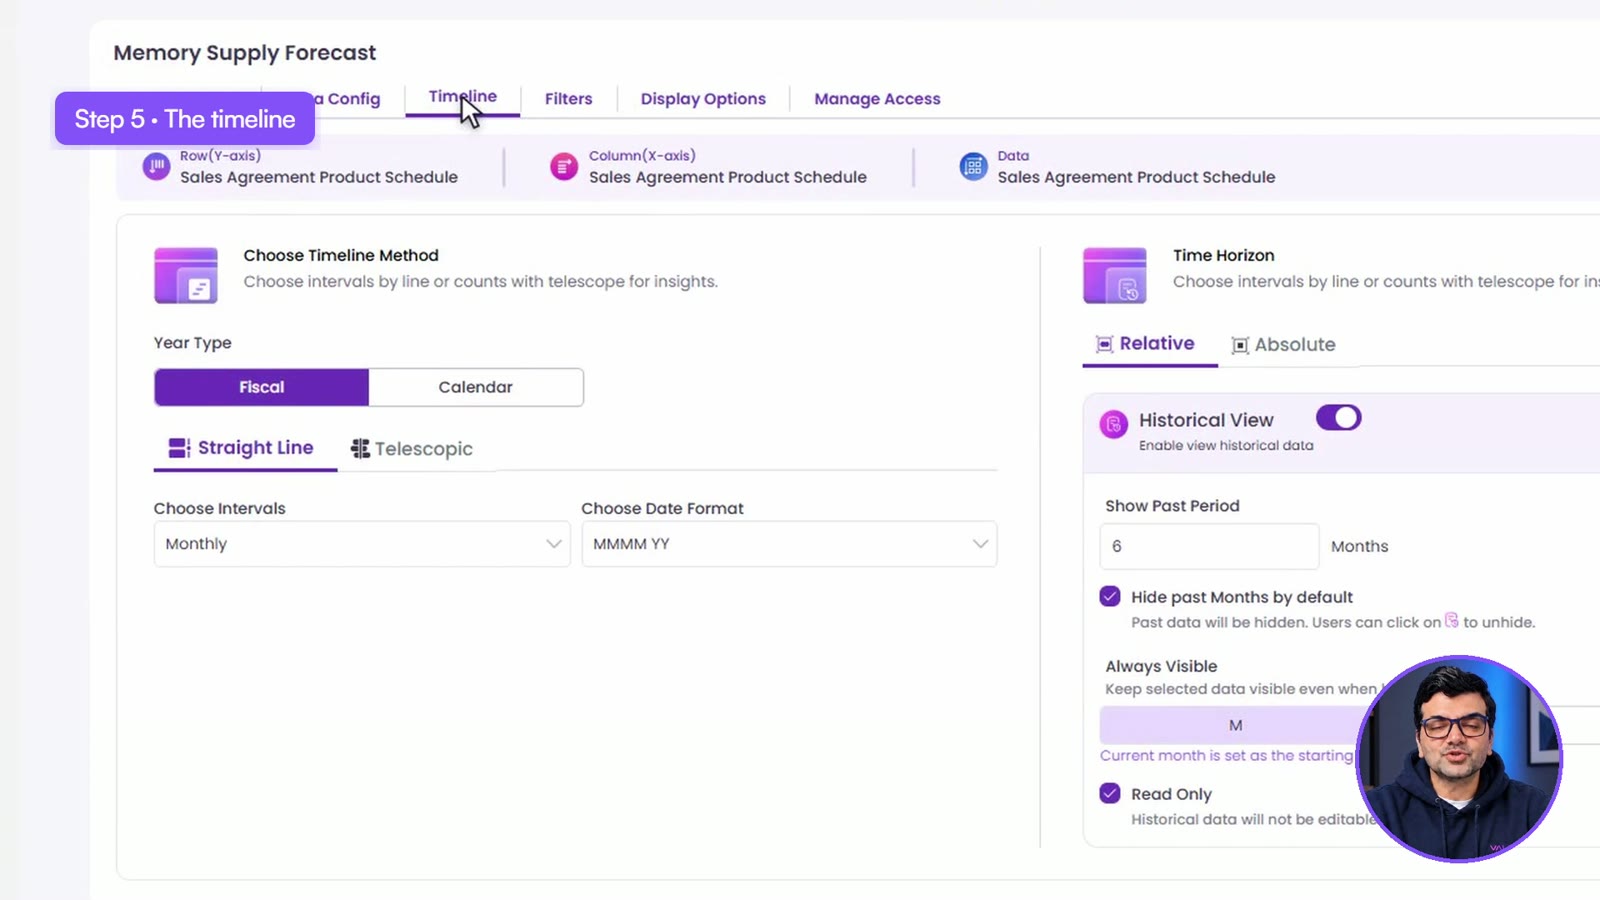
- Set the timeline. Monthly, on a straight line. You can also telescope it, with months near term and quarters further out.
- Add a filter. Let the planner pick agreements when the matrix opens. One matrix then serves every account.
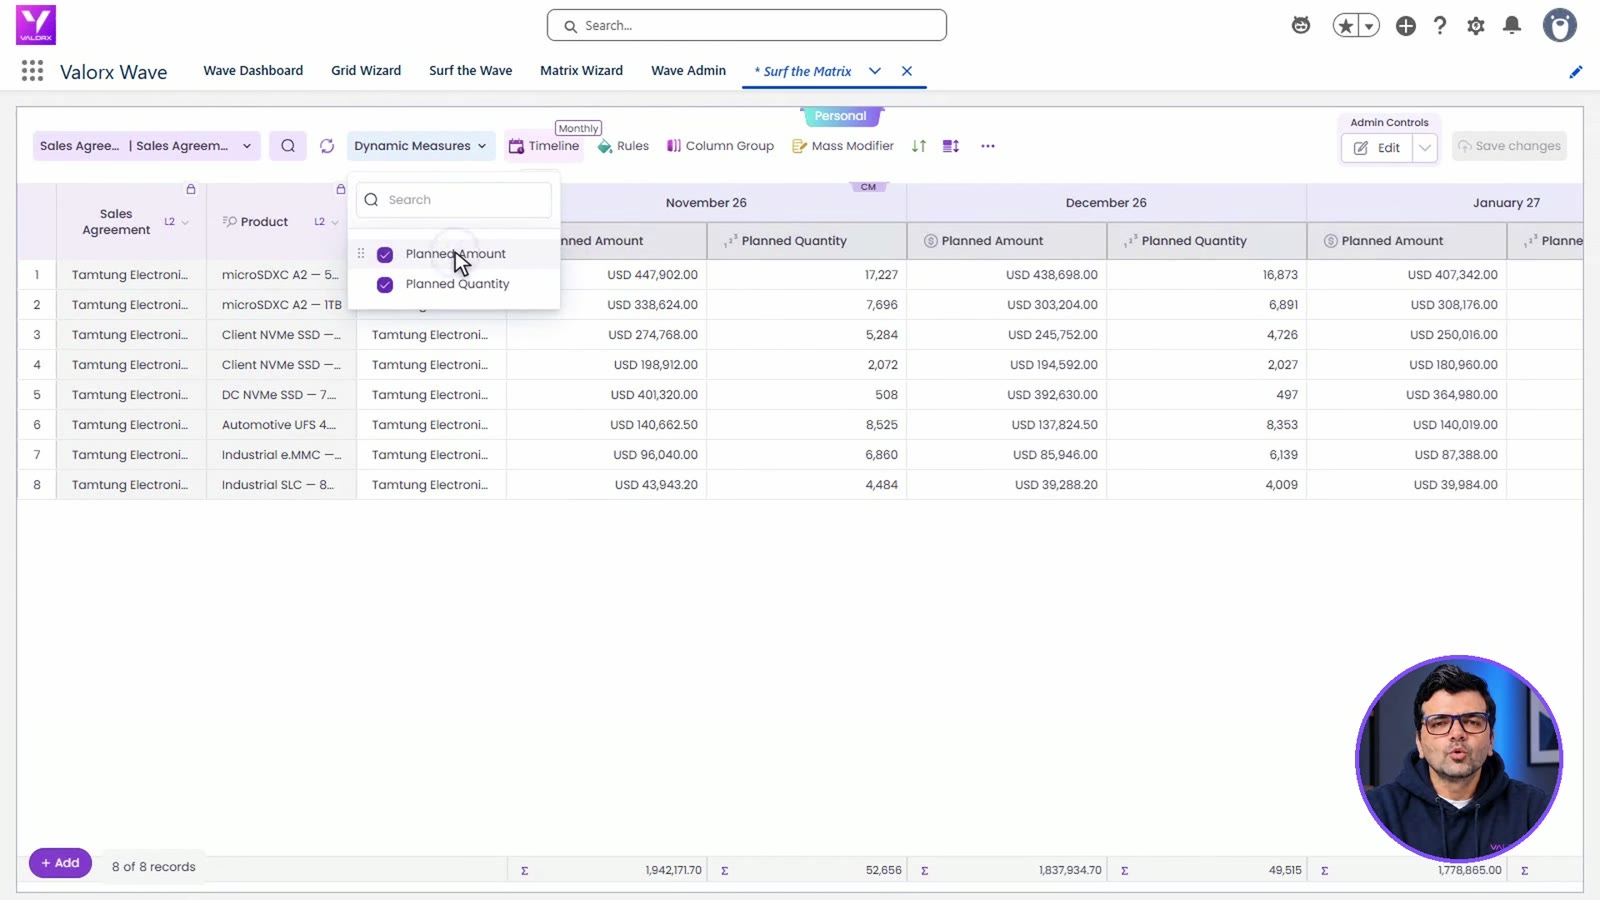
- Save and surf. Pick an agreement and the pivot table opens: every product underneath, months across.
Now use it
Each cell is one schedule row in Salesforce. The Dynamic Measures menu switches between quantity, amount, or both, depending on what the meeting needs.
Worked example from the video
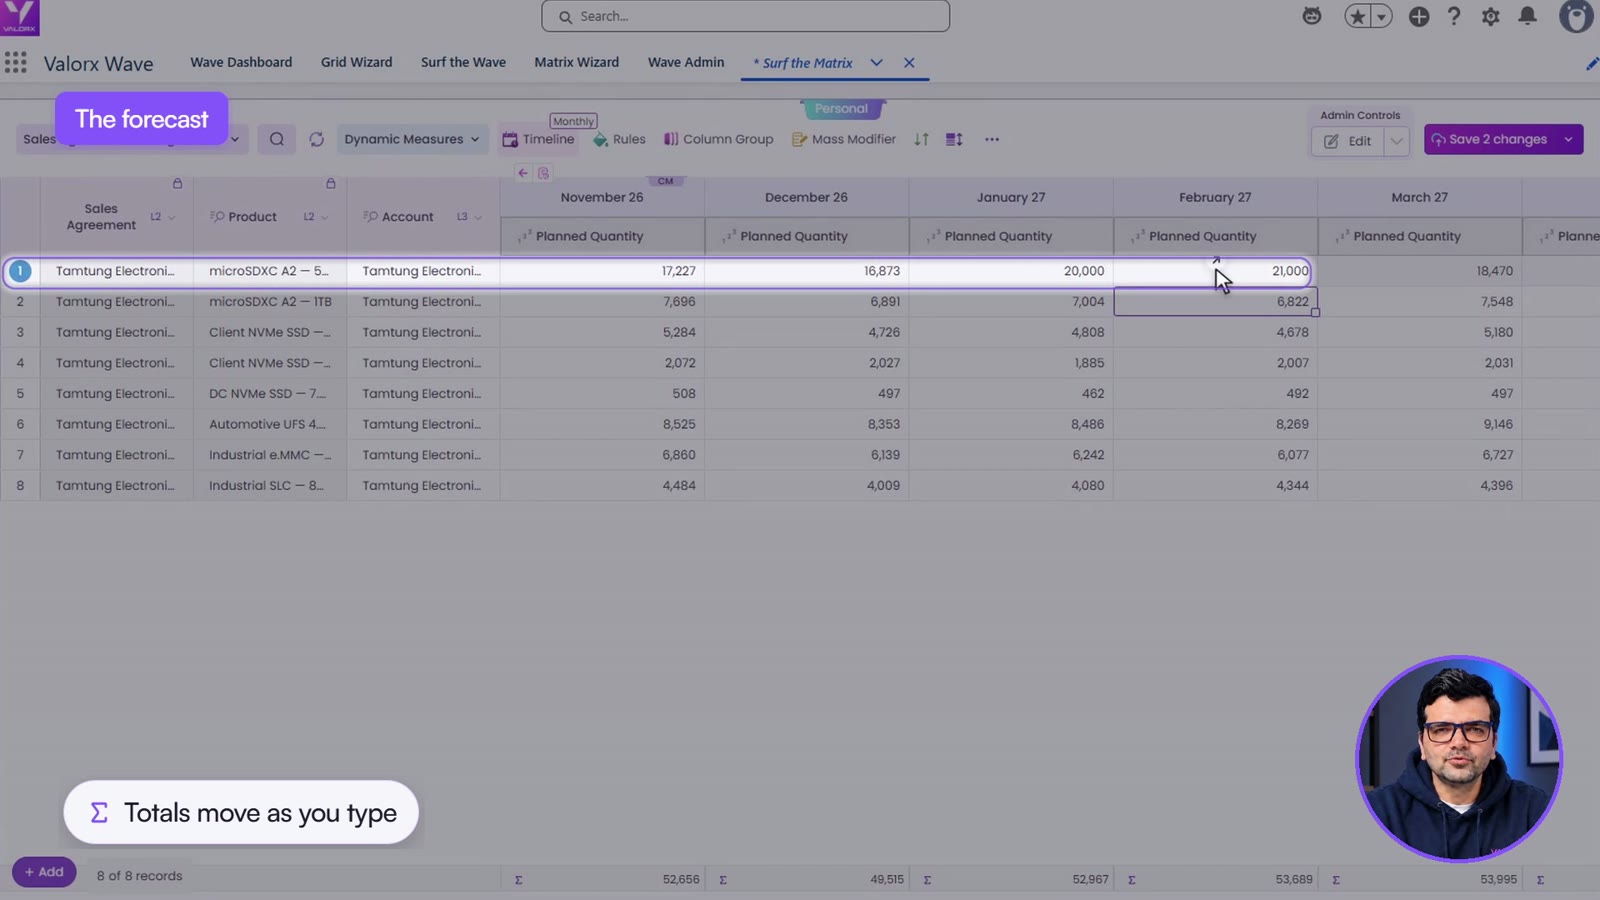
The customer asks for more 512 GB cards in the first quarter. The new quantities go straight into three cells.
The row total and the column totals move as you type. Nothing is exported and nothing is re-keyed.
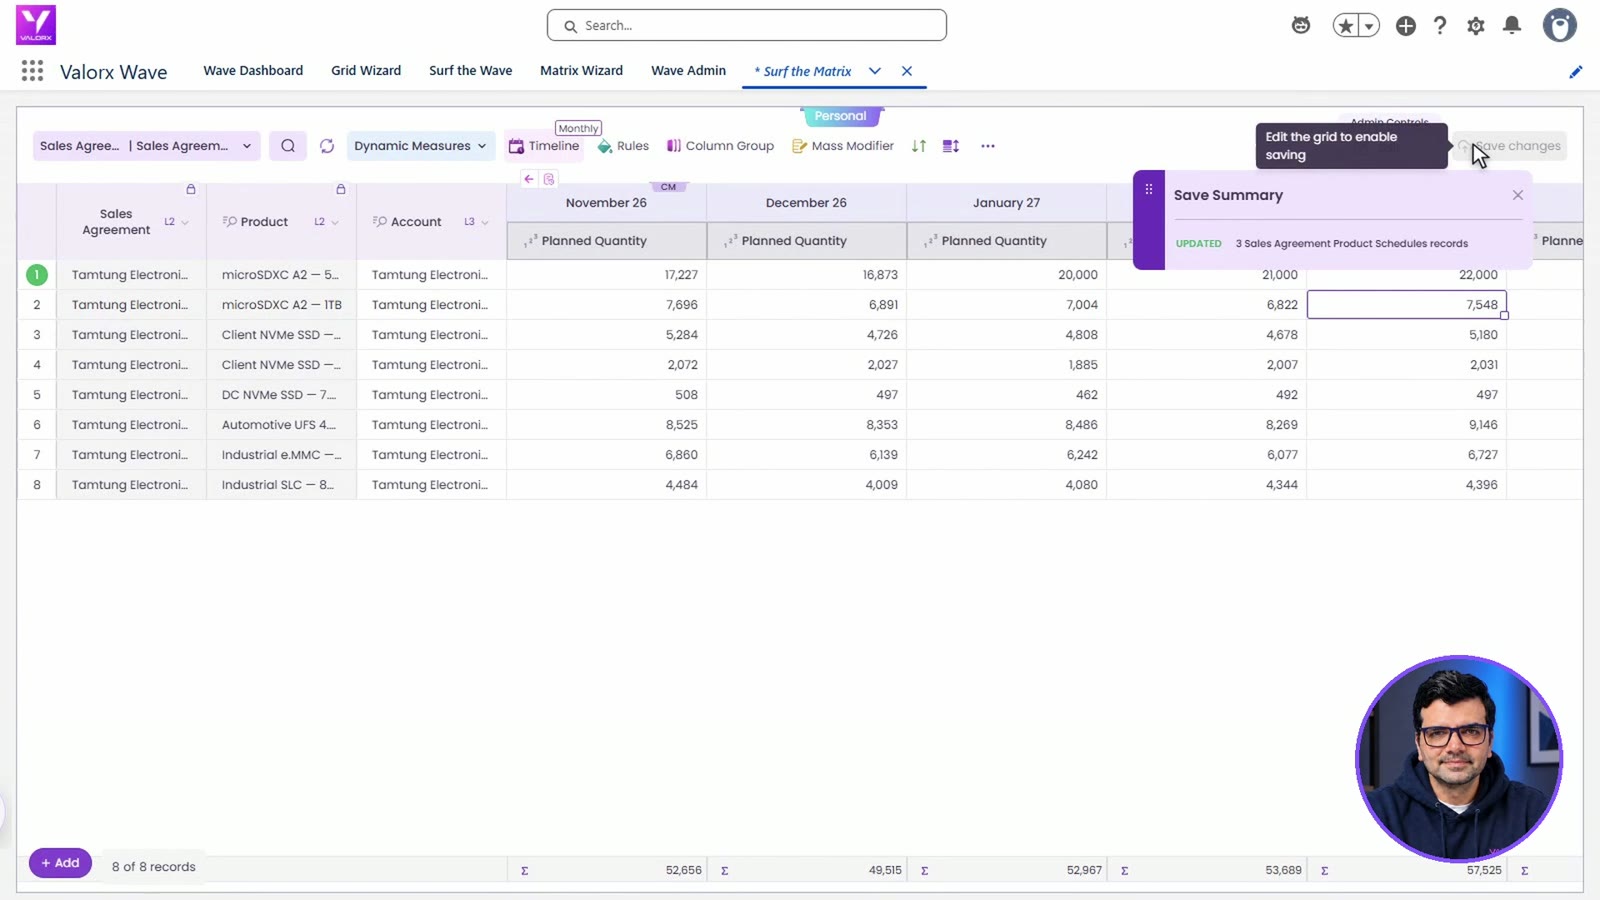
Click Save and a summary confirms which records were updated. These are schedule rows in Salesforce, so the agreement's own rules still apply.
Three more to build next
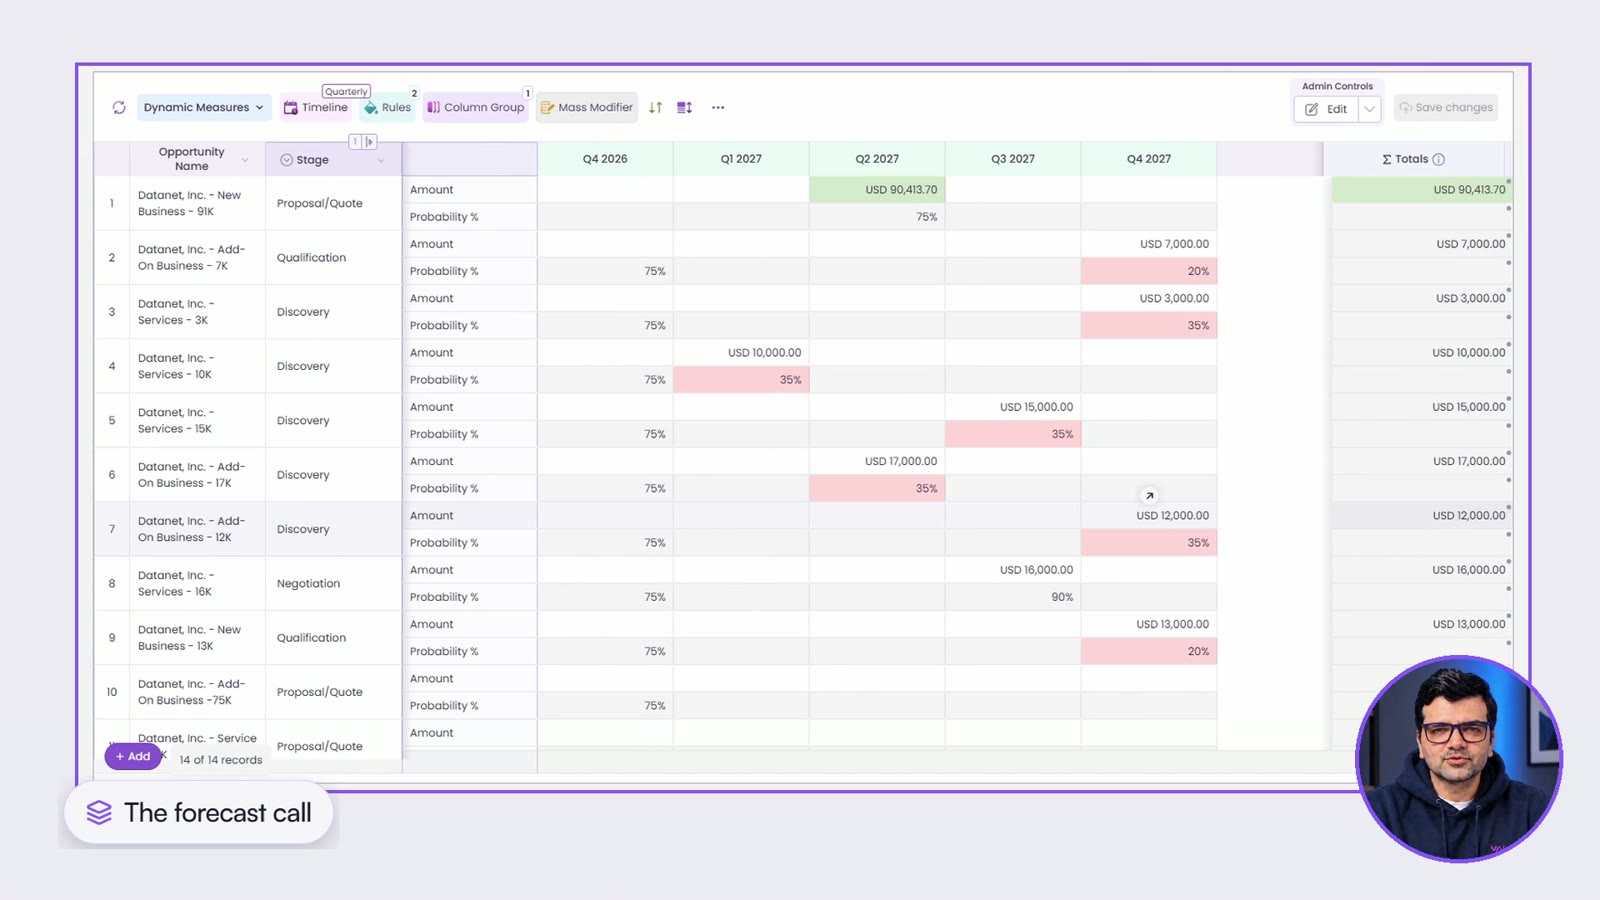
- The forecast call. Opportunities as rows, close quarters as columns, amount and probability in the cells.
- Product mix. Products as rows, months as columns, quantity in the cells.
- The quarter view. The same agreement rolled up by quarter for the business review.
Questions this video answers
Can you create a pivot table in Salesforce?
Yes. Salesforce reports can group and summarize records, and a matrix report lays them out in rows and columns to read. A Wave Matrix is a pivot table on the live records where the cells are editable and save back.
What's the difference between a matrix report and a Wave Matrix?
A matrix report is for reading. A Wave Matrix shows the records themselves in the cells, so you can change a quantity and save it. More on reports: Salesforce matrix report.
Can one pivot table span several Salesforce objects?
Yes. The one in the video connects the account, the sales agreement, its products and the monthly schedule for each product.
Do I need code or an admin to build it?
No code. It's built in the Matrix Wizard by anyone with a Designer or Admin role in Wave.
Keep going
- Try it yourself: the Forecast Rollup walkthrough
- Next video: How to Manage Changing Customer Demand in Salesforce
- Read: Smarter rolling forecasts for manufacturers
Recorded in a Salesforce demo org with demo data, restored after recording.
Want to see it on your own objects? Book a demo and we'll build the first matrix with you on the call.







Choose the workflow you need:
Try Wave in browser Extension

Try Wave in Salesforce

Try Fusion In Excel

Enhancing Salesforce for industry leaders