How to Use Salesforce Forecasting: Set Up, Review and Fix the Number (No Code)

Salesforce forecasting rolls every open deal into a few numbers by month, rep and manager. To use it well you set up four things, learn to read the Forecasts tab, and then review the deals behind the number. This guide follows the video: a team showing $5.37M in commit against an $8.4M quota, and the three deals that changed it.
Jump to a chapter
What you'll learn
- How categories, quotas and the rollup work
- The four things to set up
- How to read the Forecasts tab
- How to build a forecast review screen
- How to fix the deals and see the number move
- Video length: 6 minutes
How Salesforce forecasting works
Every open deal carries a forecast category: Pipeline, Best Case, Commit or Closed. The category comes from the deal's stage, and a rep can change it on the deal.
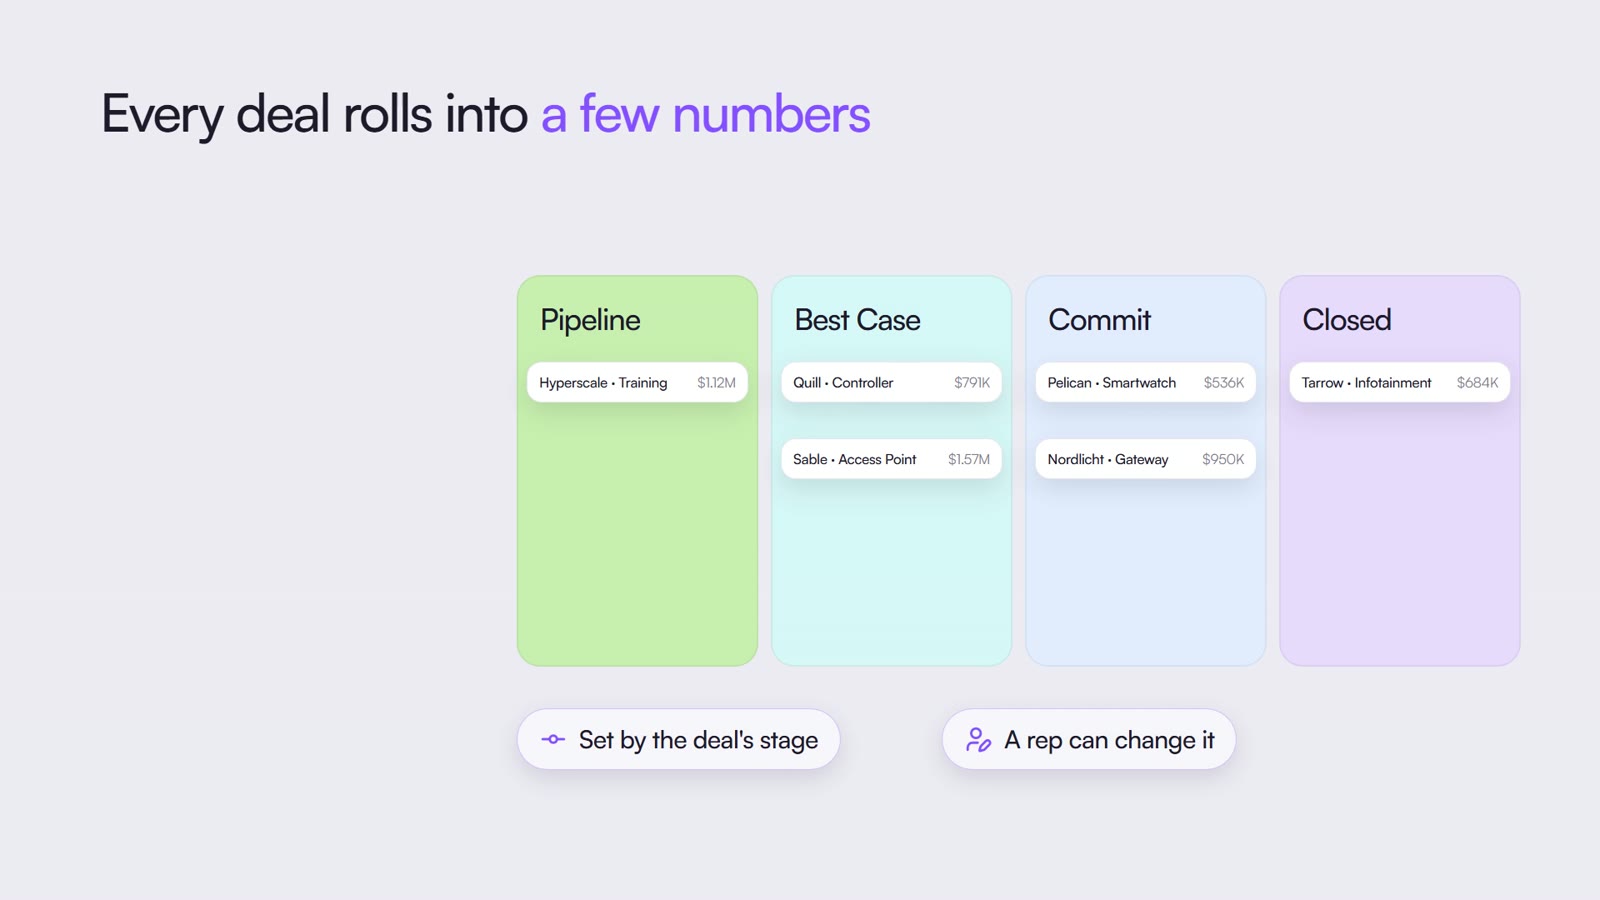
The forecast adds those categories up by month or by quarter, then rolls them up from each rep to their manager through the role hierarchy. A forecast type decides what gets counted: deal amount, product revenue or quantity.

How to set up Salesforce forecasting
Setup takes four things, all in Setup under Forecasts.
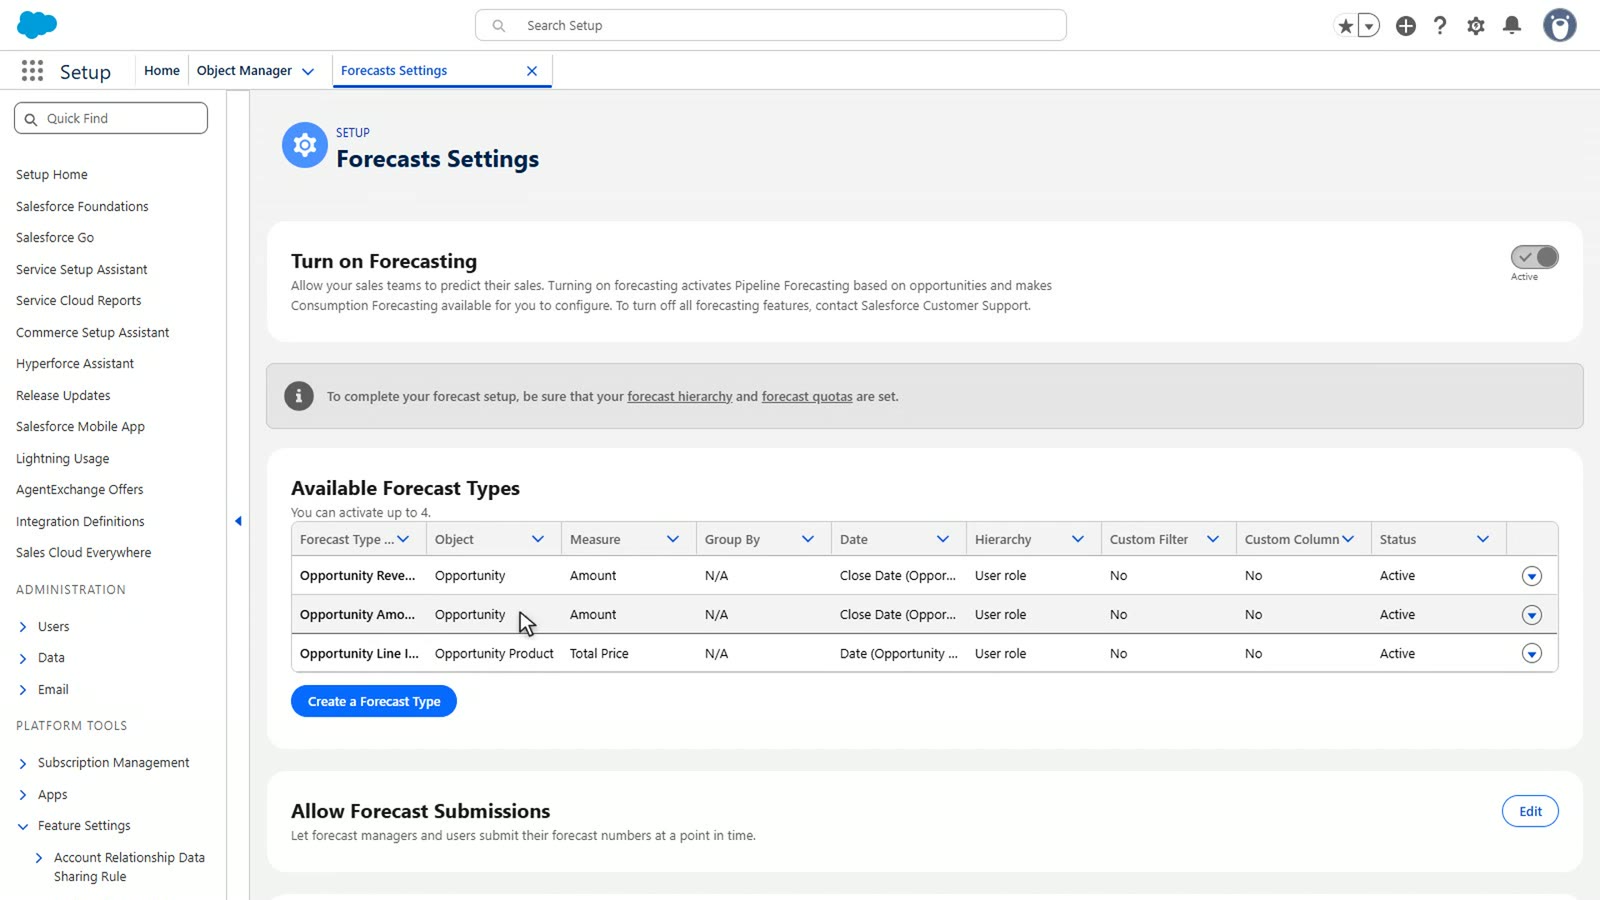
- Turn forecasting on. Open Forecasts Settings and switch on Turn on Forecasting.
- Pick a forecast type. The one in the video counts opportunity amount by close date.
- Set the forecast hierarchy. Enable each rep, and name a forecast manager for the role above them. Here, four reps roll up to Mary Adams.
- Add quotas. Each rep gets a number for each month, so the forecast has something to measure against.

How to read the Forecasts tab
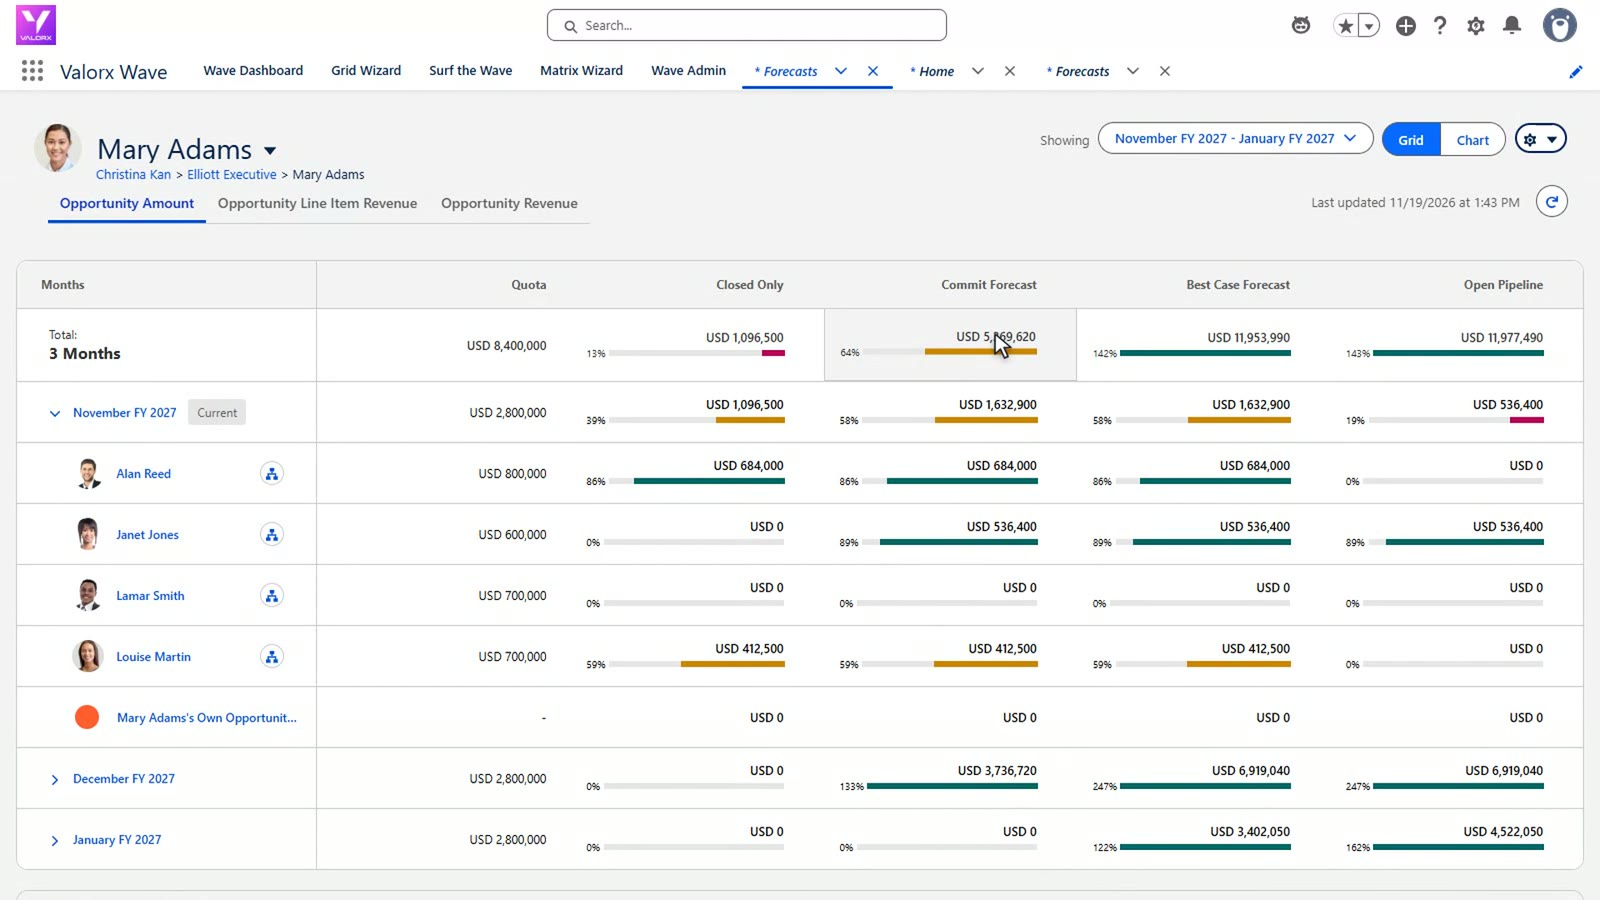
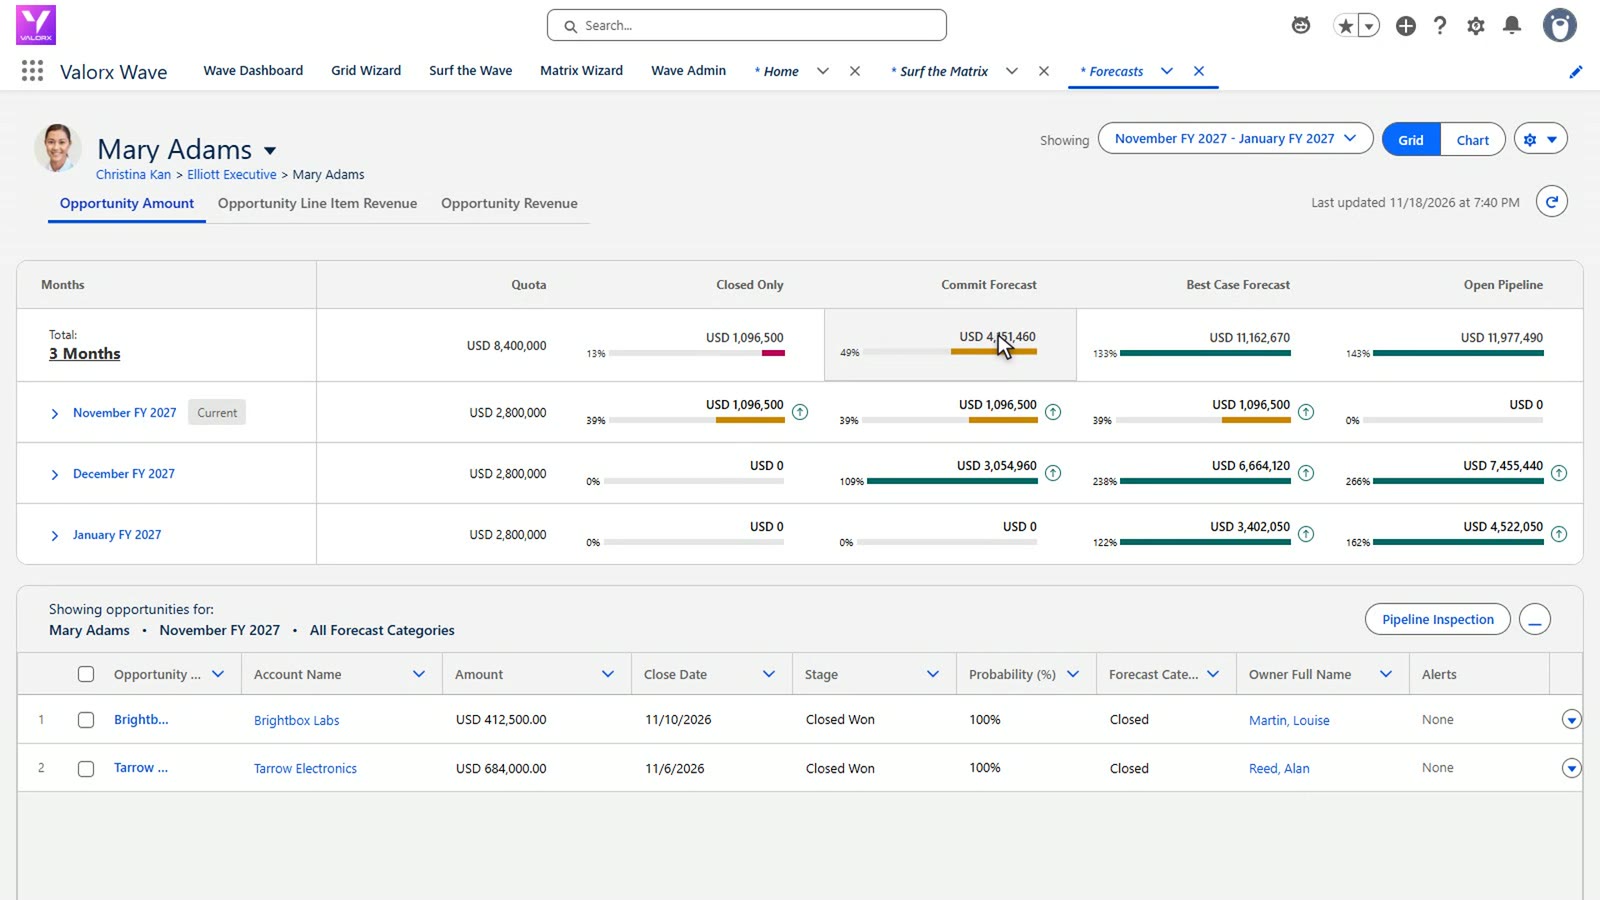
Each row is a month. Across the top: quota, closed, commit, best case and open pipeline. Commit forecast means closed deals plus commit deals. The bar under each number shows how far it is from quota. Open a month and the reps appear under their manager. Click any number and the deals behind it list below.
Where the Forecasts tab stops
The number is only as good as the deals under it. Three deals in this quarter didn't hold up.
Worked example from the video
Three deals were in the wrong place. Fixing them moved the commit forecast for the quarter.
- A commit deal past its close date. Pelican Wearables, $536,400, in Commit with a close date of November 13.
- A Best Case deal still in Discovery. Quill Robotics, $791,320.
- A commit deal with pricing still open. Hyperscale AI, $1,218,160.

You can edit a deal in that list, one at a time. A forecast review needs every rep, every deal and every month on one screen, where you can change them together.
| The Forecasts tab | With a Wave Matrix |
|---|---|
| Click a number to list the deals behind it | Every rep, deal and month on one screen |
| Spot a past close date by reading each row | A rule turns the row pink when the close date has passed |
| Edit deals one at a time | Change several deals, then save once |
| Deal amount by month | The same deals by account, by product or against a target in a custom object |
How a matrix connects more than one object
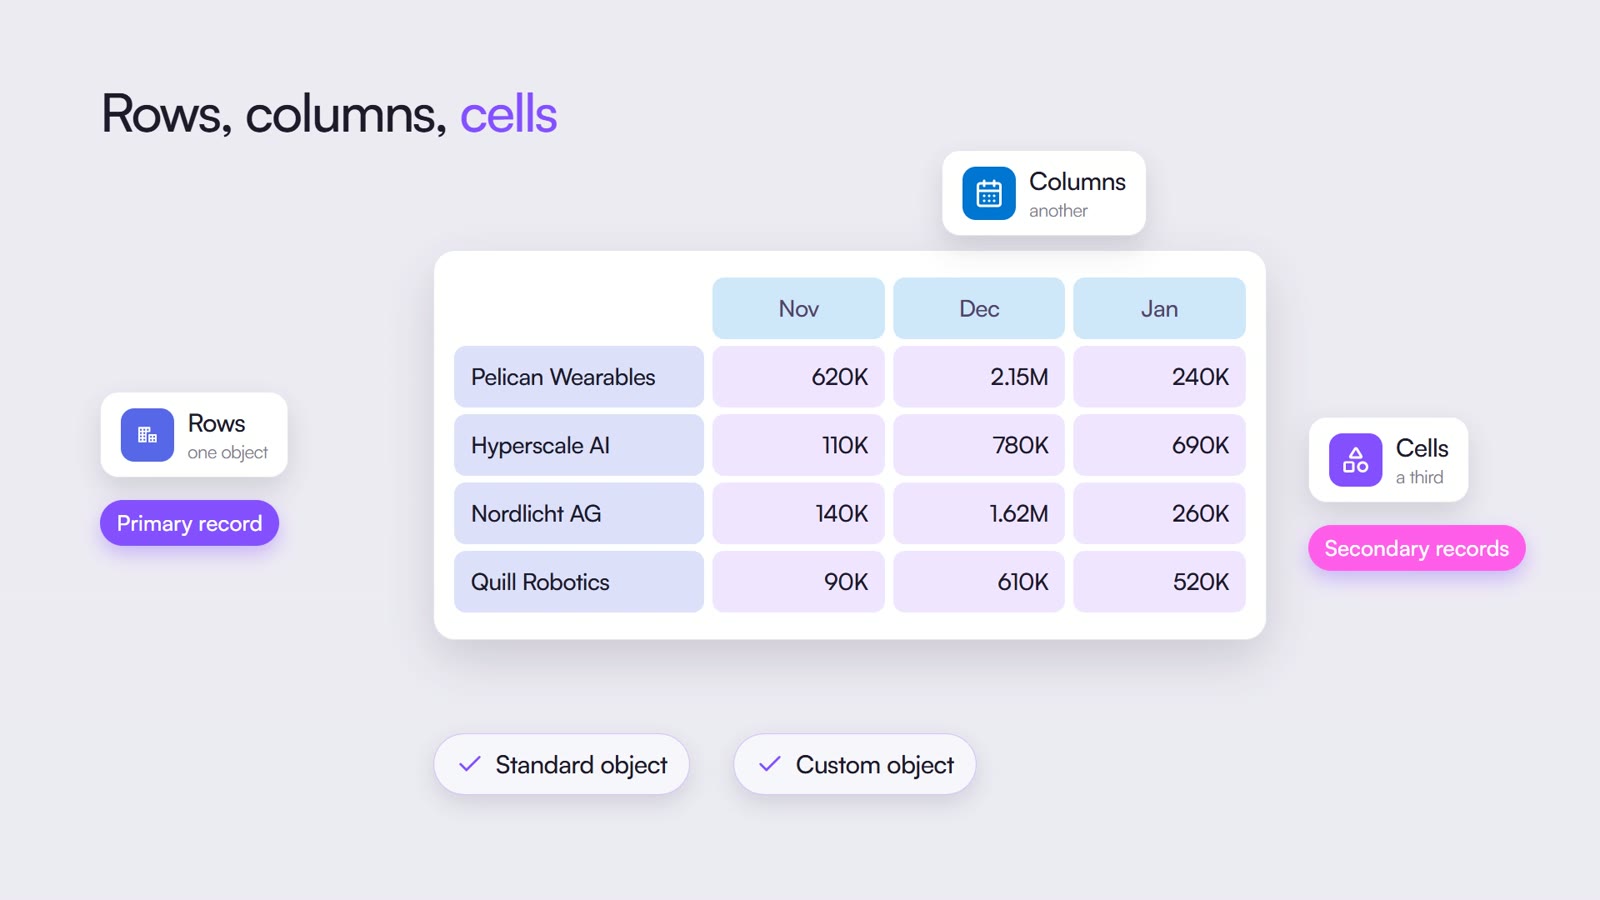
A forecast rarely lives in one object. Deals are opportunities, customers are accounts, products sit on the deal lines, and the target is often in a custom object your team built. A matrix in Valorx Wave takes its rows from one object, its columns from another and the numbers in the cells from a third.
Build the forecast review
You need Valorx Wave from the AppExchange. Everything happens in the Matrix Wizard, without code.
- Name it. Ours is Forecast Review.
- Set the rows. They come from opportunities: the rep, the deal, the forecast category, the stage and the close date.
- Set the columns. Use the close date. That becomes the timeline.
- Set the value. The amount goes in each cell.
- Filter. Open deals only, owned by the West Sales team.
- Make it readable. A color bar on forecast category, a rule that turns a row pink when its close date is before today, a rule on amount so the largest deals stand out, and a tint for each rep.
- Sort and save. Sort by rep, then by deal, and open it.
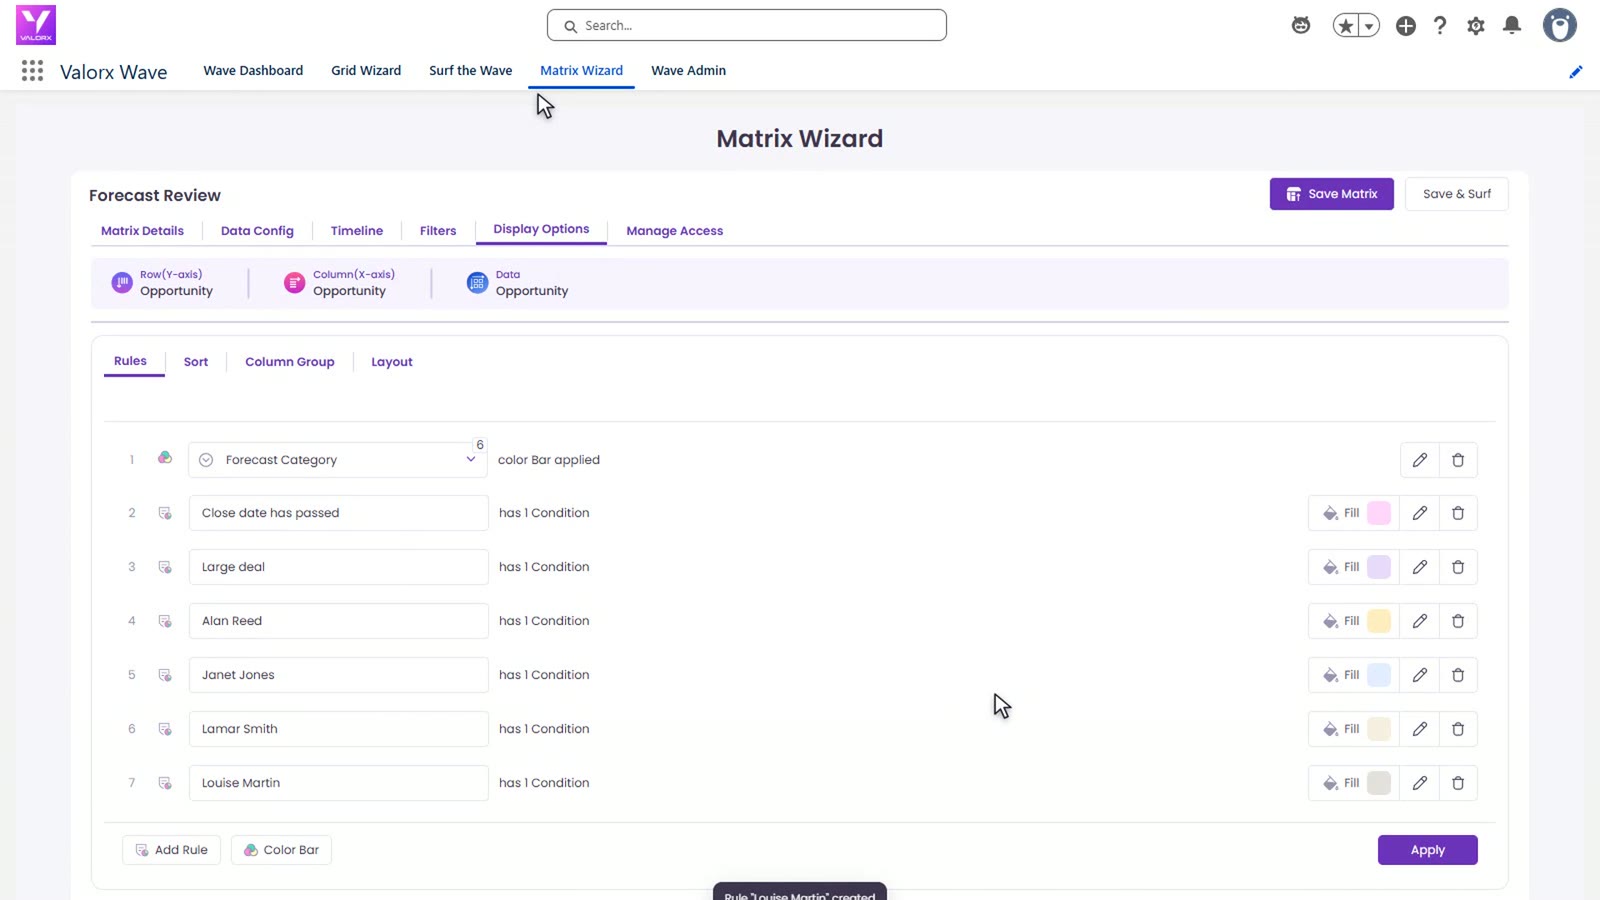

The same matrix reads monthly for the review, weekly for the deals closing now, quarterly for the number you report and yearly for the plan.
Fix the deals and watch the number change
Three changes, made in the matrix:
- Pelican's close date moves to December 4, and the pink highlight clears.
- Quill goes from Best Case to Pipeline.
- Hyperscale goes from Commit to Best Case, until pricing is agreed.
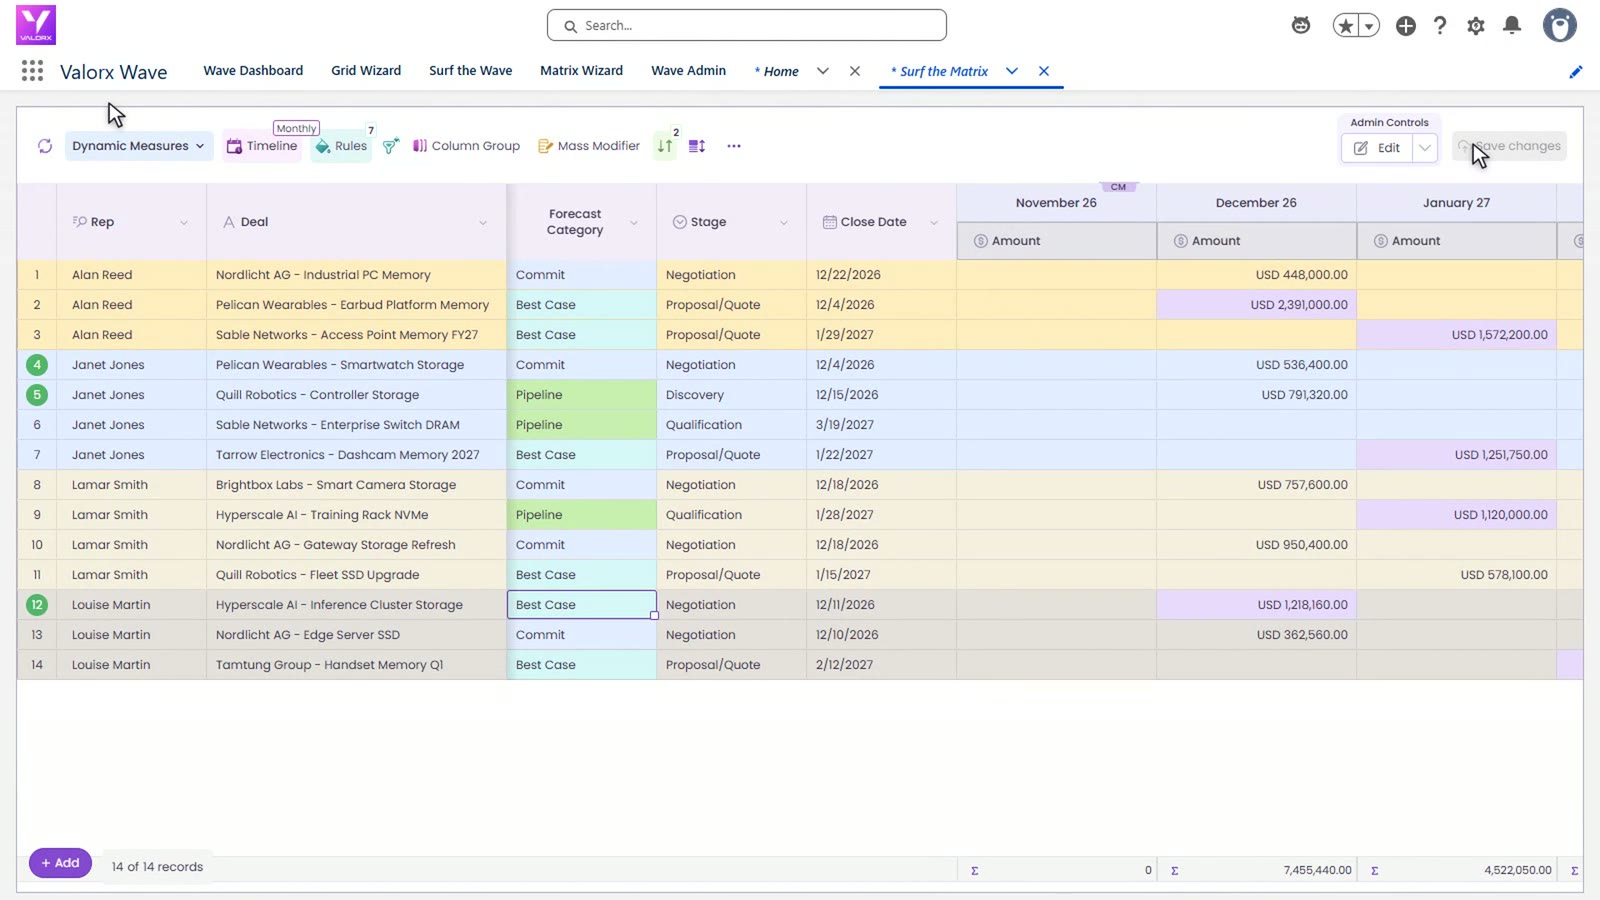
One save writes all three to the opportunities in Salesforce, under the same permissions as any other edit. Back on the Forecasts tab, commit was $5.37M and is now $4.15M. It's a smaller number, and it's one you can defend in the forecast call.
Forecast by account and by product
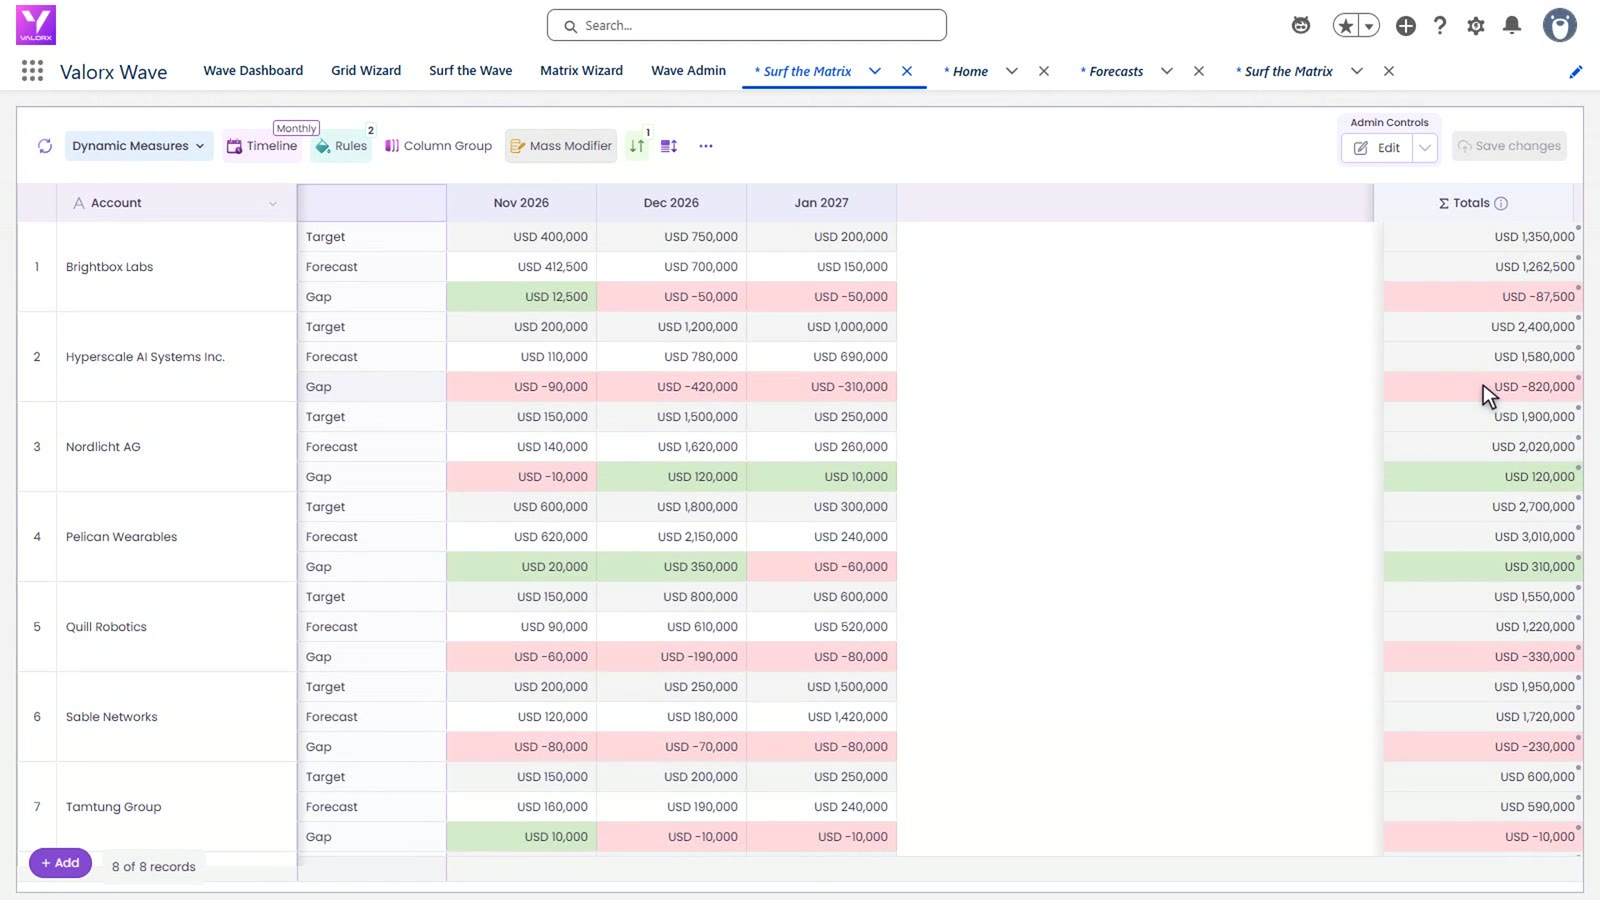
The same idea works across objects. In this matrix the rows are accounts and the cells come from a custom object, Account Forecast, with a target and a forecast for each month. A formula shows the gap. Green is above target and red is below. Pelican Wearables is $310,000 above target for the quarter. Hyperscale is $820,000 behind. Change a forecast here and it saves to the custom object.
One more view: the same deals by product and month, so you can see which products carry the quarter.

Questions this video answers
How does forecasting work in Salesforce?
Each deal has a forecast category that comes from its stage. Salesforce adds the categories up by month or quarter and rolls them up from each rep to their manager through the role hierarchy. A forecast type decides whether it counts deal amount, product revenue or quantity.
How do I set up forecasting in Salesforce?
In Setup, turn on forecasting in Forecasts Settings, pick a forecast type, enable users and name forecast managers in the Forecasts Hierarchy, then add quotas for each rep and period.
What does commit forecast mean in Salesforce?
Commit forecast is the total of closed deals plus deals in the Commit category for the period.
Can I edit deals from the Forecasts tab?
Yes, one at a time in the list under the forecast. The review in the video uses a matrix so several deals across reps and months can be changed and saved together.
Can a forecast use a custom object?
In the video, a matrix reads a target and a forecast for each account and month from a custom object, shows the gap with a formula, and saves edits back to that object.
Keep going
- Previous video: How to Manage Changing Customer Demand in Salesforce
- Related: How to Run a Weekly Pipeline Review in Salesforce and How to Build Pivot Tables in Salesforce
- Try it yourself: the Forecast Rollup walkthrough
Recorded in a Salesforce demo org with demo data, restored after recording. Company names in the video are fictional demo accounts.
Want to see it on your own forecast? Book a demo and we'll build the first matrix with you on the call.




Choose the workflow you need:
Try Wave in browser Extension

Try Wave in Salesforce

Try Fusion In Excel

Enhancing Salesforce for industry leaders