How to Manage Changing Customer Demand in Salesforce (No Code)
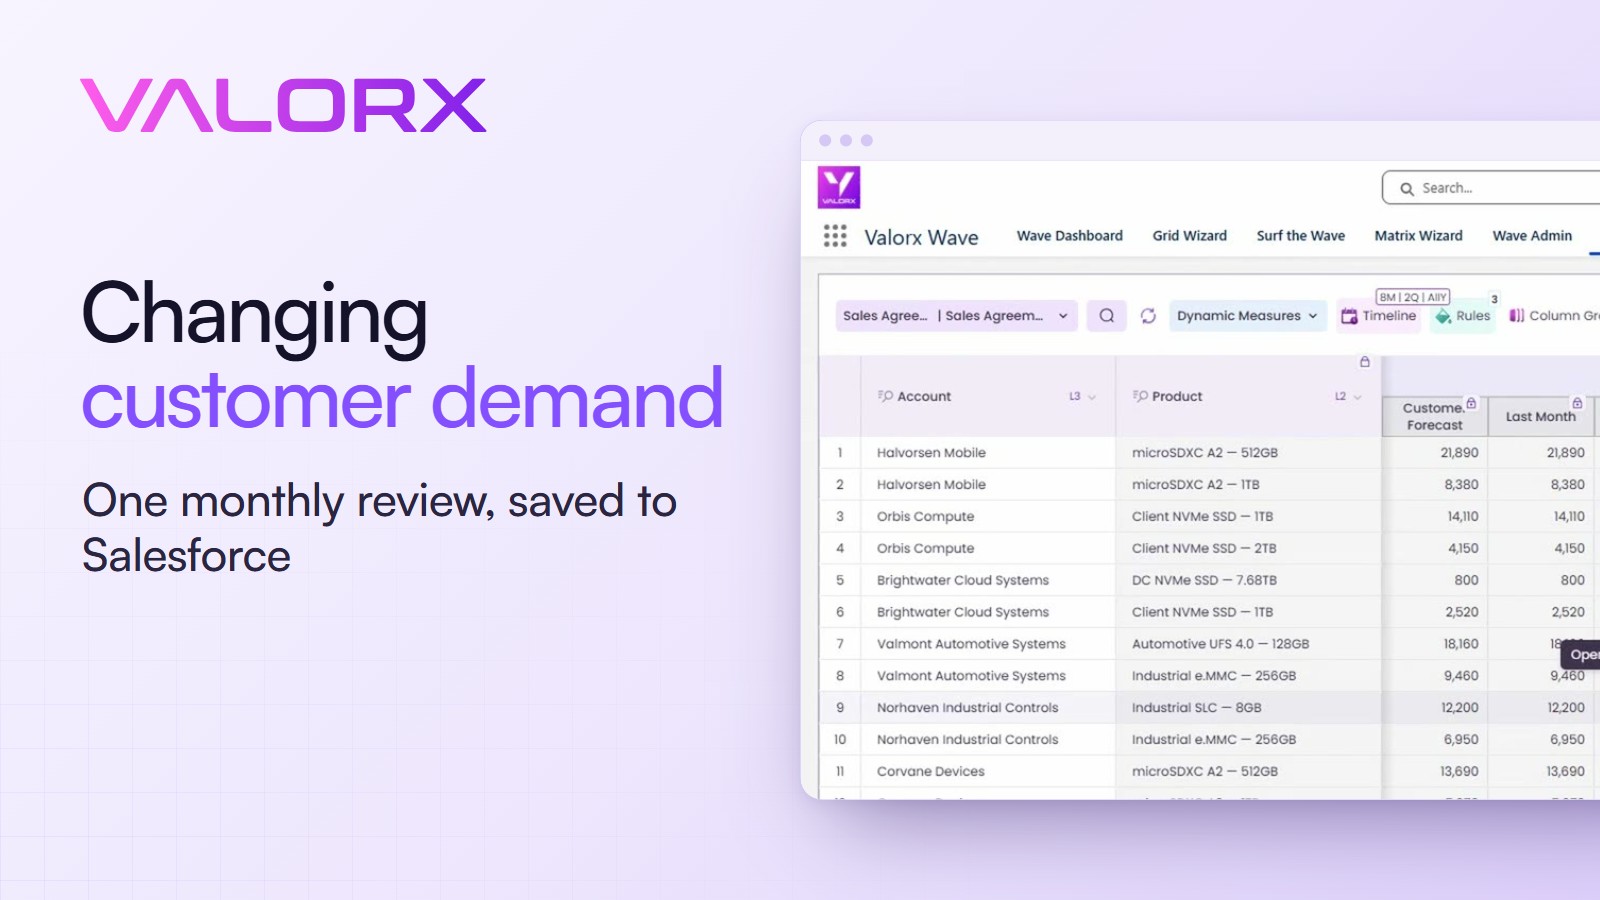
To manage changing customer demand in Salesforce, put every customer's monthly forecast next to last month's number, flag what moved, and update the plan in the same place. This guide follows the video: six customers, 13 products and 18 months in one Wave Matrix.
Jump to a chapter
What you'll build
- One monthly demand review for every customer
- This month's forecast beside last month's
- Rules that flag jumps, gaps and backlog
- A plan you edit and save to the agreements
- No code, built in the Matrix Wizard
- Video length: 7 minutes
What the finished review looks like
Every customer and product is a row. For each month you see what the customer sent, last month's number, the partner overrides and the plan you commit.

Three views of the same demand
Each month, three numbers arrive for the same product: the customer's own forecast, and an override from the OEM and from the ODM. The review is deciding which one the plan should follow.

Why the plan falls behind
The review itself isn't hard. The numbers that show what changed just sit in different places. Here's one customer's agreement, where January reads ten times last month's figure. It's there, but only if you go looking.

- For the next customer, you open the next agreement.
- What actually shipped sits on the orders, one line per shipment.
- The Forecasts tab shows revenue by month, not a customer's demand by product.
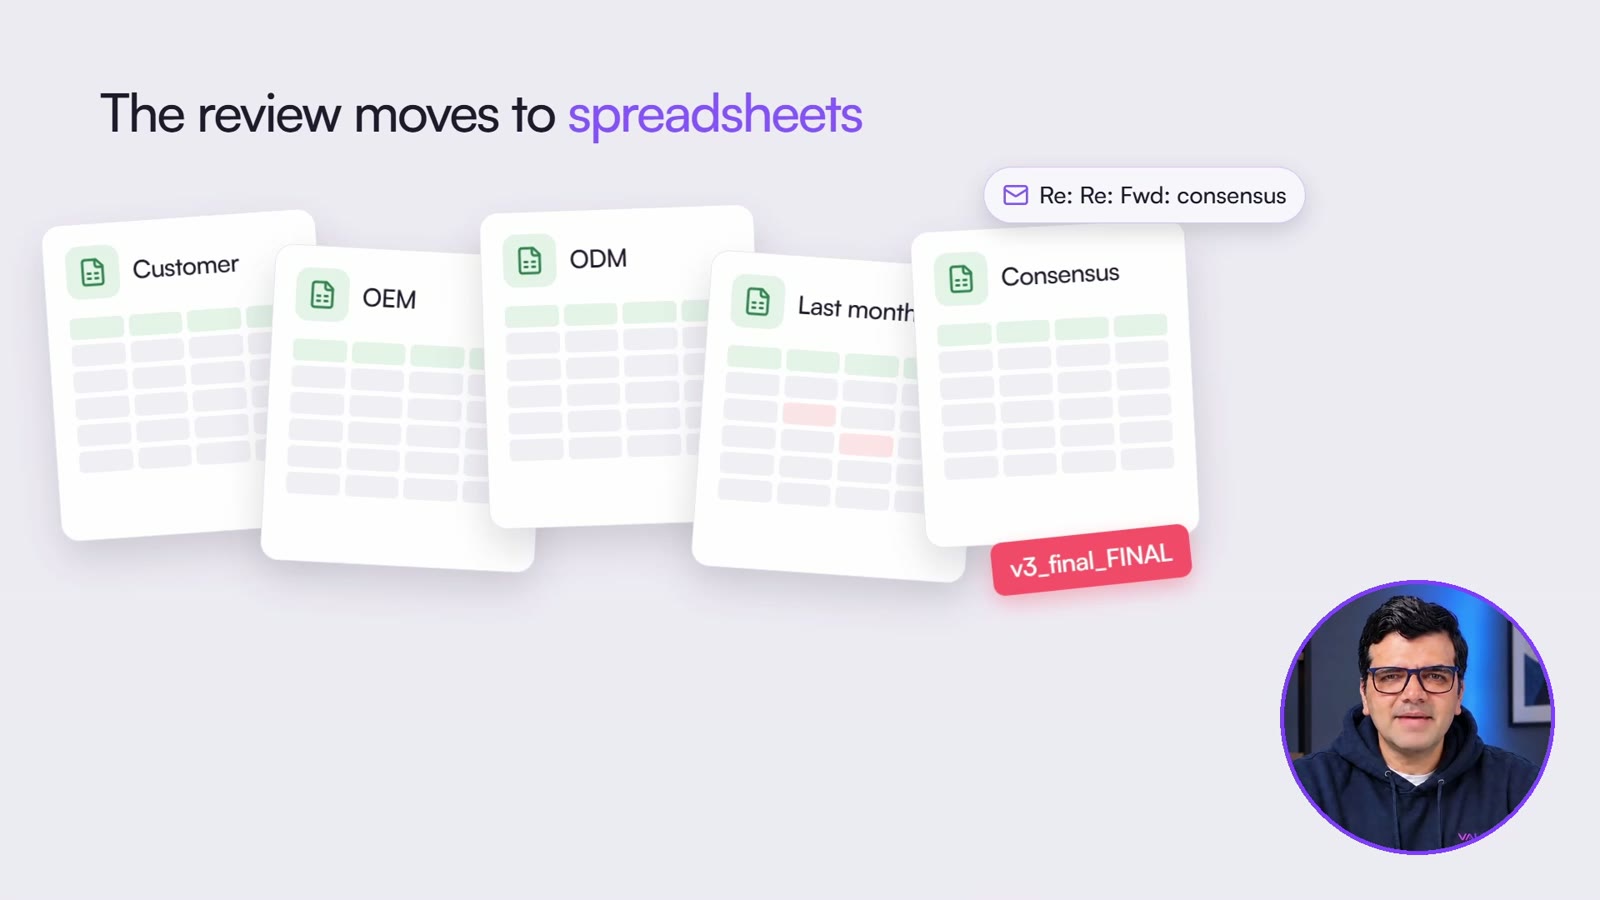
So the review moves to spreadsheets, and the agreed numbers get keyed back in one agreement at a time. By then the customer has sent next month's forecast.
| The usual way | With a Wave Matrix |
|---|---|
| Open each customer's agreement in turn | Every customer and product in one view |
| Compare this month with last month by eye | A change column, and rules that color the jumps |
| Five spreadsheets and a consensus email | Customer, OEM, ODM and last month side by side |
| Key the plan back in, one agreement at a time | Type the plan in the cell and save |
The idea that makes it work: Dynamic Measures
A measure is a number field from your records, shown in every cell. You choose the measures when you build the matrix, and anyone using it can switch them on and off without changing the build.
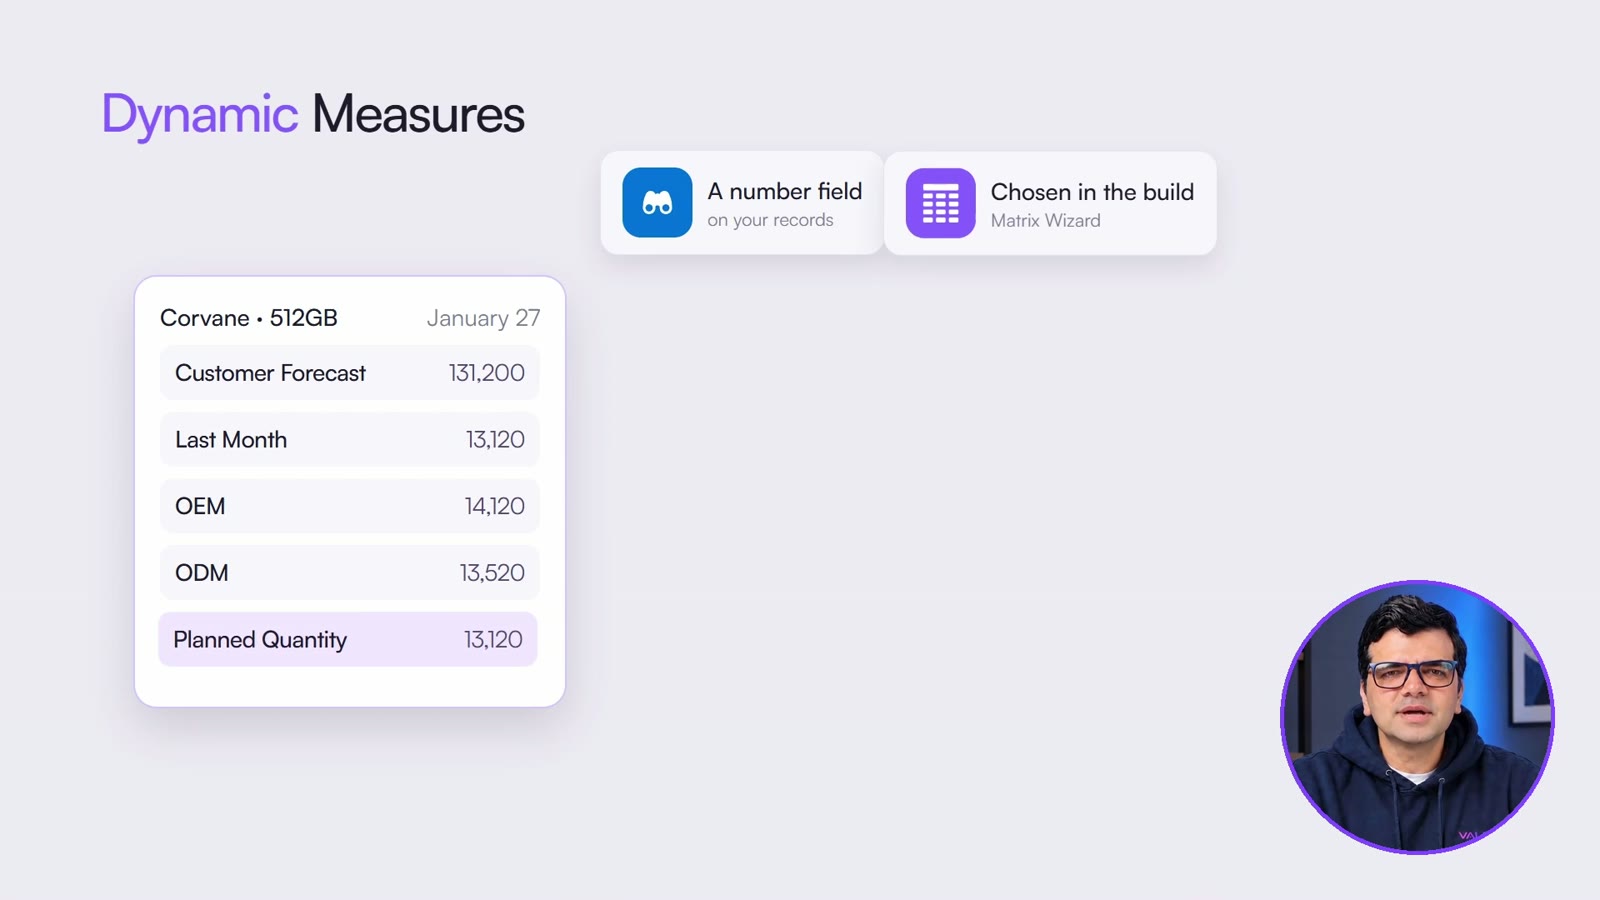
If the number you need doesn't exist yet, create it as a formula field in Salesforce and add it as a measure. In the video that's Change vs Prev Month: the customer's quantity minus the previous month's.
Build the monthly demand review
You need Valorx Wave from the AppExchange. Everything happens in the Matrix Wizard.
- Name it. Ours is Monthly Demand Review.
- Set the rows. The object is the product schedule. The row labels are the customer account, then the product.
- Set the columns. Use the schedule's start date. That becomes the timeline.
- Pick the measures. The customer's quantity, the OEM and ODM overrides, last month's figure, shipments, backlog, the planned quantity and the change field.
- Set up each measure. Rename the customer's quantity to Customer Forecast. Make the customer, OEM, ODM and last month figures read only. Keep planned quantity editable and add a total. Start shipments, backlog and the change field hidden.
- Telescope the timeline. The next eight months one by one, then quarters, with the last four months visible and read only.
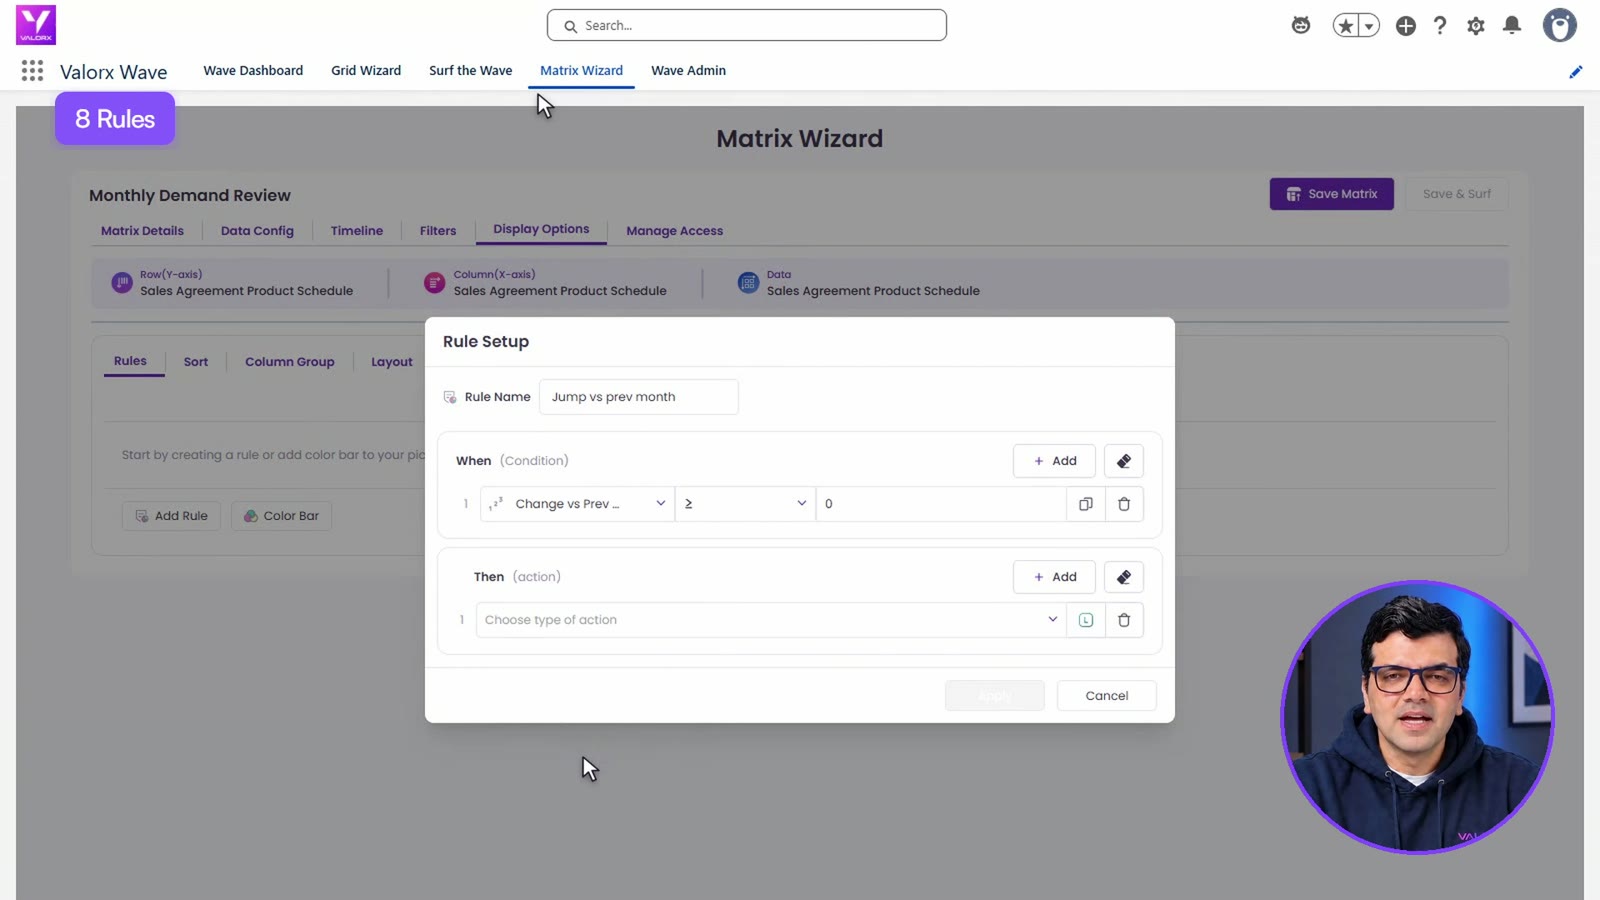
- Add rules. A big jump against last month, a missing forecast and a backlog, each in its own color.
- Save and surf. Pick the demand plans to review.
The review, customer by customer
Four things turned up in the demo review. Each needed a different call.
Worked example from the video
One customer was shipped short in October and asked for the difference as backlog. Their December forecast rose too.
- A typo. One January forecast was up ten times: 131,200 against 13,120. It's an extra zero. The plan stays, and the account manager confirms with the customer.
- No forecast. One customer sent nothing for April and May. The plan stays at last month's figure, which the OEM number supports.
- A backlog. December's plan takes the new forecast plus the 3,200 cards not yet scheduled.
- A real spike. One May figure went from 855 to 1,495. The OEM and ODM numbers agree, so the plan follows it.
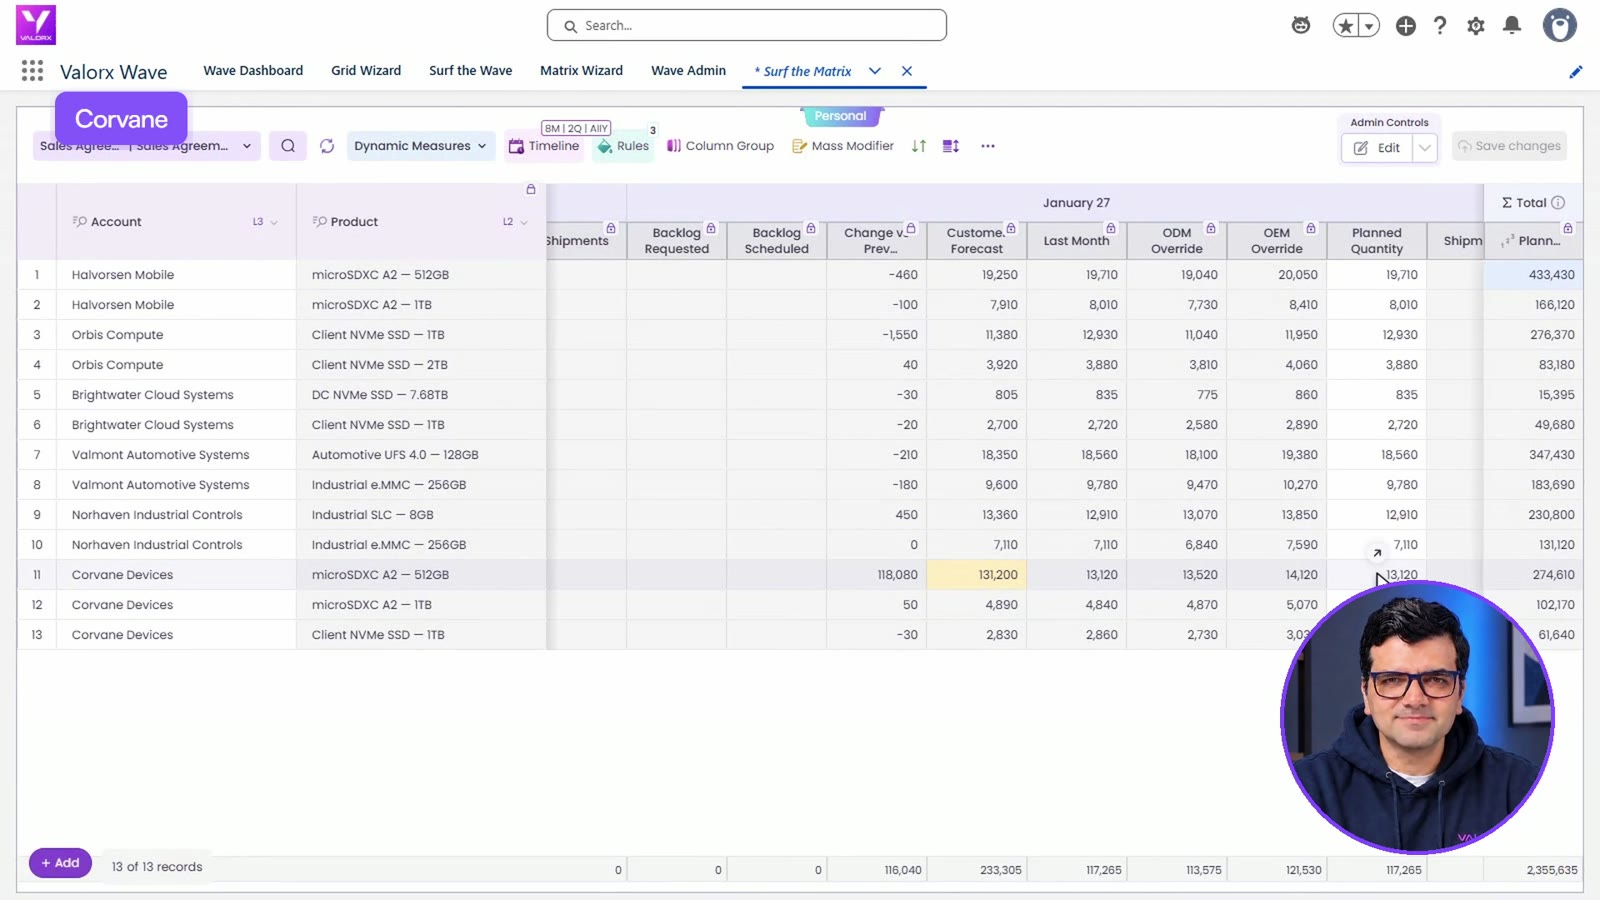
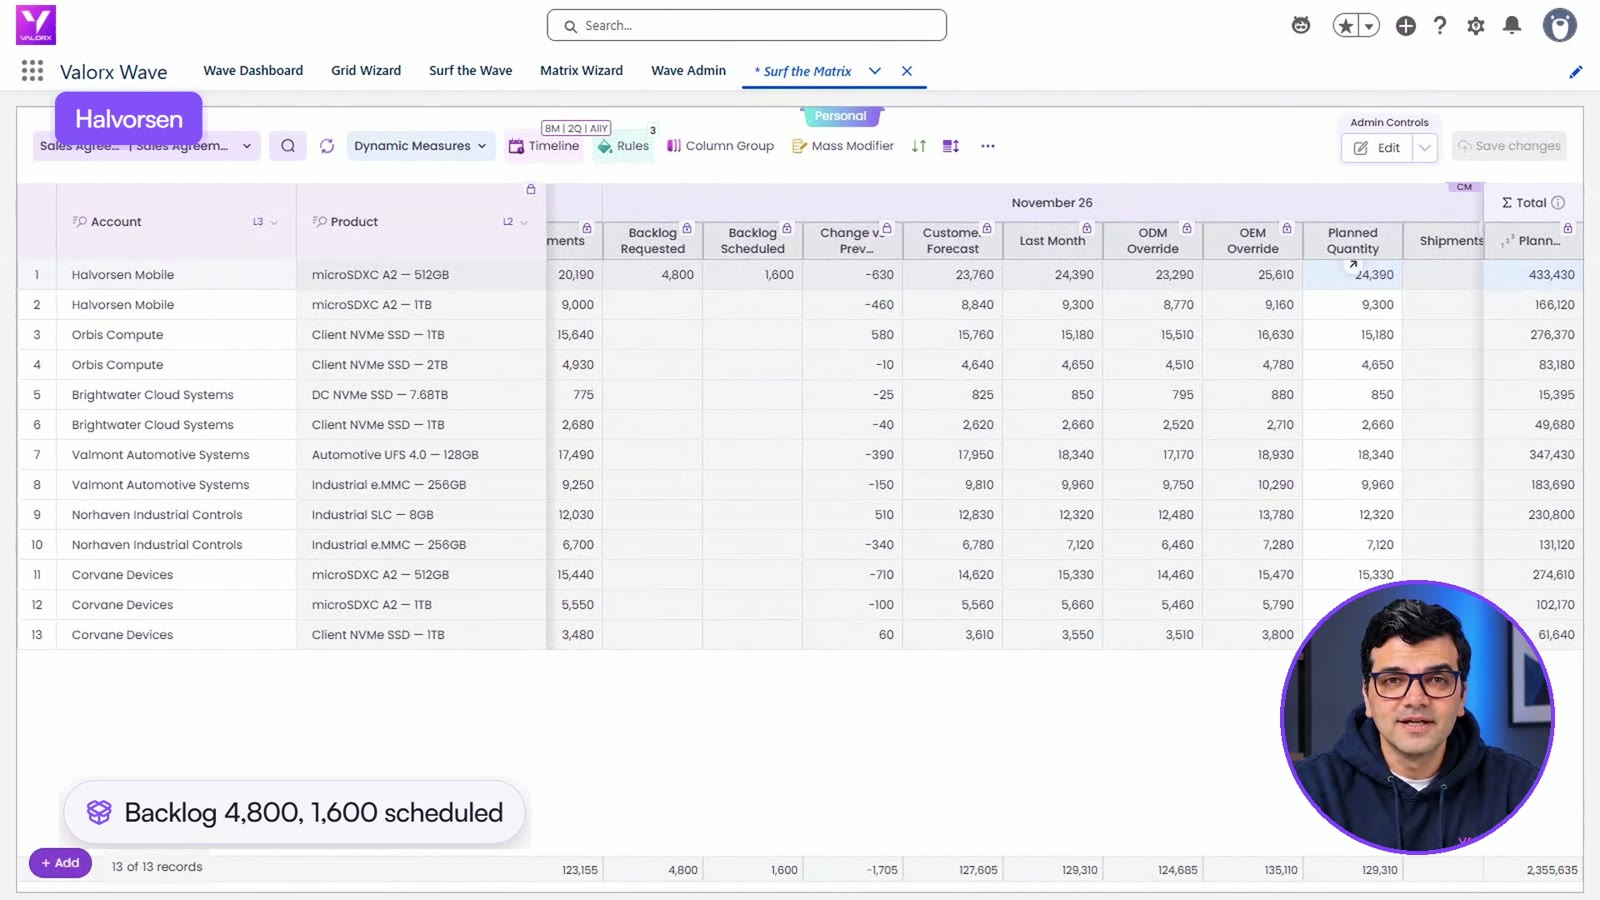
Save, and the summary shows the schedule records it updated on the sales agreements. Your validation rules still apply.
The same numbers at any grain
The same records read by quarter for the business review and by year for the contract. A weekly call-off agreement shows week by week, and shipments from the orders show day by day. The same pattern covers a product forecast, a revenue forecast and a sales plan.
Questions this video answers
How do you forecast customer demand in Salesforce?
With sales agreements, each customer's plan holds a schedule row for every product and month, with the planned quantity and the customer's forecast. The review in the video puts those rows for every customer into one matrix, so the plan can be compared and changed in one place.
How do I see what changed in a customer's forecast since last month?
Show last month's figure beside this month's, and add a formula field for the difference. A rule can then color any cell where the jump is large.
What is a telescoping timeline?
It shows near-term periods in detail and later periods rolled up. In the video, the next eight months appear one by one and everything after that by quarter.
Can I keep the customer's numbers from being overwritten?
Yes. Each measure can be set to read only. In the video the customer, OEM, ODM and last month figures are read only, and only the planned quantity is editable.
Keep going
- Previous video: How to Build Pivot Tables in Salesforce
- Read: Demand sensing vs. demand forecasting and Smarter rolling forecasts for manufacturers
- Try it yourself: the Forecast Rollup walkthrough
Recorded in a Salesforce demo org with demo data, restored after recording. Customer names in the video are fictional demo accounts.
Want to see it on your own agreements? Book a demo and we'll build the first matrix with you on the call.





Choose the workflow you need:
Try Wave in browser Extension

Try Wave in Salesforce

Try Fusion In Excel

Enhancing Salesforce for industry leaders