Salesforce Matrix Reports, Grids and Editable Matrices: Which View Do You Need?
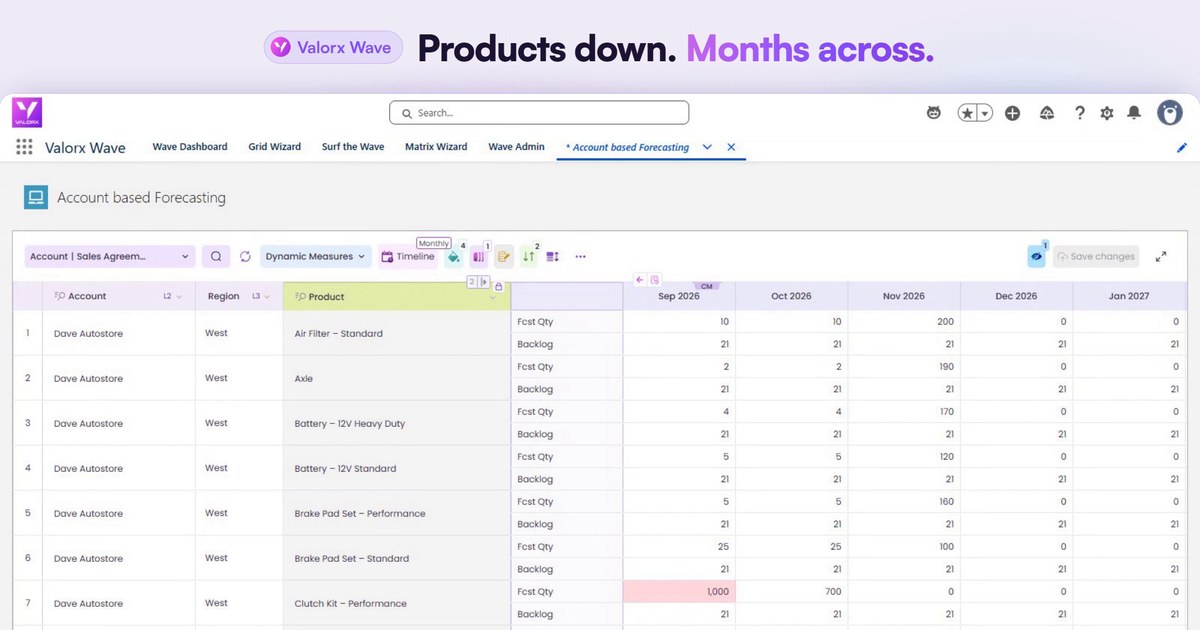
- The real choice is records vs totals. Some work means changing individual records. Other work means planning aggregated values, such as pipeline by rep by month.
- A Salesforce matrix report groups and summarizes data across rows and columns for analysis. Its cells are calculated from the records underneath.
- A matrix is not necessarily editable. In a matrix report, a summary cell is a calculation. To change it, you change the records behind it.
- A Valorx Wave Matrix uses a similar row and column layout, and also lets you change supported aggregate values and write the change back to the underlying records.
- A grid is for record-level work: one row per record, edited in place.
- Many teams use both: spot the number in a matrix, fix the records in a grid.
Your VP asks for pipeline by rep by month. A matrix report gives you that in a few minutes. Then come the follow-ups: raise Acme's March forecast from $100,000 to $120,000, and fix the deals still sitting in Discovery with close dates in the past.
The first ask is about totals. The second is about records. That split decides which Salesforce view does the job, and it's what this guide covers: how matrix reports work and how to build one, where they stop, and when a grid or an editable matrix takes over.
What is a matrix report in Salesforce?
A Salesforce matrix report groups records by both rows and columns and summarizes the values where they meet. For example, opportunities grouped by owner down the side and close month across the top, with the sum of Amount in each cell, plus subtotals and a grand total.
It's one of the report formats in Salesforce, alongside tabular and summary reports. A summary report groups rows only. A matrix report adds column groupings, which is what turns it into a two-dimensional table.
How to create a matrix report in Salesforce
In the Lightning Report Builder, you don't choose a matrix format. The format updates automatically as you group data, and a report grouped by both rows and columns is a matrix report. You can group by up to two rows and two columns. (Salesforce Help)
Here's an example: open opportunities by owner, by close month.
- On the Reports tab, click New Report. (Or, on the Analytics tab, select Create | Report.)
- Search for and select the Opportunities report type, then click Start Report.
- In Filters, set Close Date and Opportunity Status to the range you want, such as Current FQ and Open.
- In the preview, click the arrow next to Opportunity Owner and select Group Rows by This Field.
- Click the arrow next to Close Date and select Group Columns by This Field.
- In the Close Date grouping, hover over Group Date By and choose a calendar or fiscal period, such as Calendar Month.
- On the Amount column, select Summarize and choose Sum.
- Optional: at the bottom of the preview, turn off Detail Rows to show only the summarized grid. Subtotals and Grand Total have their own toggles.
- Click Save & Run, name the report and choose a folder.

Two tips from Salesforce
- For matrix reports, the builder preview sometimes shows different results from the actual report, so check the run view.
- To group by ranges, such as deal size, add a bucket column (for example Small, Medium, Large on Amount) and group columns by it. (Source: Trailhead: Group and Categorize Your Data)
What a matrix report is built for
A matrix report is an analysis tool. It's the right choice when you want to compare a measure across two dimensions, share it on a schedule, or put it on a dashboard. Two things are worth knowing before you plan around one:
- Row-level detail has a limit. Matrix reports that return more than 2,000 rows don't show details. You can still view the report with details hidden, and use the Details Only export to see every record. (Source: Reports and Dashboards Limits; Knowledge Article 000384725)
- The layout lives in the report definition. Groupings and date granularity, such as months or quarters, are set in the report builder. Changing them means editing the report, which is quick for whoever owns it, and a request for everyone else.
Salesforce matrix report limits at a glance
| Limit | Value |
|---|---|
| Rows a report displays | 2,000. Export the report to see more |
| Matrix report with more than 2,000 rows | Details don't show; view with details hidden or use the Details Only export |
| Groupings shown with Show Details off | First 2,000 groupings (summary and matrix reports) |
| Summarized values, one summary formula | Up to 400,000 values in up to 2,000 rows and 200 columns |
| Summarized values, two summary formulas | Up to 200,000 values in 1,414 rows and 141 columns |
| Report builder preview | 20 rows for summary and matrix reports |
| Salesforce mobile app | Reports with groupings are converted to tabular reports |
Source: Reports and Dashboards Limits and Allocations, Salesforce Help.
Can you forecast with a matrix report? For review, yes. It can summarize pipeline amounts, quantities or other measures by product, owner and period. For adjusting a forecast, you need a view that edits.
When the change is record by record: grids
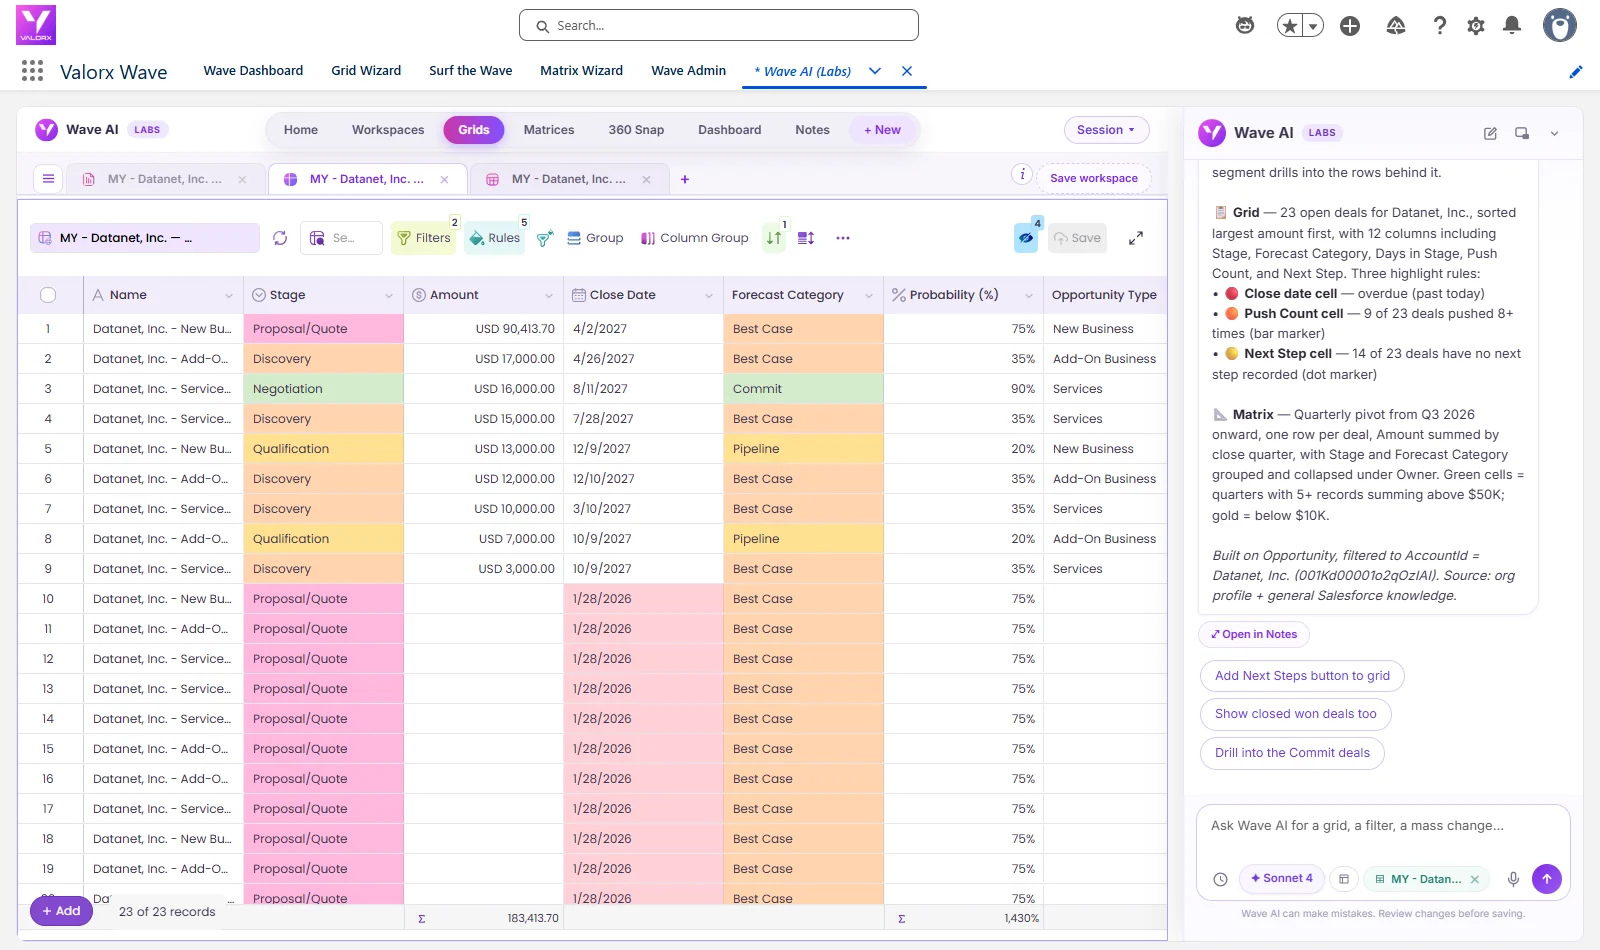
Back to the second follow-up: the deals still in Discovery with past close dates. That isn't a total to adjust. Each deal needs its own fix, which makes it grid work: one row per record, one column per field.
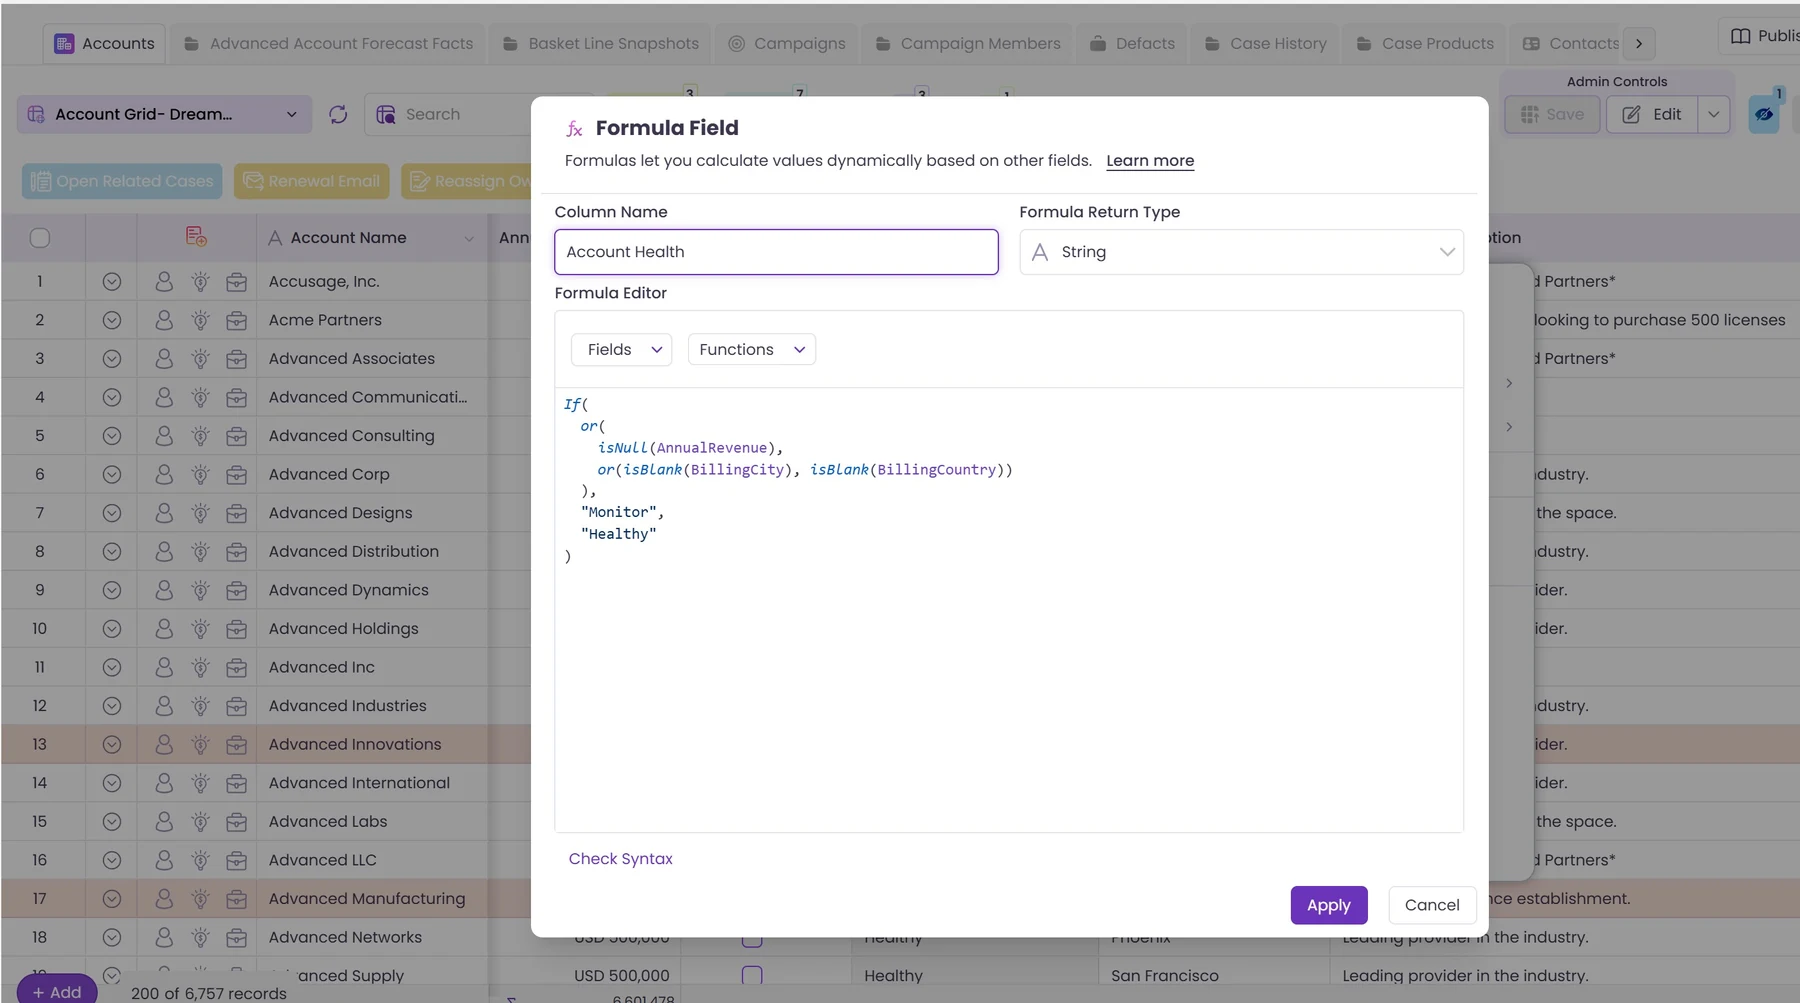
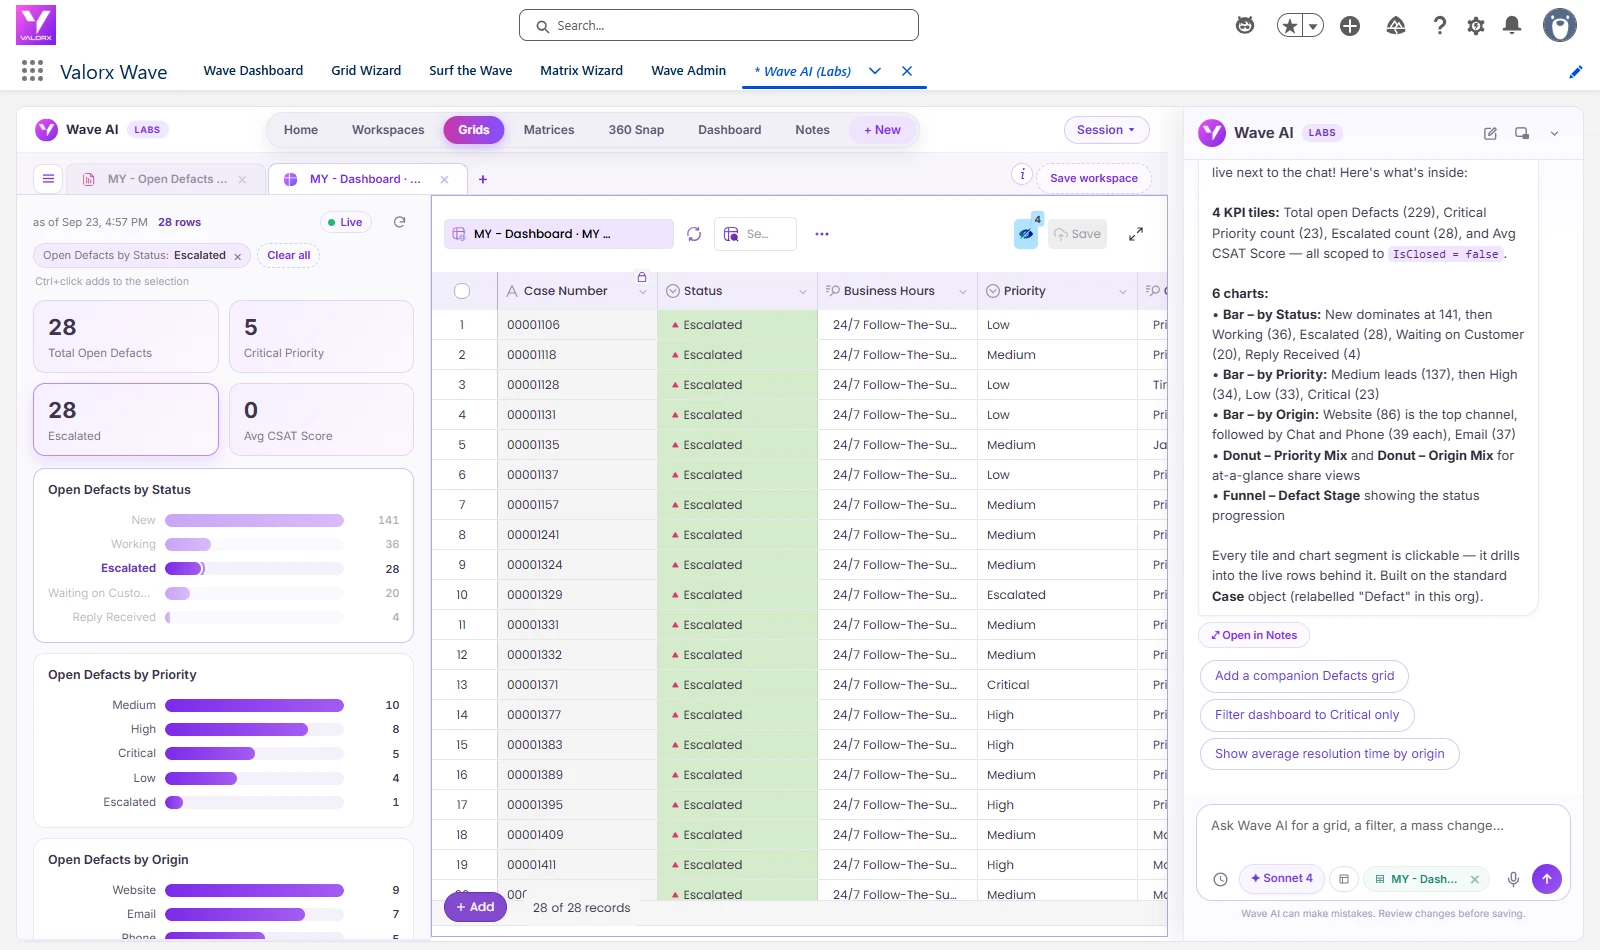
Salesforce list views support inline editing for this. A Valorx Wave grid is a spreadsheet-style grid inside Salesforce built for doing it in bulk. Filter to open opportunities in Discovery with a past close date, select the rows, set a new close date across all of them with Mass Modifier, review the pending changes and save. Formula columns, colour rules and related lists are there when you need them.
Read more: How to clean up your Salesforce pipeline in 15 minutes.
Try it: a forecast rollup in a Wave grid
Opportunity amounts rolled up by rep and period, with the deals underneath editable in the same view.
When you need an editable matrix
The first follow-up is different. Raising Acme's March forecast is a change to a total, not to one record. Planners make changes like this all the time: a forecast by product by month, a quota split by rep by quarter, a manager's adjustment to a pipeline figure. A matrix report shows those totals but won't take the change.
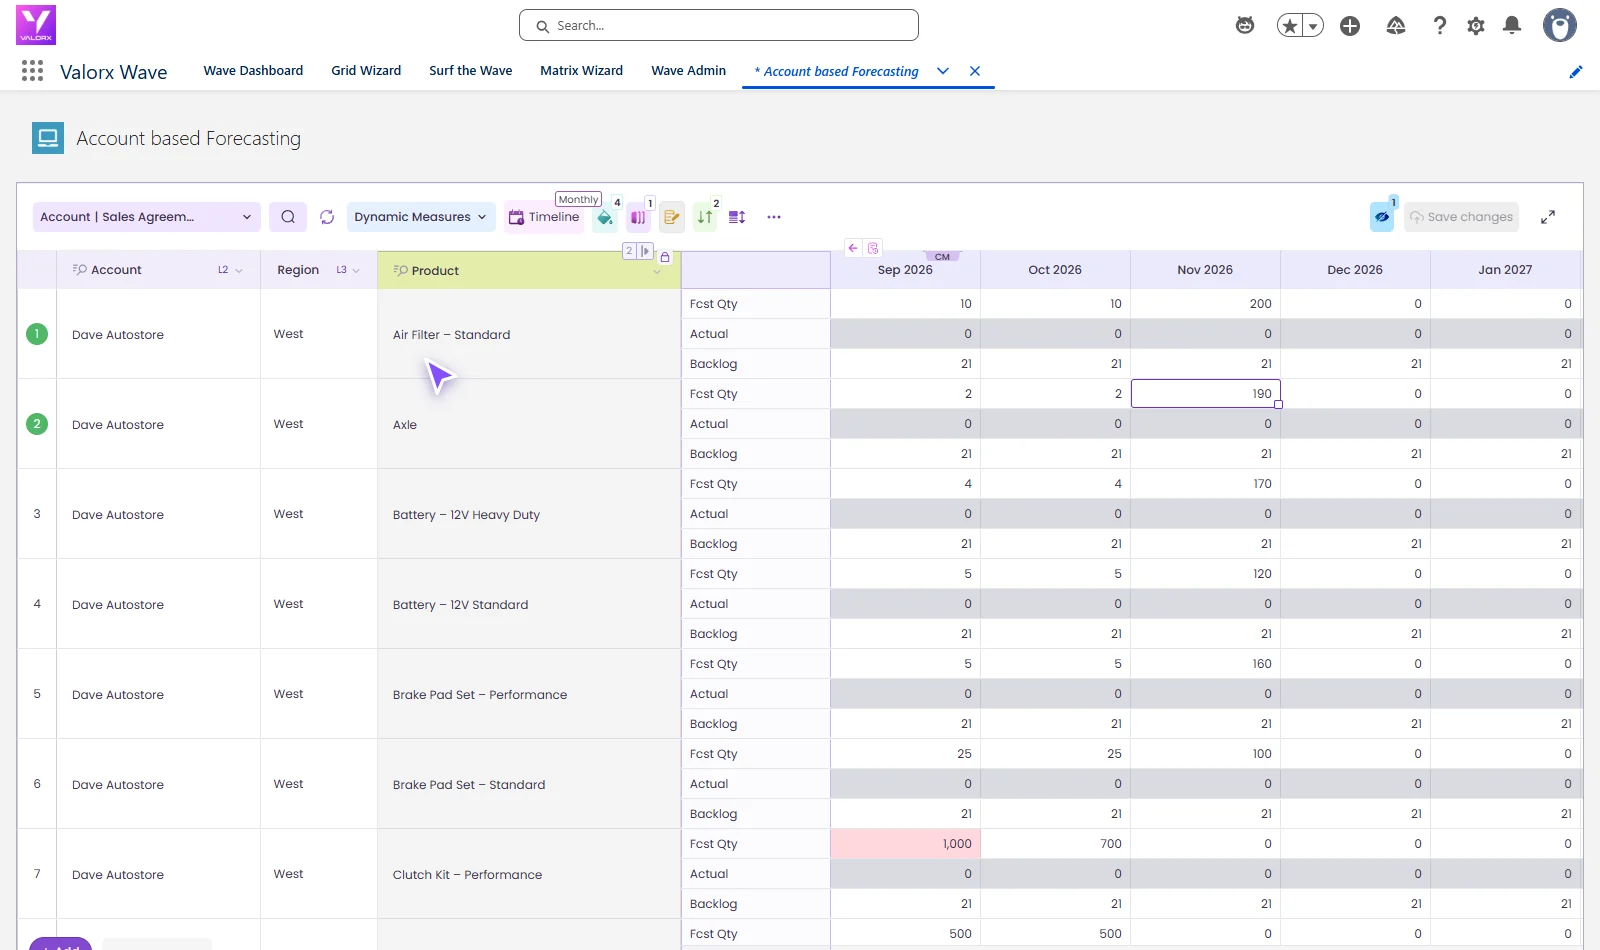
A Valorx Wave Matrix is built for this. It runs inside Salesforce and uses a similar layout: records grouped down the side, a date, picklist or lookup field across the top, and a summarized value in each cell. The difference is that supported aggregate values can be changed, and Wave writes the change back to the underlying records.
What happens when you edit a total
Say the cell for Acme, March shows $100,000. It sums two opportunities:
| Opportunity | Amount before | Share of total |
|---|---|---|
| Acme Renewal | $60,000 | 60% |
| Acme Expansion | $40,000 | 40% |
| Cell total | $100,000 |
You change the cell to $120,000. With weighted distribution, each record keeps its share of the total:
| Opportunity | Amount after |
|---|---|
| Acme Renewal | $72,000 |
| Acme Expansion | $48,000 |
| Cell total | $120,000 |
You can also choose to distribute the change evenly across the records instead. Nothing is written until you save. A save summary then shows which records changed, and each change saves to Salesforce under your existing permissions.
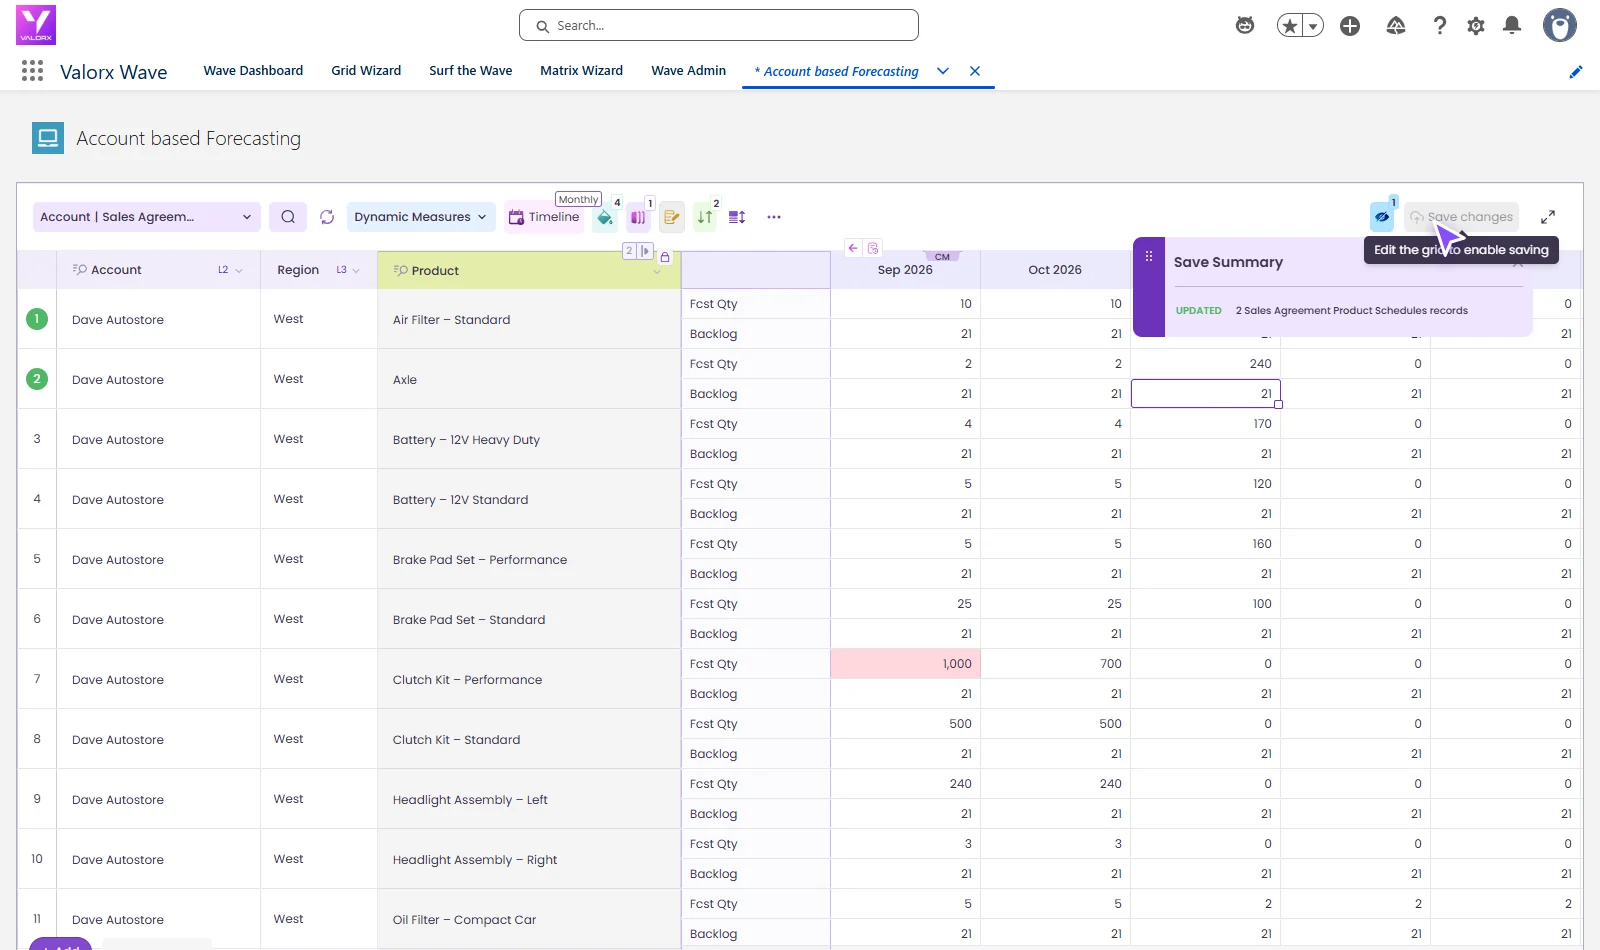
Wave Matrix also switches the timeline between days, weeks, months, quarters and years at runtime, on a fiscal or calendar year, and can join up to three related objects, such as account, sales agreement and product.
Read more: How to build your first Matrix.
Watch: account-based forecasting in a Wave Matrix
Account-based forecasting in a Wave Matrix, inside Salesforce.
What we've seen in practice: CMC's monthly forecast
CMC, one of the largest steel manufacturers in North America, forecasts demand for fabricated steel across SKUs, regions and periods in Salesforce Manufacturing Cloud. Before Wave, regional managers exported forecast data to Excel, the planning team merged six regional spreadsheets by hand, and the forecast reached the S&OP review about 10 days stale.
CMC used both views. The grid came first. In the proof of concept, a CMC regional sales manager opened 200+ SKUs in one Wave grid inside Salesforce, drag-filled volume updates across a quarter, switched from weekly to monthly with one click and saved back to Manufacturing Cloud. It took under 2 minutes. The same workflow in the native interface would have taken over 20 minutes.
Wave Matrix then gave the planning team product, region, customer and period in one view. The result was a 75% shorter monthly forecast cycle, with forecast updates 10x faster in the proof of concept.
CMC runs Manufacturing Cloud, but the pattern carries over to Sales Cloud: totals by owner and period on top, the opportunities underneath.
Matrix report vs grid vs editable matrix
| Salesforce matrix report | Valorx Wave grid | Valorx Wave Matrix | |
|---|---|---|---|
| Built for | Analyzing and sharing summarized data | Editing individual records in bulk | Planning and adjusting summarized values |
| A row is | A grouping, such as an owner | One Salesforce record | A grouping, such as an account or product |
| A cell holds | A calculated summary | One field value | A summarized value |
| Changing a cell | Change the underlying records | Edit the value directly | Edit supported aggregate values; Wave distributes the change to the records |
| Changing the layout | Edit groupings and date granularity in the report builder | Users adjust filters and columns, if the designer allows | Switch days to years at runtime; groupings set in the Matrix Designer |
| Objects | The objects in its report type | One object, plus up to six related lists | Up to three related objects |
| Where it runs | Salesforce | Inside Salesforce (managed package) | Inside Salesforce (managed package) |
Swipe to see all columns →
Which view do you need?
Start from the job, and ask whether you're changing records or changing totals. Try it on five common jobs.
Share pipeline by owner by month with leadership
Better together
Spot low totals in Wave Matrix, fix the underlying records in a grid, and keep your reports accurate, all inside Salesforce.
Wave Matrix is available with Wave Pro.
Frequently asked questions
What is a matrix report in Salesforce?
A matrix report groups records by both rows and columns and summarizes the values where they meet, with subtotals and a grand total. It's used to compare a measure across two dimensions, such as pipeline by owner by month.
How do you create a matrix report in Salesforce?
In the Lightning Report Builder, click New Report, pick a report type and click Start Report. Group rows by one field and columns by another, then summarize a numeric field such as Amount. The report becomes a matrix once it has both row and column groupings, up to two of each.
What is the difference between a summary report and a matrix report?
A summary report groups data by rows only. A matrix report groups by rows and columns, so you can compare values across two dimensions in one table.
Can you edit a Salesforce matrix report?
No. Salesforce matrix reports calculate totals from underlying records, so you can't directly edit a summarized value in the report. To change the total, you update the contributing records. Editable matrix tools such as Valorx Wave Matrix let you adjust supported aggregate values and distribute the change across the underlying Salesforce records without editing each one by hand.
What happens when a matrix report returns more than 2,000 records?
Matrix reports that return more than 2,000 rows don't show details, and clicking Show Details does nothing. You can view the report with details hidden, use the Details Only export to see every record, or add filters to bring the result under 2,000 rows. A matrix report with one summary formula can show up to 400,000 summarized values, in up to 2,000 rows and 200 columns.
What's the difference between a grid and a matrix?
A grid shows one record per row, so you edit field values on individual records. A matrix shows summarized values grouped across rows and columns, so you read or plan totals.
Does a Wave Matrix respect Salesforce permissions?
Yes. It runs inside Salesforce, and changes save under each user's existing profiles, sharing rules and field-level security.





Choose the workflow you need:
Try Wave in browser Extension

Try Wave in Salesforce

Try Fusion In Excel

Enhancing Salesforce for industry leaders