Beyond the Dashboard: Fix the Records Your Tableau Charts Point To
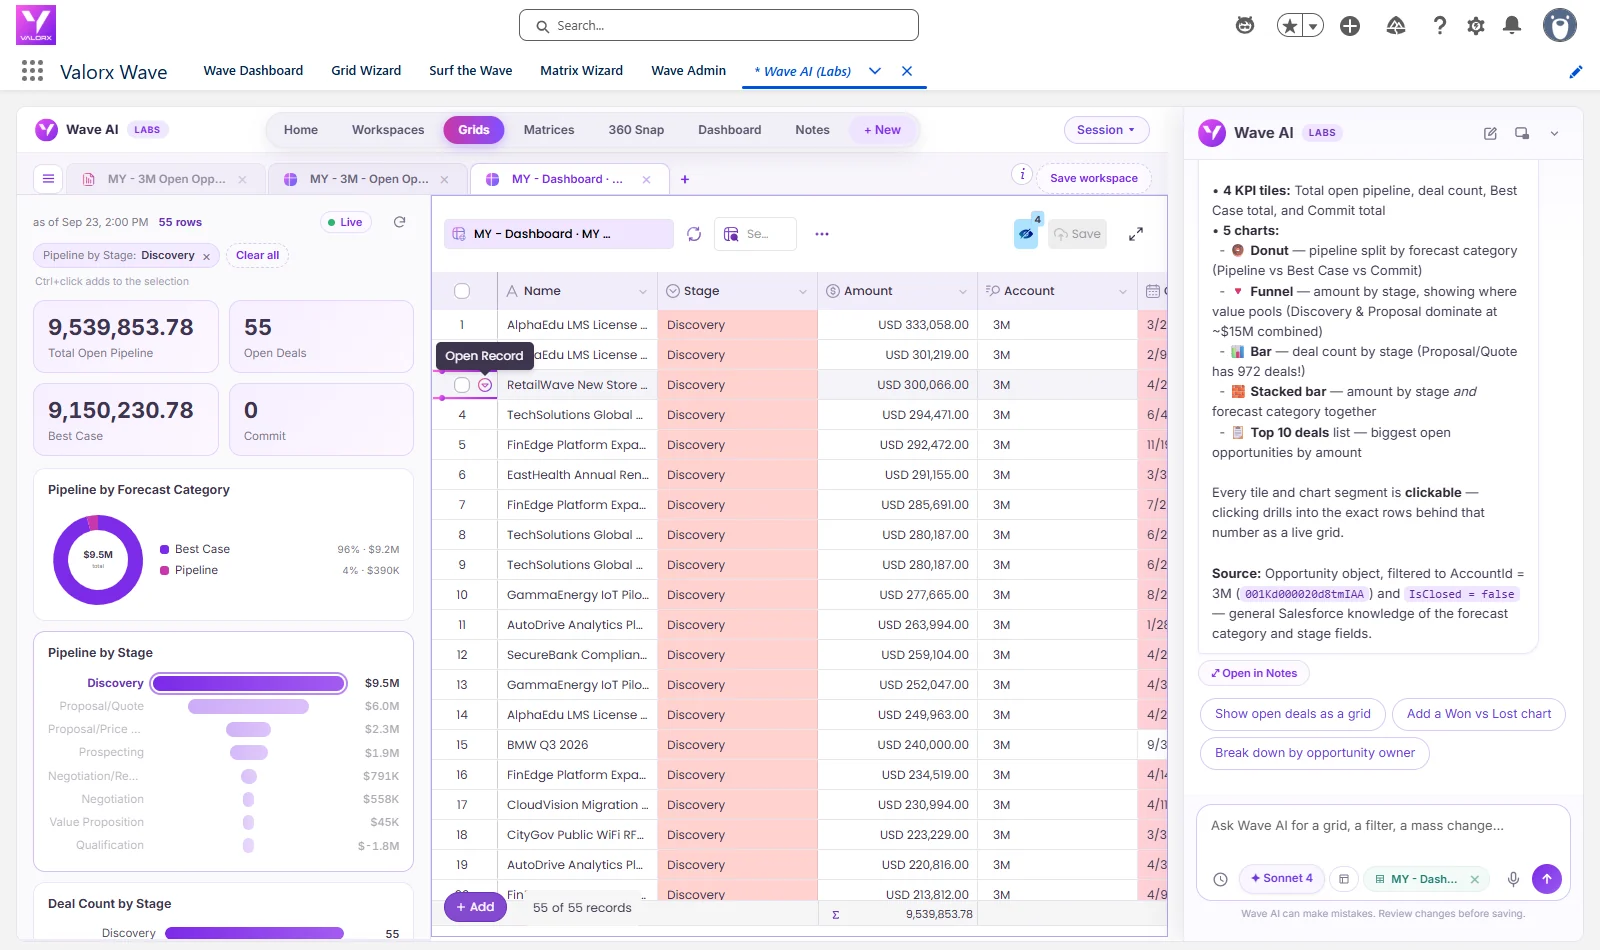
1,025 of 3M's 1,074 open deals were marked Best Case, and 53 of those had never left Discovery, so the $15.2M best-case number was counting deals nobody had qualified yet. Watch Wave AI build the forecast dashboard from one sentence, open the 55 Discovery deals behind a single bar, and move those 53 to Pipeline in one reviewed change. Leave with the prompts and Tableau's current pricing. Recorded in a Salesforce demo org with real screens, nothing mocked up.
The short answer
- Searching for a Tableau alternative for Salesforce? If your job is analysis across many data sources, keep Tableau. If your job is spotting a problem in Salesforce and fixing the records behind it, that's the job Wave AI does.
- Every chart opens its records. Click a bar and the deals behind it appear in an editable grid on the same screen.
- Every fix is reviewed first. You see the count, the current values and a dry run before a single Yes, and one Undo takes the whole change back.
- No pipeline to build. Wave AI reads the objects already in your org, as you, under your sharing rules. It's free in public beta.
The number that looked fine: $15.2M in Best Case
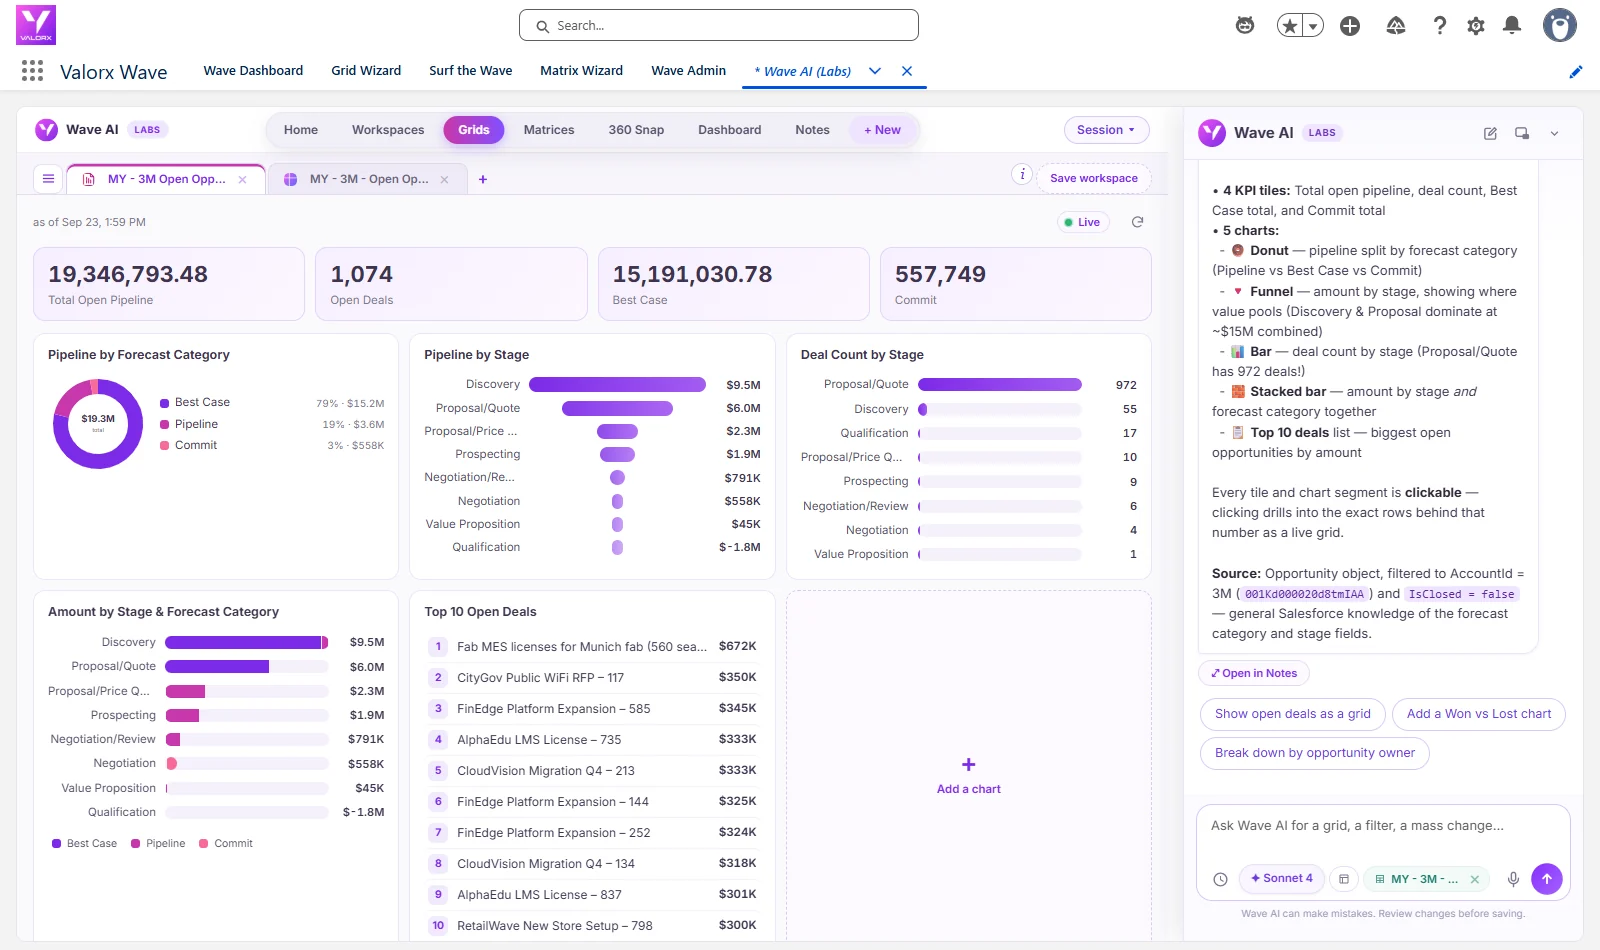
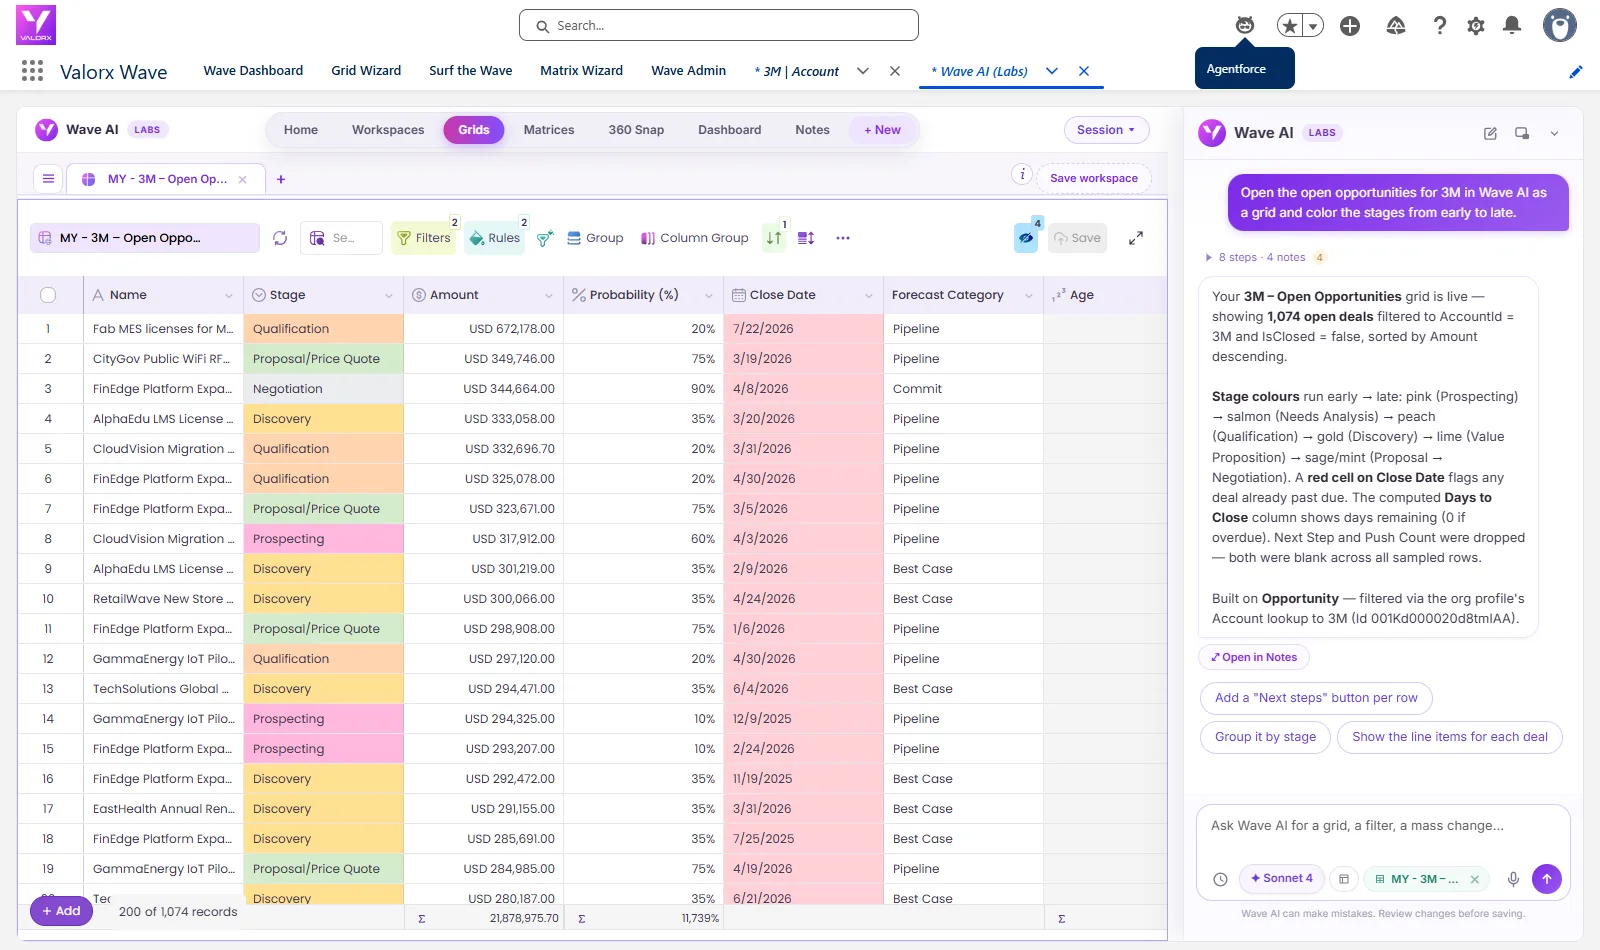
We started where most forecast reviews start, with a dashboard. One sentence, typed into Wave AI beside a grid of 3M's open deals:
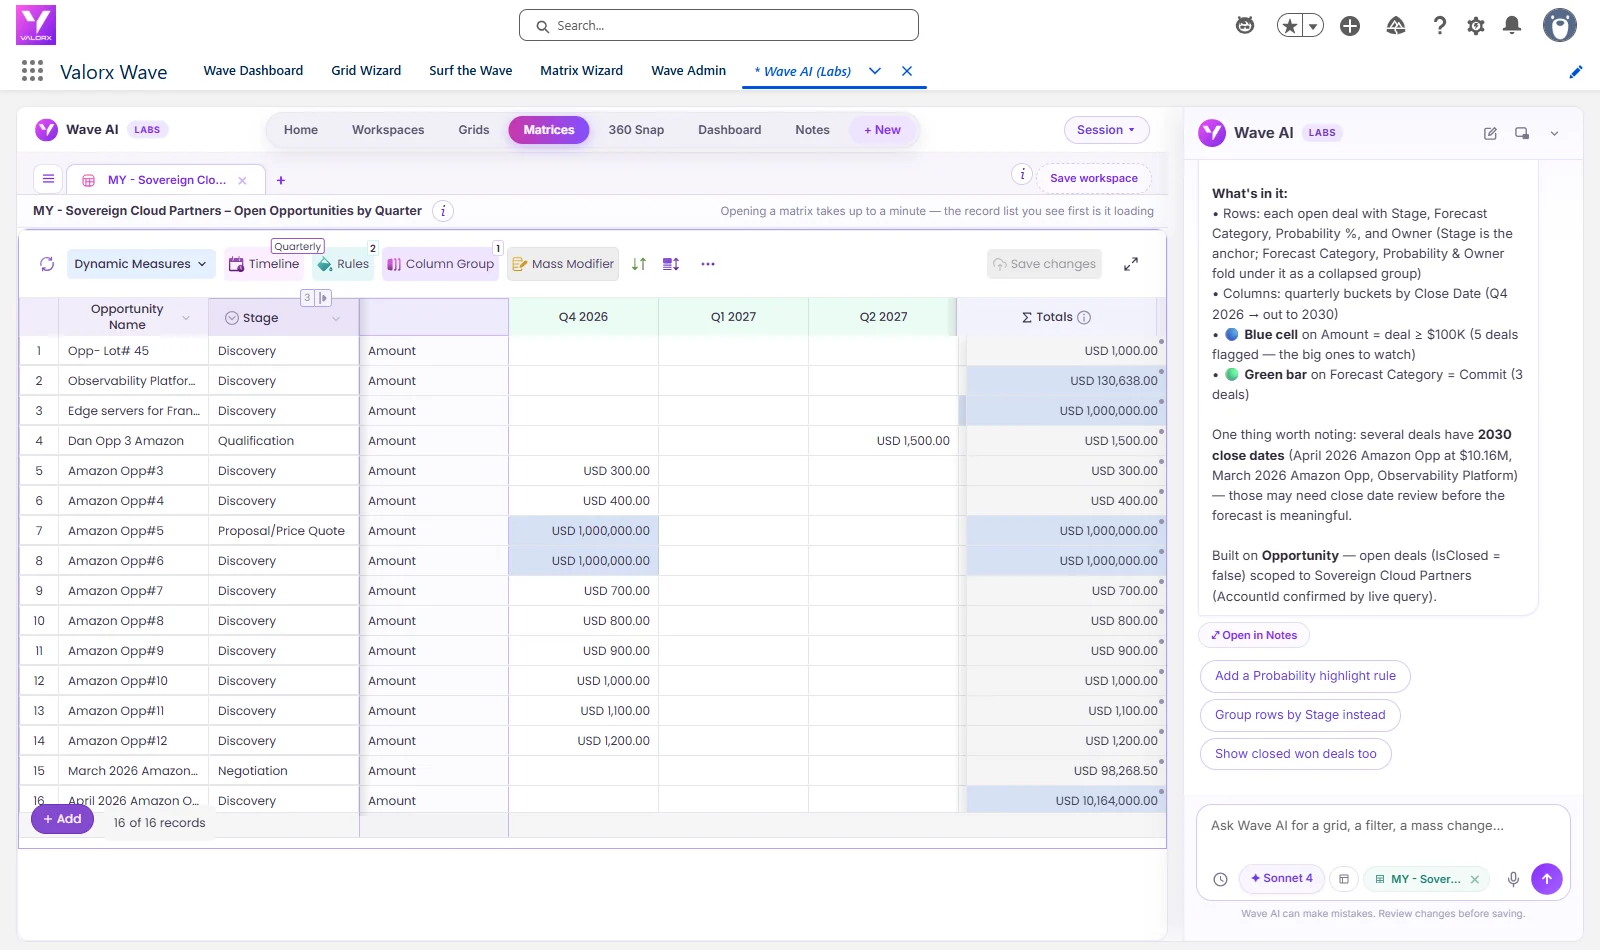
About twenty seconds later it had four tiles and five charts: $19.3M in open pipeline, 1,074 open deals, $15.2M in Best Case and $558K in Commit, then pipeline by forecast category, by stage, deal count by stage, amount by stage and forecast category, and the ten biggest deals.
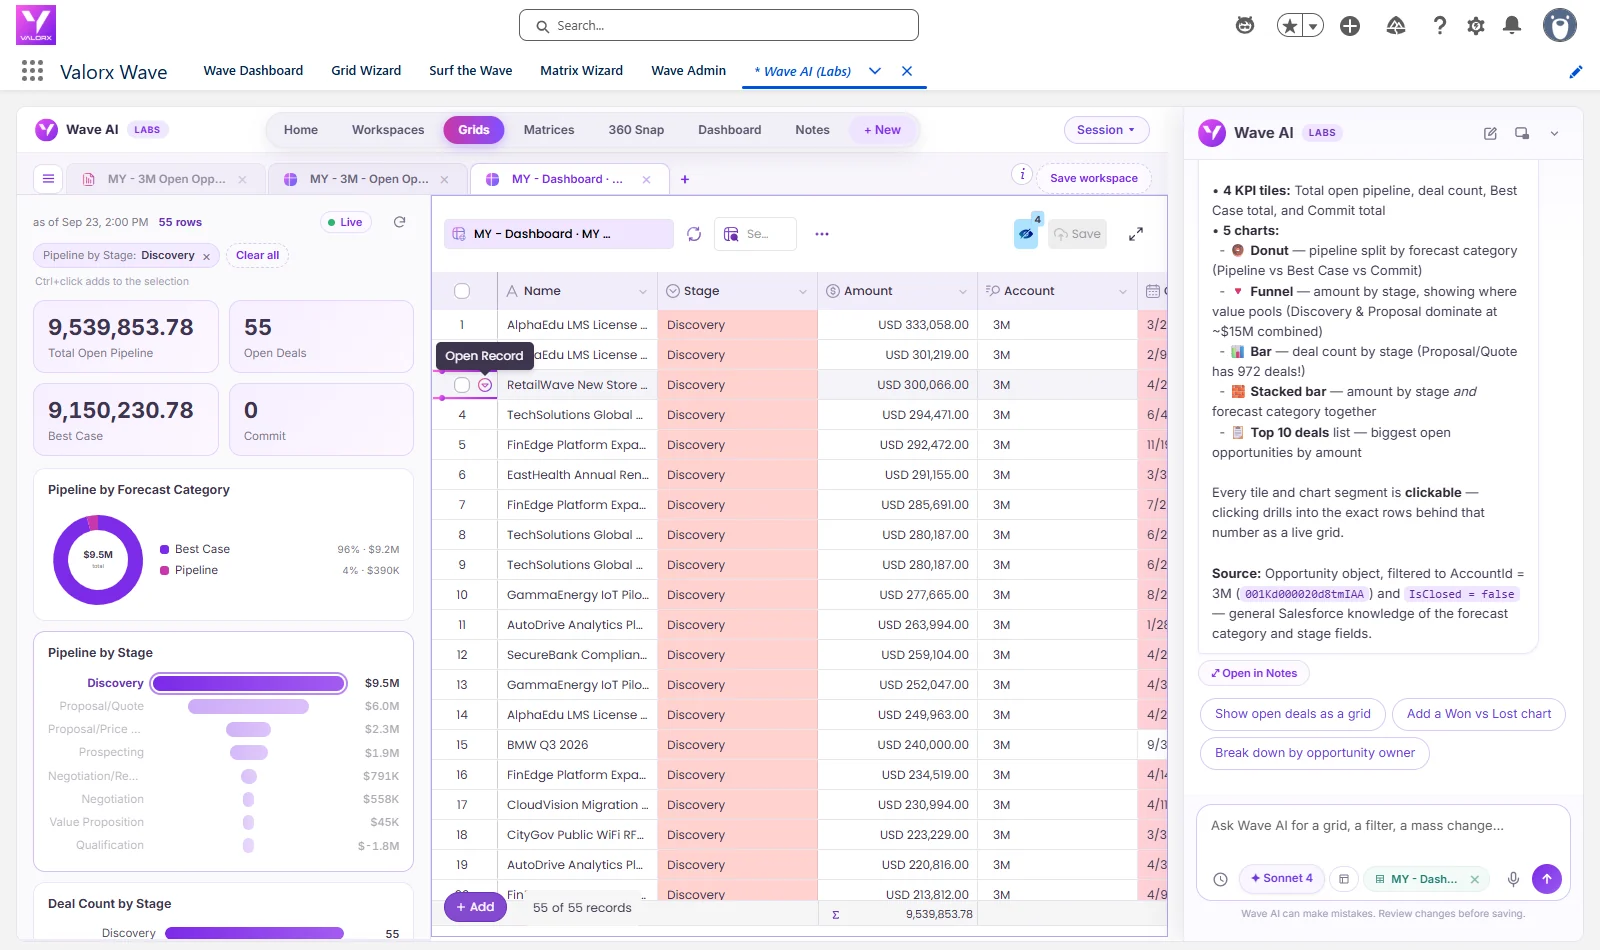
Put two of those charts side by side and the problem shows. The donut says 79% of the pipeline is Best Case. The deal count chart says 55 deals are still in Discovery. A deal that hasn't been qualified isn't a best case, so the $15.2M headline was overstated. Any good BI tool would have shown you that. The question is what happens next.
Click the bar, get the deals
We clicked Discovery on the pipeline-by-stage chart. The tiles recalculated to 55 open deals and $9.5M, the forecast donut redrew for just those deals, and a grid opened beside the charts with exactly those 55 rows: name, stage, amount, account, close date. They're live Salesforce records, editable in place. Ctrl+click adds another bar to the selection.
You
Ask for the dashboard
One sentence, on your own objects.
Wave AI
Charts the forecast
Four tiles and five charts in about twenty seconds.
You
Click a bar
Discovery: 55 deals open in a grid beside it.
You, reviewing
See it before it saves
Count, current values, a dry run, then Yes.
Salesforce
Records updated
Same permissions. Undo takes it back.
53 forecast categories, one reviewed change
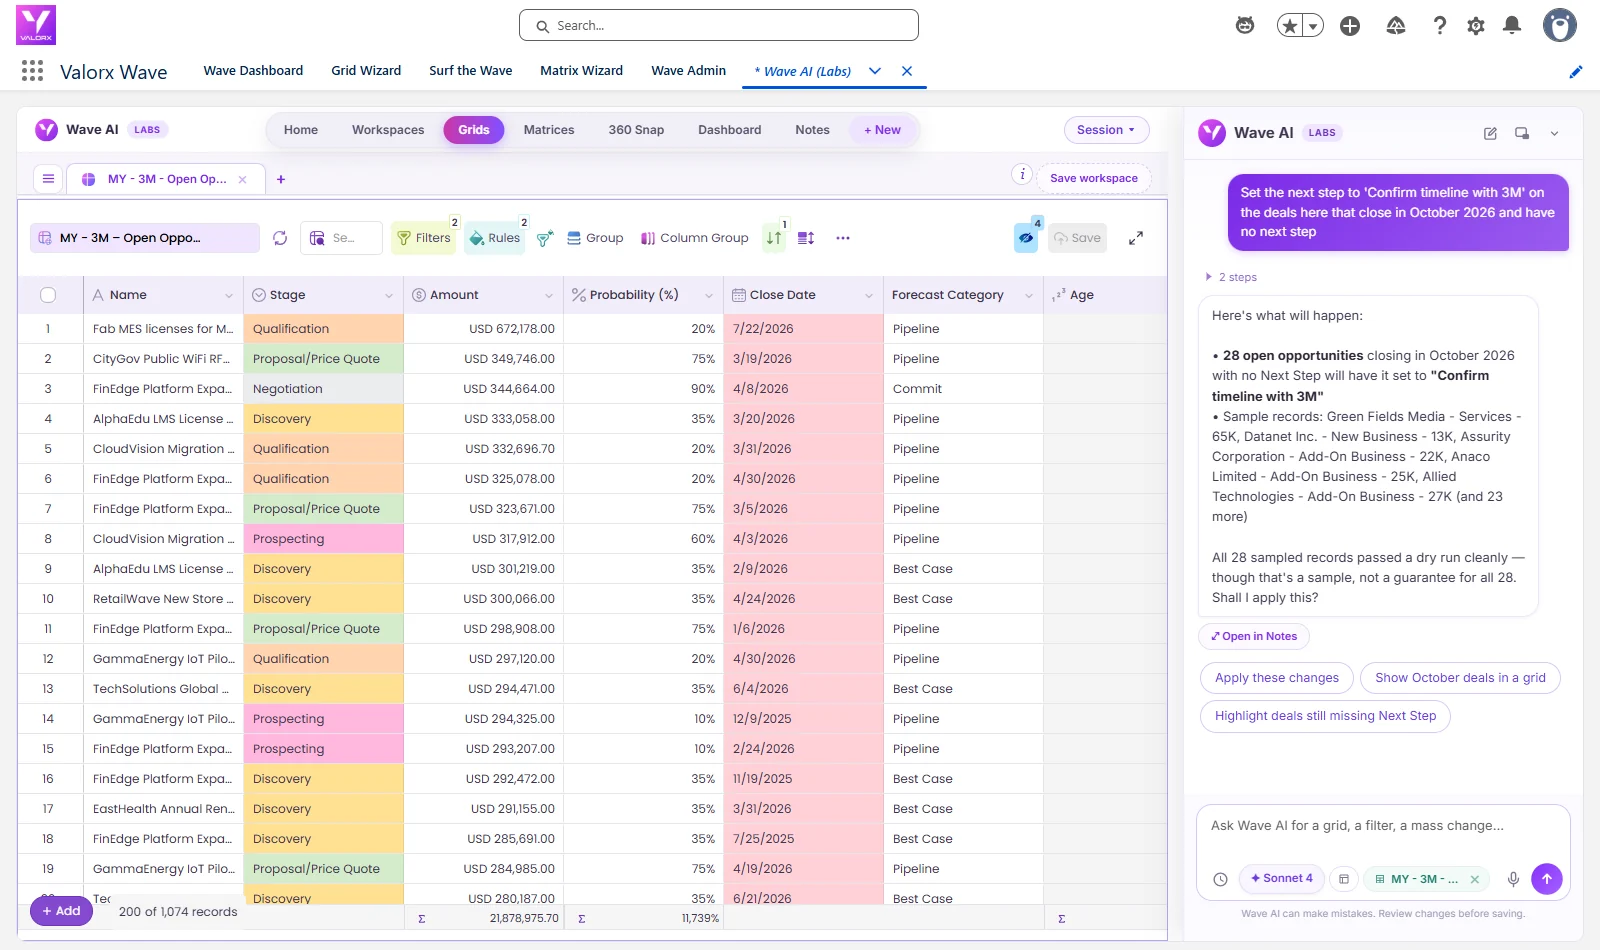
From the dashboard we typed the fix the way a sales manager would say it:
Nothing moved yet. Wave AI came back with the plan: 53 open Discovery-stage opportunities on 3M, ForecastCategoryName from Best Case to Pipeline, a sample of the deals it would touch, and a dry run on 40 of them that passed. Then it asked, "Shall I apply this?" We said yes. It reported all 53 updated, no failures, and the grid showed Pipeline where Best Case had been.
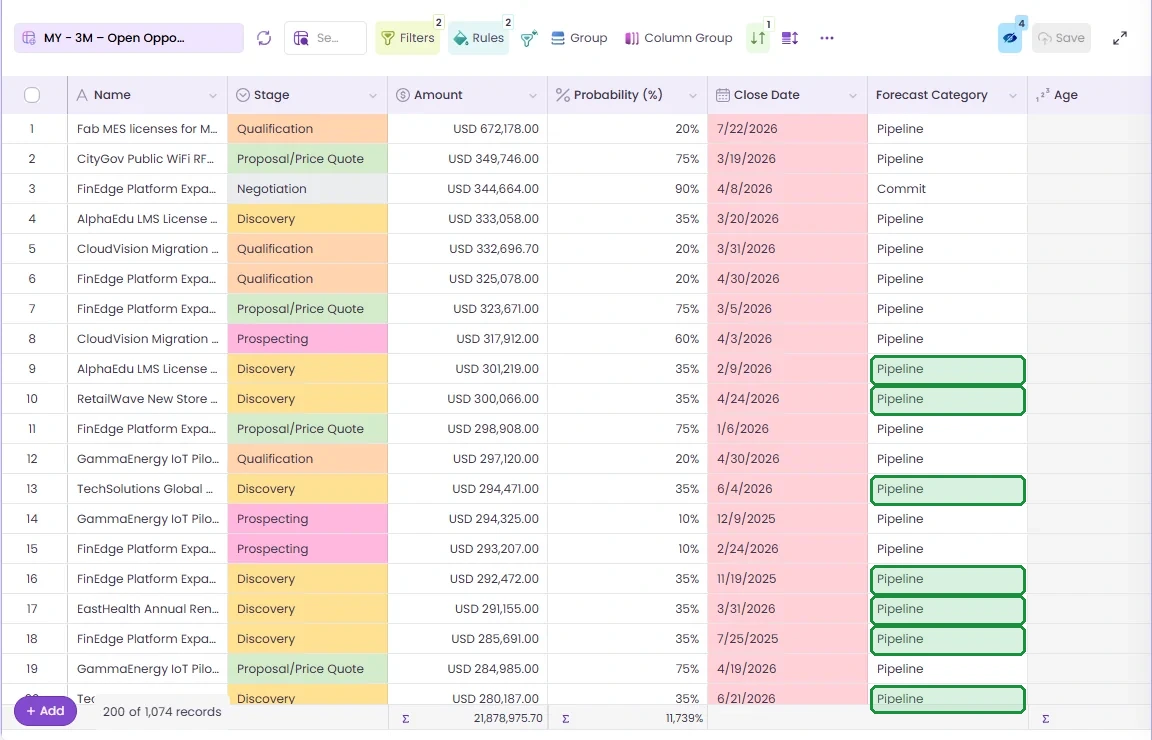
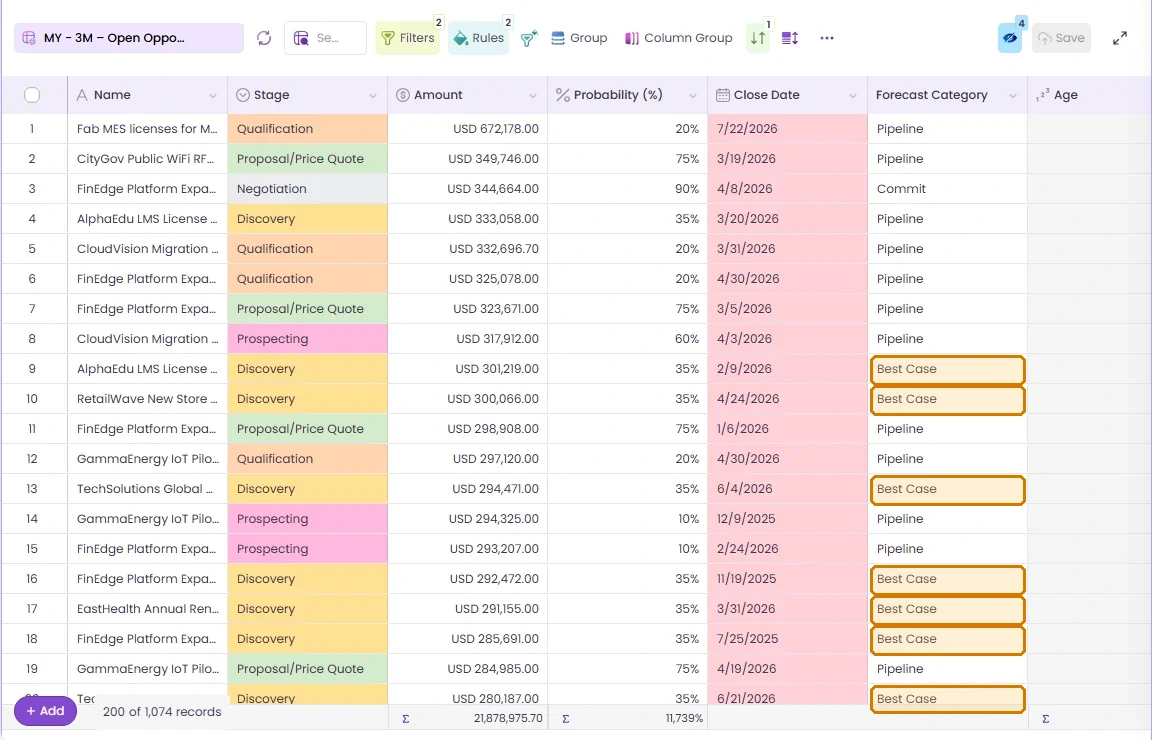 ↔Before · Best CaseAfter · Pipeline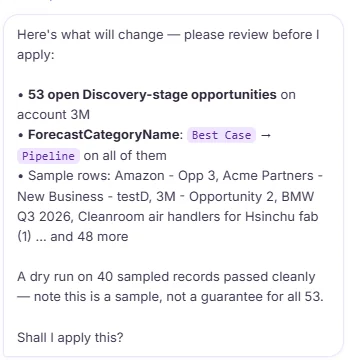
Then we typed "Undo that", confirmed, and every forecast category went back. We checked it the hard way: we queried all 1,074 of 3M's open deals and compared them to a copy taken before the test. Zero differences.
1,074
open 3M deals charted from one sentence
55
Discovery deals, one click on a bar away
53
forecast categories fixed in one reviewed change
1
Undo to put all 53 back, checked in Salesforce
0
files exported and data pipelines built
Looking for a Tableau alternative? Compare the jobs first
Tableau is a serious analytics platform, and for blending Salesforce with your warehouse, finance and product data it's the right tool. The comparison below is about one narrower job: seeing a problem in Salesforce and fixing the records behind it. Where we describe Tableau, Tableau Next or CRM Analytics, it's from their own documentation and pricing pages, linked, as they read on 23 September 2026.
| The job | Tableau, Tableau Next, CRM Analytics | Wave AI |
|---|---|---|
| Where you use it | Tableau Cloud or Desktop; Tableau Next inside Salesforce, where the data source "is always a Data 360 object".4 | A tab inside your Salesforce org, on the objects you already have. |
| Getting started | Tableau Next is set up on Data 360 with a semantic model. In Tableau Cloud, creating data sources takes a Creator license.14 | Nothing to model. It reads your objects directly, as the signed-in person. |
| Building from a sentence | Tableau Agent's analytics creation in Tableau Next is in beta, per the August 2026 release notes.5 | One sentence builds a dashboard, the grid behind it and a matrix. |
| From a chart to the records | CRM Analytics dashboard actions can create and update records; mass actions work on up to 100 records.67 Tableau External Actions call an autolaunched flow on the selected mark.8 | Click a bar and the records open in an editable grid beside it. |
| Changing many records | Bulk actions beyond that are defined in a Visualforce page that can call Apex.10 | Hundreds in one change, with the count, current values and a dry run before a single Yes, and one Undo for the lot. 53 in the run above. |
Tableau pricing, and what Wave AI costs
Tableau pricing depends on the product and the license. Here are the published list prices. If you're on one of Salesforce's new Core, Advanced or Max editions, Tableau Next is already included.
Tableau, as published
Tableau Cloud Standard: Creator · Explorer · Viewer1$75 · $42 · $15 / user / month
Tableau Cloud Enterprise: Creator · Explorer · Viewer1$115 · $70 · $35 / user / month
Tableau Next2from $40 / user / month
CRM Analytics Growth · Plus3$140 · $165 / user / month
Salesforce Core, Advanced, Max editions9Tableau Next included
List prices, billed annually, from tableau.com and salesforce.com, read 23 September 2026. Your contract may differ.
Wave AI
Freein beta
- No card
- No seat limit
- Einstein or your own AI key
- Your data never trains a model
Pricing arrives at public launch. Beta members hear first.
What each team gets
RevOps
"Best Case is 79% of the pipeline. Is it really?"
Chart it, click the stage that looks wrong, and fix the forecast category on those deals in one reviewed step. The dashboard updates from the same records.
Sales leaders
"The dashboard's right. The deals are wrong."
Click the bar you don't believe and the deals are right there. Fix them in the review, without asking for another report.
Salesforce admins
"Every dashboard request turns into a project."
People build their own view in a sentence, on the objects you've already secured. Permissions and sharing rules still apply.
IT and platform owners
"We don't want another copy of CRM data."
Nothing is exported and no pipeline is built. The work happens inside Salesforce, where the audit trail already is.
The prompts from this post
These are word for word what we typed. Swap in your own account.
In Wave AI
Build a forecast dashboard for the open opportunities of the account named 3M, by forecast category and by stage
Then click a bar
Discovery, on the pipeline by stage chart
Fix it, naming the stage
Set the forecast category to Pipeline on the deals here that are in the Discovery stage
After checking the review
Yes, apply it
If you change your mind
Undo that
What people ask about Tableau and Wave AI
Is Wave AI a Tableau alternative?
For analysis across many data sources, no: Tableau is built for that. For seeing a problem in Salesforce data and fixing the records behind it, Wave AI does the whole job in one place: the dashboard, the records behind any chart, and a reviewed change.
Can Tableau write back to Salesforce?
Yes, in specific ways. CRM Analytics dashboard actions can create and update Salesforce records, and mass actions work on up to 100 records. Tableau External Actions run an autolaunched flow on the selected mark. Anything larger is custom Visualforce or Apex.
How much does Tableau cost?
Tableau Cloud Standard lists at $75 per Creator, $42 per Explorer and $15 per Viewer per month, billed annually. Enterprise is $115, $70 and $35. Tableau Next starts at $40 per user per month, and CRM Analytics at $140. Those are list prices read on 23 September 2026.
Is Tableau Next included in Salesforce?
Salesforce says the full Tableau Next platform is included in the new Core, Advanced and Max editions for Sales, Service and Industry Clouds. It runs on Data 360, so plan for that setup.
Does Wave AI need Data 360 or a data warehouse?
No. It reads the standard and custom objects in your org directly, as the signed-in person, under the same permissions and sharing rules.
What's live in the beta today?
Grids and the fix-in-place work are live. Dashboards and matrices are in testing and rolling out to beta members. Wave AI installs as a managed package.
What does Wave AI cost?
It's free for the whole beta, with no card and no seat limit. Pricing is published at public launch.
See the number. Fix the deals behind it.
Bring the dashboard you don't quite believe. We'll help you open the records behind it in the beta.
Wave AI builds it. Valorx Wave runs it for the whole team.
Join the betaSources
- Tableau, Tableau Cloud pricing.
- Tableau, Tableau Next pricing.
- Salesforce, CRM Analytics pricing.
- Tableau Help, Tableau Next overview.
- Tableau, New features, August 2026.
- Salesforce Help, Take action on records from CRM Analytics dashboards.
- Salesforce Help, Take mass actions on records.
- Tableau Help, External actions.
- Salesforce, Analytics pricing.
- Salesforce Help, Configure bulk actions.
The recordings were made in a Salesforce demo org on 23 September 2026. Waiting time is cut out of the videos. Tableau, Salesforce and Agentforce are trademarks of Salesforce, Inc. 3M appears as demo data only.

Choose the workflow you need:
Try Wave in browser Extension

Try Wave in Salesforce

Try Fusion In Excel

Enhancing Salesforce for industry leaders