Beyond Report Builder: One Sentence to a Dashboard, a Grid and a Matrix
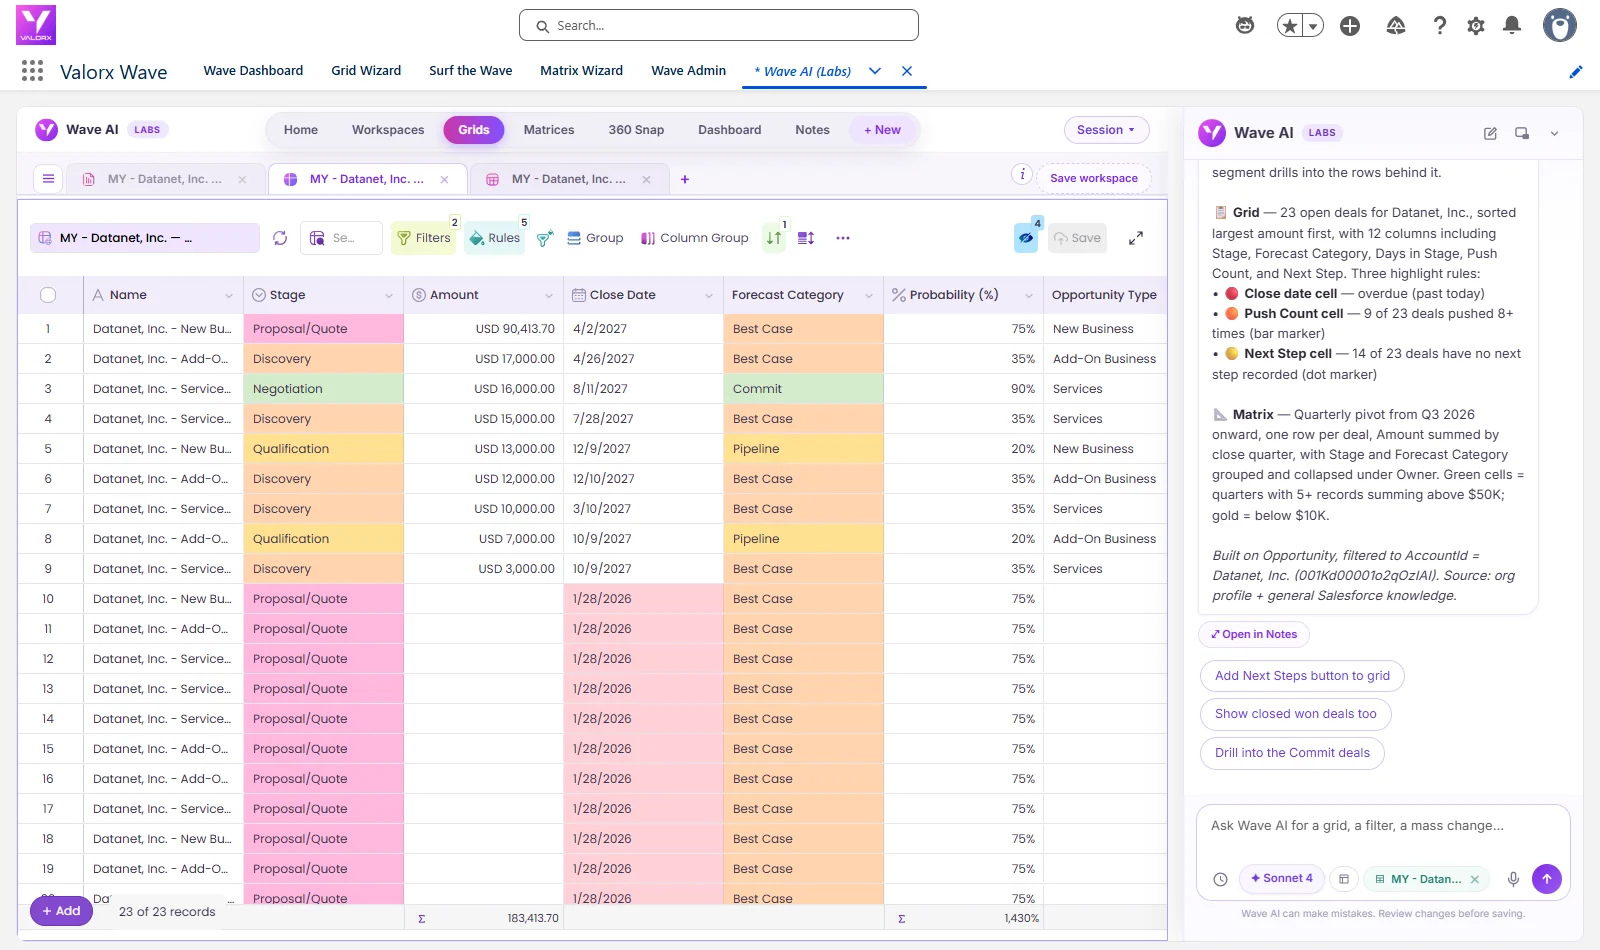
Datanet, Inc. had 23 open deals, and 14 of them were due to close on 28 January 2026, months ago, with no amount entered. A pipeline report would add them up as zero and move on. See one sentence build the dashboard, the grid behind it and a quarterly matrix, with those 14 deals flagged in red. Leave with the prompt and the report limits worth knowing. Recorded in a Salesforce demo org with real screens, nothing mocked up.
The short answer
- Looking for a Salesforce reporting alternative? Keep your reports for the things they do well: scheduled, shared, audited numbers. When you need to see a problem and fix the records behind it, a sentence gets you there faster than a report type, a report and a dashboard.
- One sentence, three views. A dashboard, the grid of records behind it, and a matrix by quarter, built together in about a minute.
- The grid is the records. Every row is a live Salesforce record, editable in place, and a whole set can be changed in one reviewed step.
- No export. Nothing to download and re-import. Wave AI runs in your org and is free in public beta.
Three views from one sentence
A pipeline review usually means three things: a dashboard for the headline, a list of the deals, and a view by quarter. In report builder that's a report type if the objects need one, a report, a matrix report and a dashboard. We typed one sentence instead:
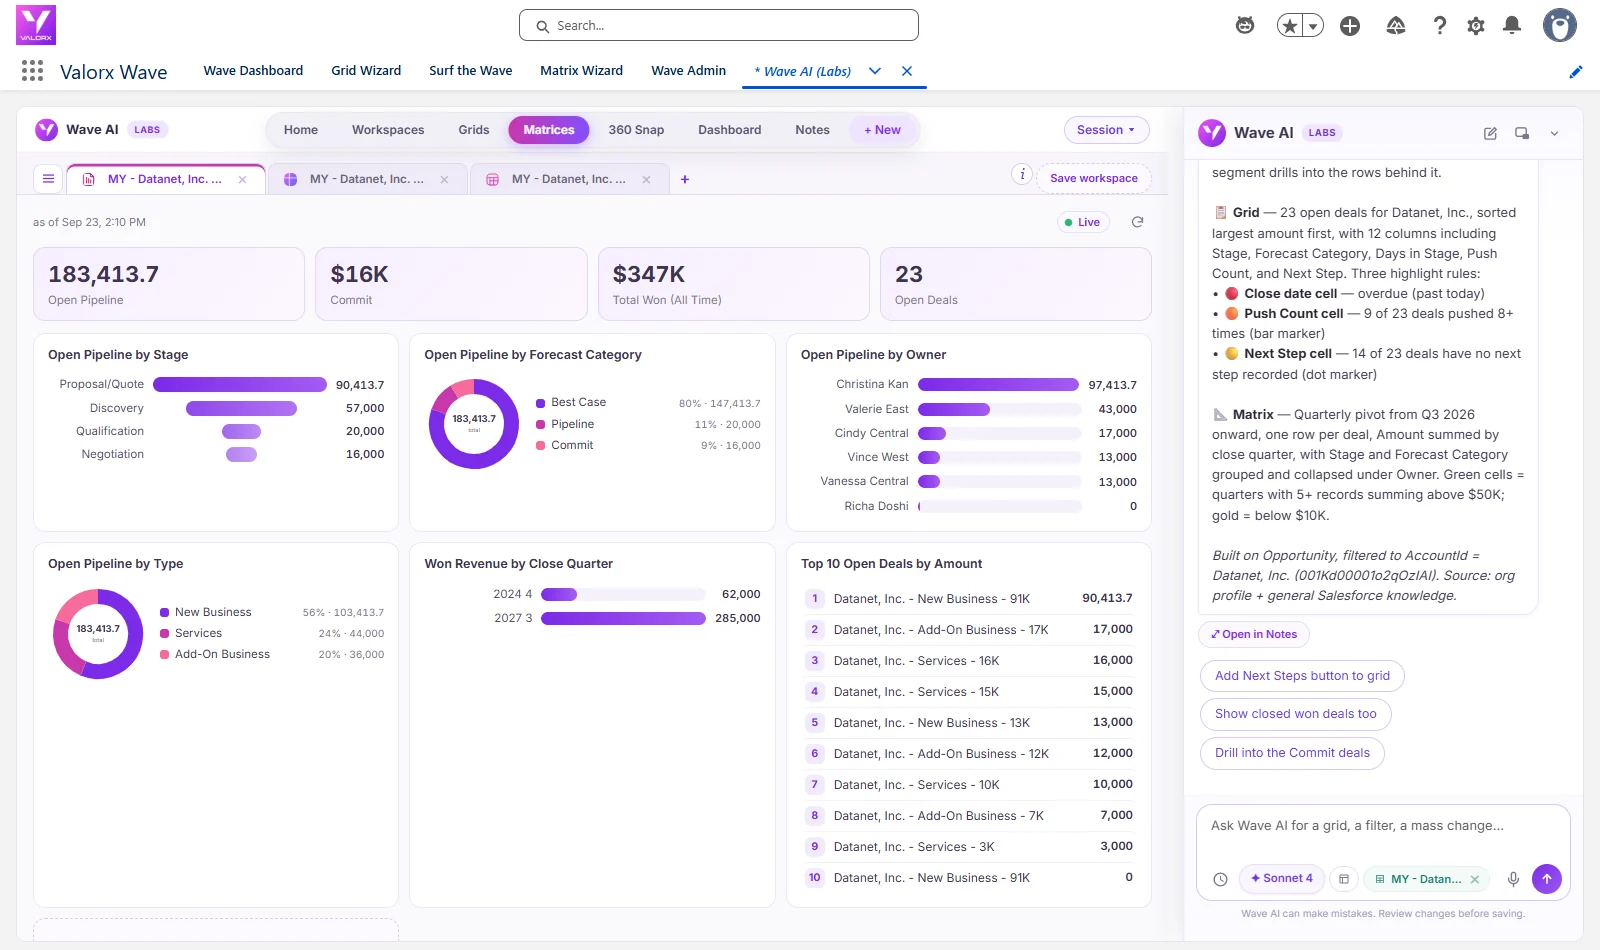
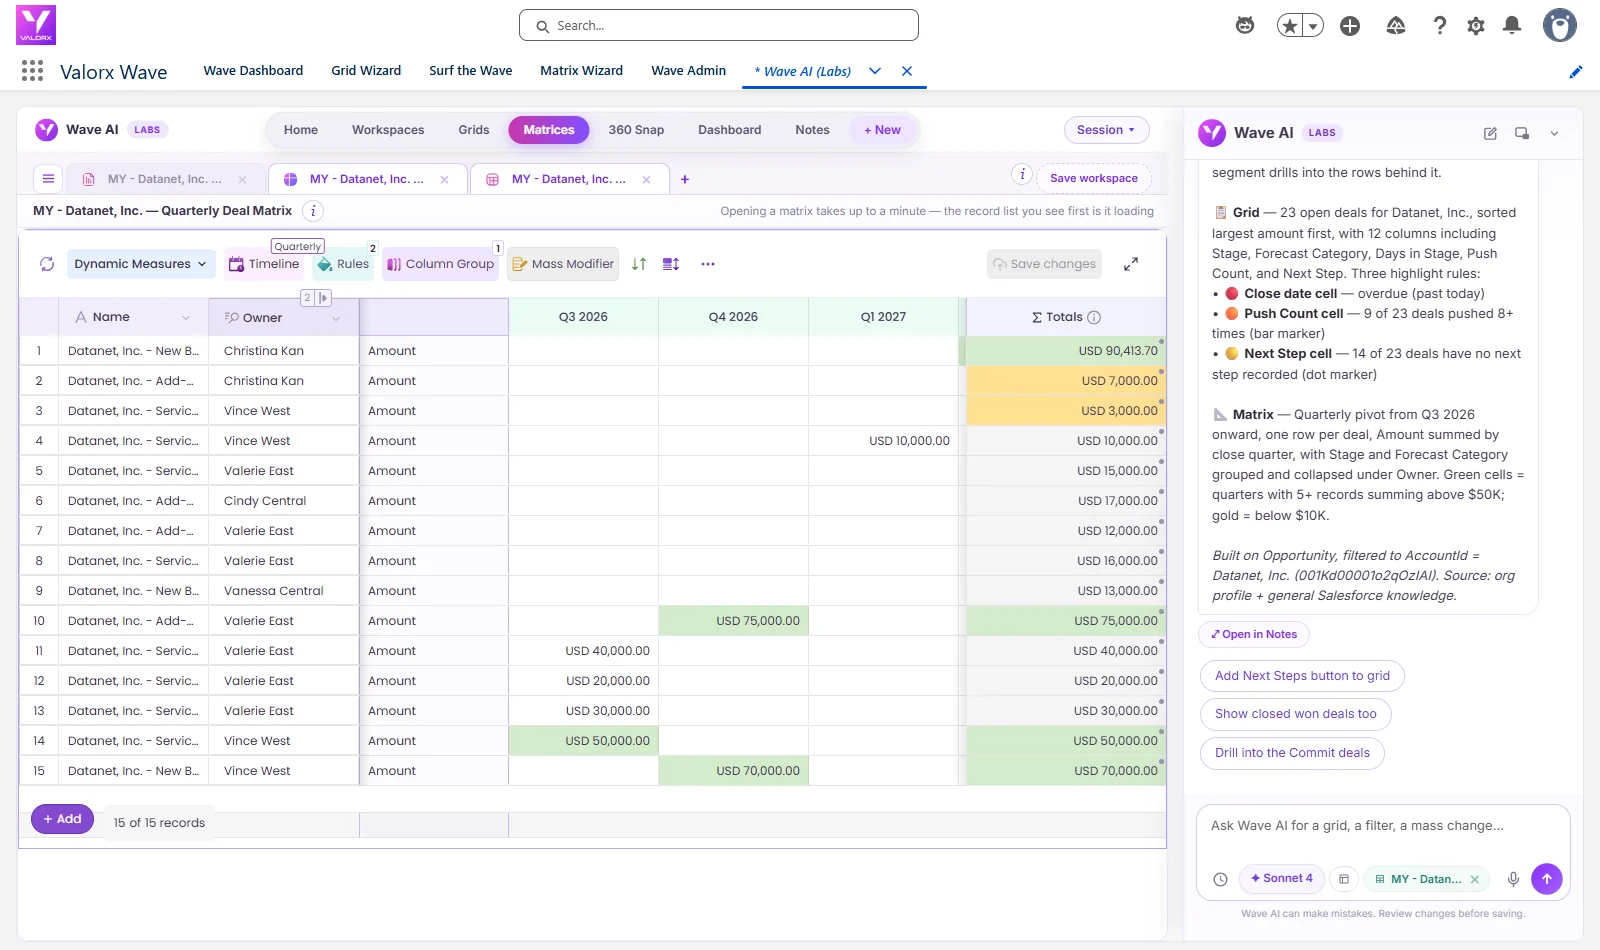
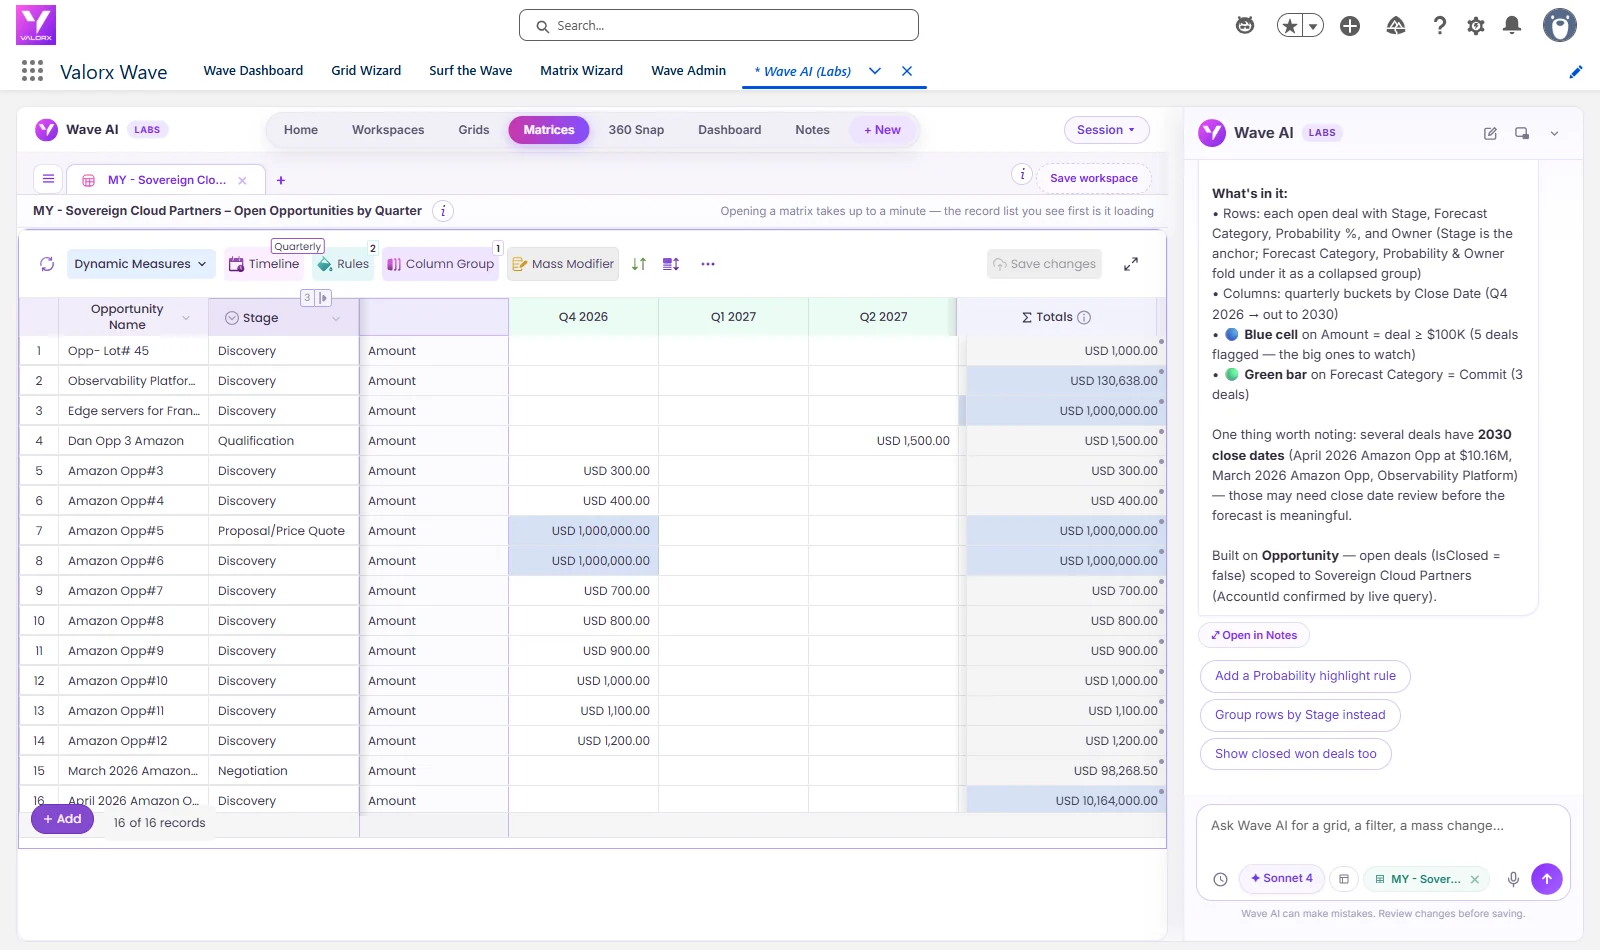
About a minute later there were three tabs. The dashboard: $183,414 in open pipeline across 23 deals, $16K in Commit, $347K won to date, and charts by stage, forecast category, owner, type and close quarter. The grid: all 23 deals with stage, amount, close date, forecast category and next step. The matrix: the same deals by close quarter, one row per deal.
The grid showed what the dashboard couldn't
The headline said $183K. The grid said something else. 14 of the 23 deals had a close date of 28 January 2026, already in the past and highlighted red, and not one of those 14 had an amount. They were in the pipeline count and contributed nothing to the pipeline value. A summary report shows you the sum. The grid showed us the 14 rows that made the sum wrong, and it's where they get fixed: type the amounts in place, or change the dates on all 14 in one reviewed step.
14 close dates, one reviewed change
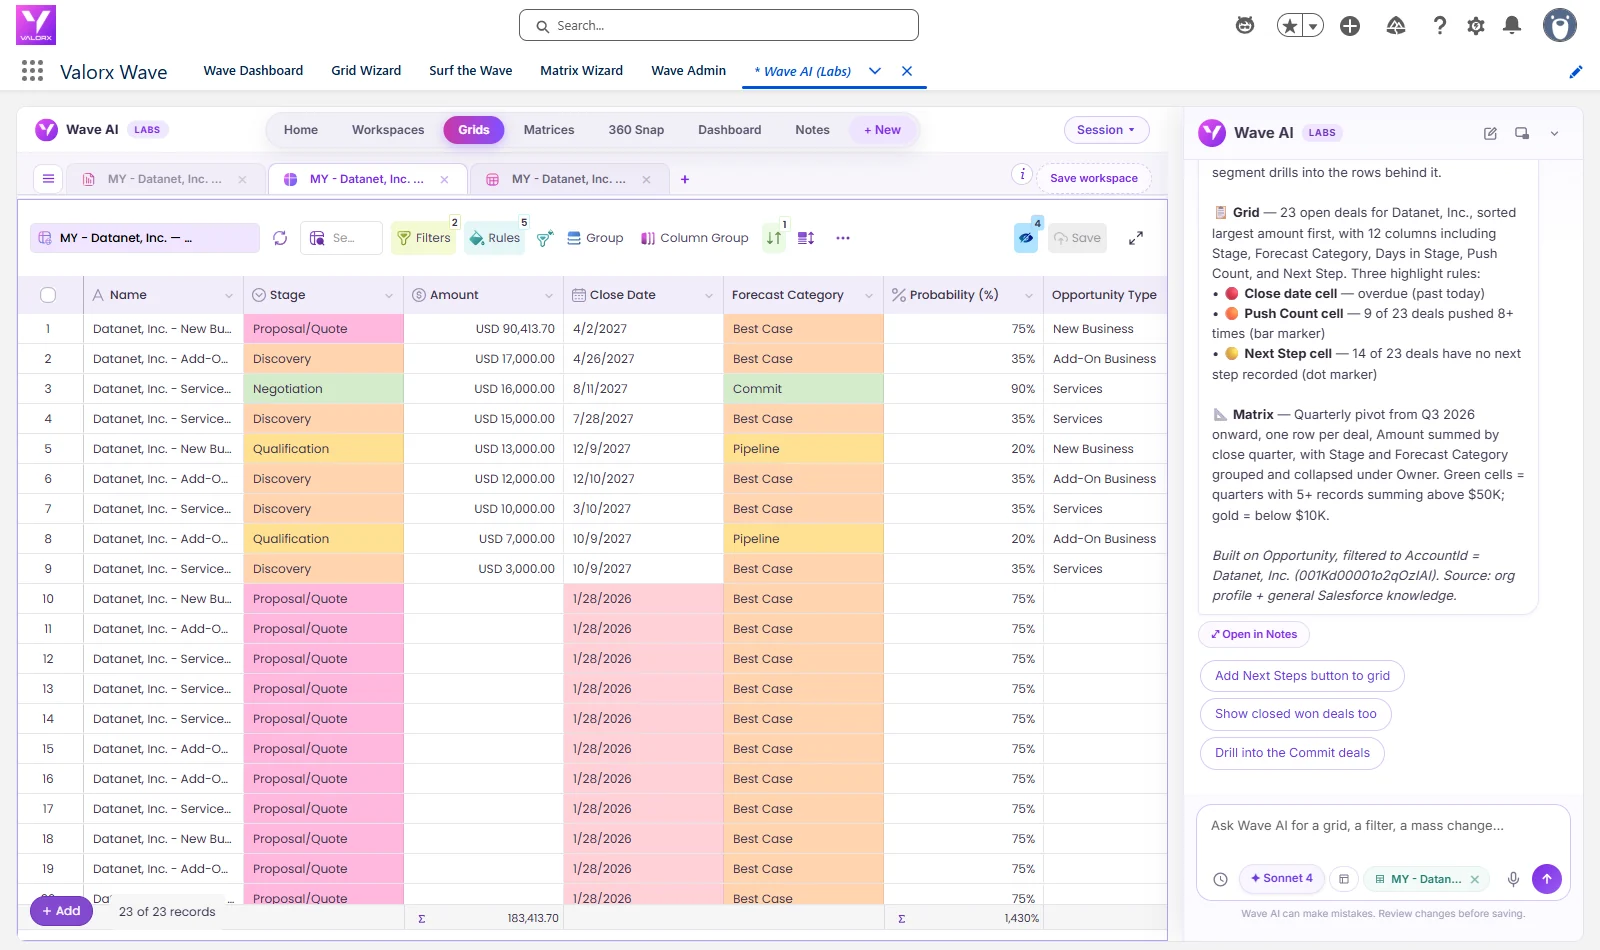
Seeing the gap is half the job. We asked for Datanet's deals in a grid with the close date showing and past dates in red:
Then the fix, in one sentence:
Nothing moved yet. Wave AI listed the 14 deals with their new close date, reported that all 14 passed a dry run, and asked first. We said yes. All 14 moved to 12/31/2026 with no failures, and the red cleared from the grid. The amounts still need a person, but the dates no longer sit in the past. Then we undid it and checked all 23 Datanet deals in Salesforce against a copy taken before the test: zero differences.
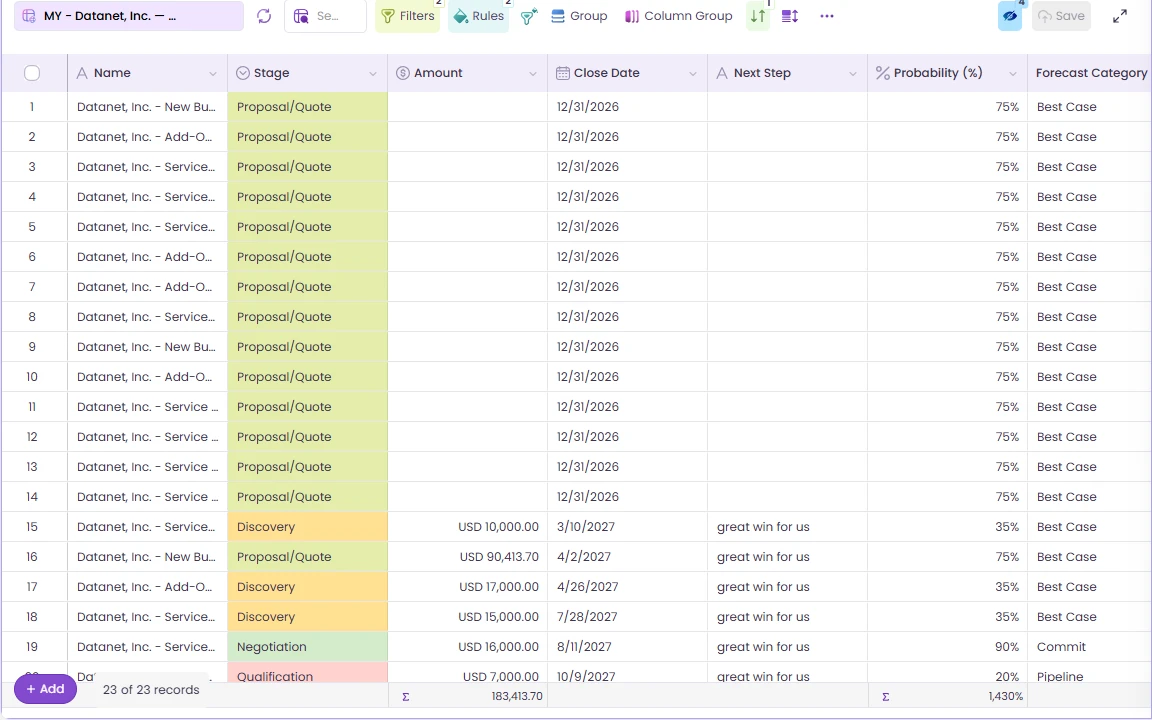
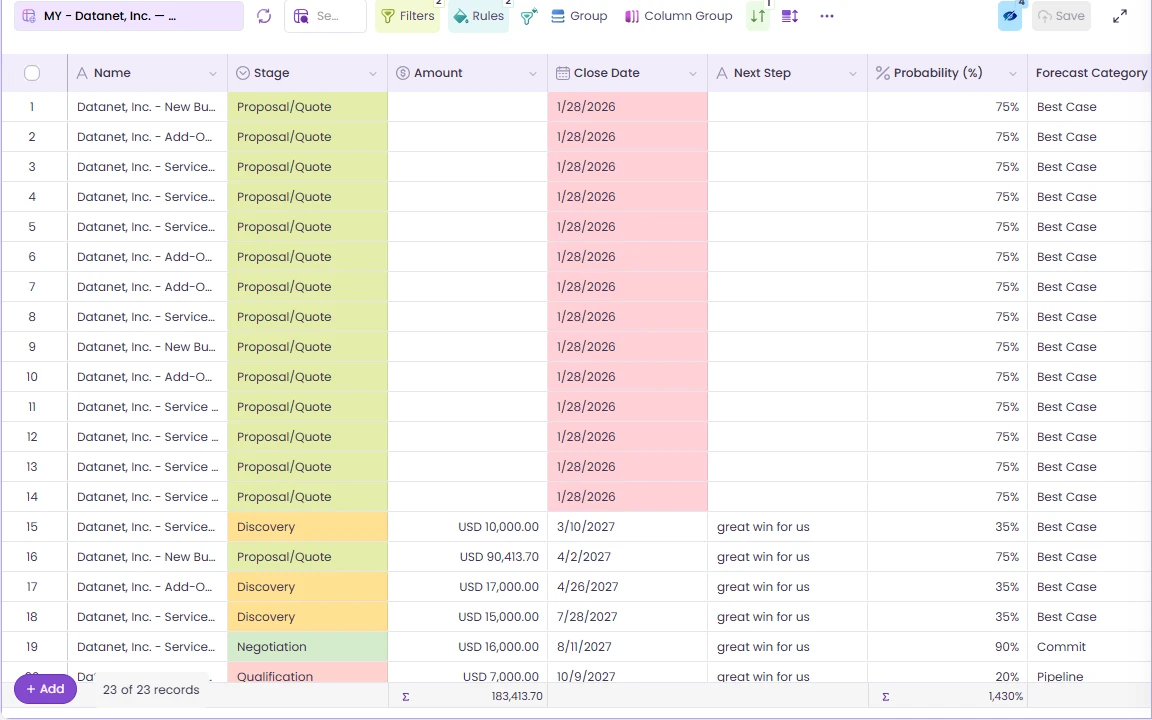 ↔Before · 14 past due, in redAfter · 12/31/2026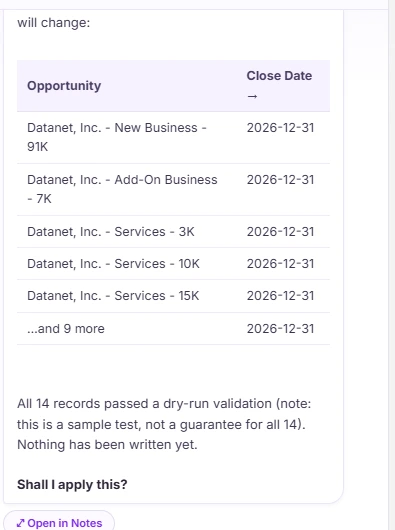
You
Ask once
A dashboard, the grid and a matrix.
Wave AI
Builds three views
About a minute, on your own objects.
You
Spot the gap
14 deals past due with no amount.
You, reviewing
Fix in place
Edit the rows, or change them all in one reviewed step.
Salesforce
Records updated
Same permissions. Undo takes it back.
1
sentence
3
views: dashboard, grid, quarterly matrix
23
open Datanet deals in the grid
14
past due with no amount, flagged red
0
report types built
Report builder and Wave AI: compare the jobs
Salesforce reports and dashboards are the system of record for how most companies measure their pipeline, and that's not changing. The comparison below is about getting from a question to fixed records. Where we describe Salesforce reports, it's from Salesforce's own help pages, linked, as they read on 23 September 2026.
| The job | Salesforce reports and dashboards | Wave AI |
|---|---|---|
| Getting started | Custom objects deployed with the metadata API or change sets don't get a standard report type automatically, so you create a custom report type in Setup.1 | Ask in a sentence, on standard or custom objects. |
| How much you see | "Reports display a maximum of 2,000 rows." A dashboard can have up to 25 widgets, including up to 20 charts and tables, and 5 filters.1 | A grid of every matching record, with a dashboard and matrix built beside it. |
| Changing records | Inline editing in reports changes up to 100 values at a time, and not every field is supported, for example Opportunity Amount or Owner.2 | Hundreds in one reviewed change, with a count, current values and a dry run first. |
| Taking data out | For Event Monitoring customers, exports of more than 10,000 records need step-up authentication from 13 July 2026.3 | Nothing to export. The work happens on the live records. |
| Bulk updates, natively | Salesforce lists Agentforce Grid for large updates of up to 1,000 records; it needs an Agentforce license.4 | Free in beta, on the licenses you already have. |
What reporting costs, and what Wave AI costs
Salesforce reporting, as published
Reports and dashboardspart of your Salesforce license
CRM Analytics Growth · Plus5$140 · $165 / user / month
Agentforce Grid, updates up to 1,000 records4needs an Agentforce license
Salesforce Core, Advanced, Max editions6$195 · $395 · $550 / user / month
List prices from salesforce.com, read 23 September 2026. Your contract may differ.
Wave AI
Freein beta
- No card
- No seat limit
- Einstein or your own AI key
- Your data never trains a model
Pricing arrives at public launch. Beta members hear first.
What each team gets
Salesforce admins
"Every request is a new report type."
People ask for the view in a sentence on the objects you've already secured. You stop building one-off reports.
RevOps
"The report adds it up. It doesn't tell me what's wrong."
The grid next to the dashboard shows the rows that make the number wrong, and they can be fixed on the spot.
Sales leaders
"I want the pipeline, the deals and the quarter view."
One sentence builds all three, for any account, and every chart opens its records.
IT and platform owners
"Exports are where our CRM data leaks."
Nothing is exported. The dashboard, grid and matrix all run on the live records, under your sharing rules.
The prompts from this post
Word for word what we typed. Swap in your own account.
In Wave AI
Build a pipeline review for the account named Datanet, Inc.: a dashboard, the grid behind it and a quarterly matrix
Then, for the fix
Show the open opportunities of the account named Datanet, Inc. with stage, amount, close date and next step, and highlight close dates that have passed in red
With the grid open
Move the close date to 12/31/2026 on the deals here whose close date has already passed
After checking the review
Yes, apply it
If you change your mind
Undo that
What people ask about Salesforce reports and Wave AI
Is Wave AI a replacement for Salesforce reports?
No. Keep reports for scheduled, shared and audited numbers. Wave AI is for getting from a question to the records behind it and fixing them, which reports weren't built for.
How many rows can a Salesforce report show?
Salesforce's help says reports display a maximum of 2,000 rows; to see more, you export the report. Matrix reports that return more than 2,000 rows don't show details.
How many charts can a Salesforce dashboard have?
Up to 25 widgets, including a maximum of 20 charts and tables, 3 images and 25 rich text widgets, with up to 5 dashboard filters.
Can you edit records from a Salesforce report?
Yes, with inline editing in Lightning, up to 100 values at a time. Some fields aren't supported, including Opportunity Amount and polymorphic fields like Owner.
Does Wave AI need a custom report type?
No. It reads standard and custom objects directly, as the signed-in person, under the same permissions and sharing rules.
What's live in the beta today?
Grids and the fix-in-place work are live. Dashboards and matrices are in testing and rolling out to beta members.
What does Wave AI cost?
It's free for the whole beta, with no card and no seat limit. Pricing is published at public launch.
Ask for the review. Fix what it finds.
Bring an account whose numbers you don't quite trust. We'll build the three views with you in the beta.
Wave AI builds it. Valorx Wave runs it for the whole team.
Join the betaSources
- Salesforce Help, Reports and dashboards limits.
- Salesforce Help, Edit records inline in reports.
- Salesforce Help, Step-up authentication for large exports.
- Salesforce Help, Ways to mass update records, 10 August 2026.
- Salesforce, CRM Analytics pricing.
- Salesforce News, Salesforce simplifies editions, 3 September 2026.
The recordings were made in a Salesforce demo org on 23 September 2026. Waiting time is cut out of the videos. Salesforce and Agentforce are trademarks of Salesforce, Inc. Datanet, Inc. appears as demo data only.

Choose the workflow you need:
Try Wave in browser Extension

Try Wave in Salesforce

Try Fusion In Excel

Enhancing Salesforce for industry leaders