How to Build Your First Matrix
Here’s what you’re building
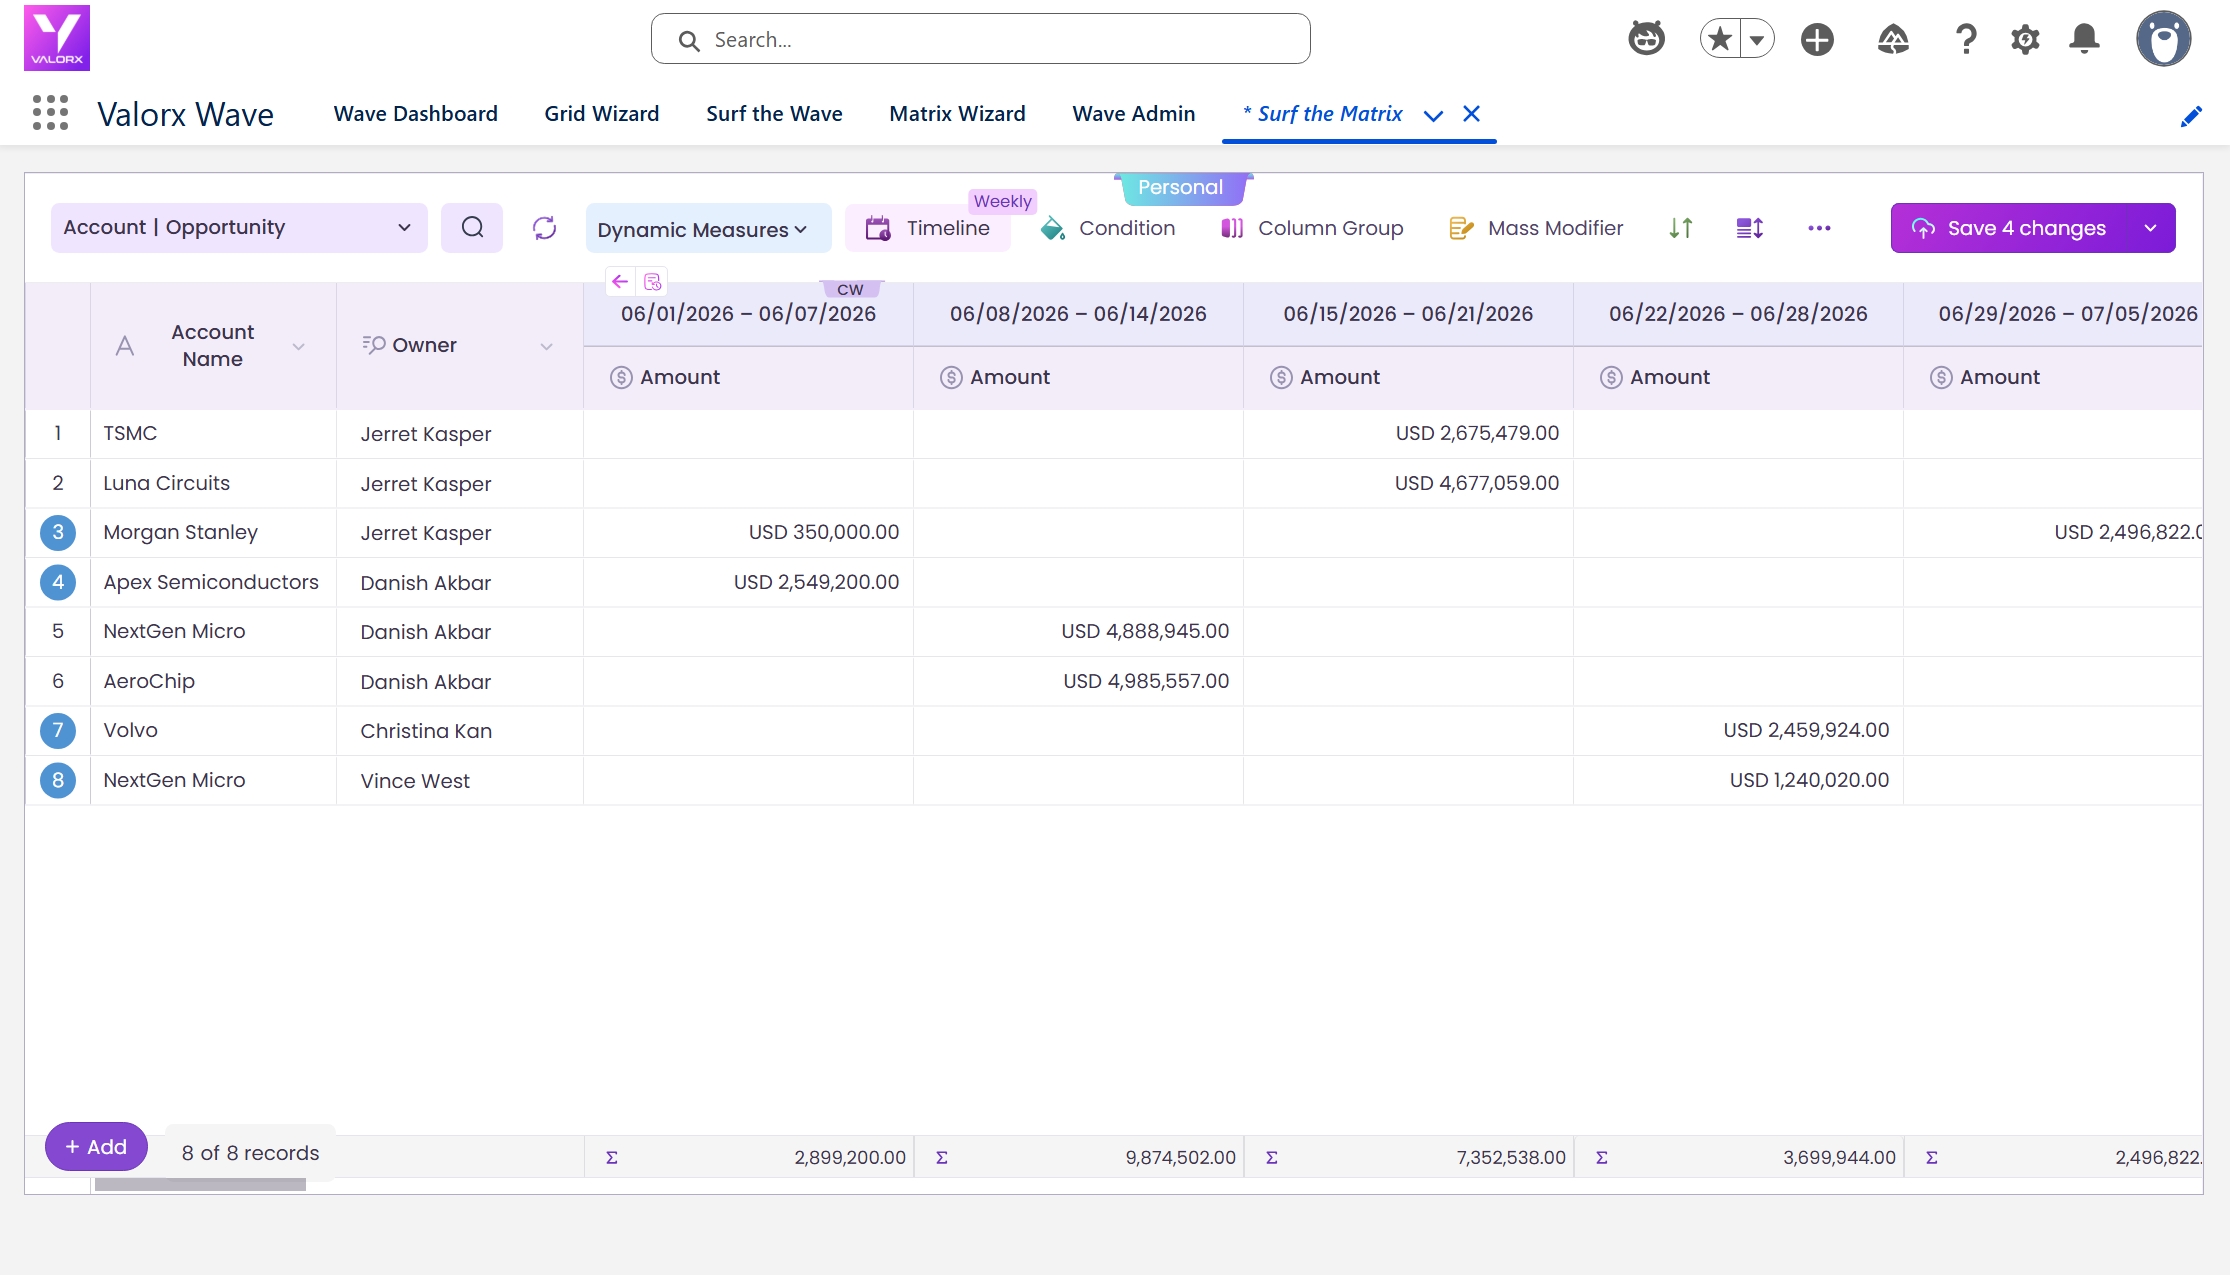
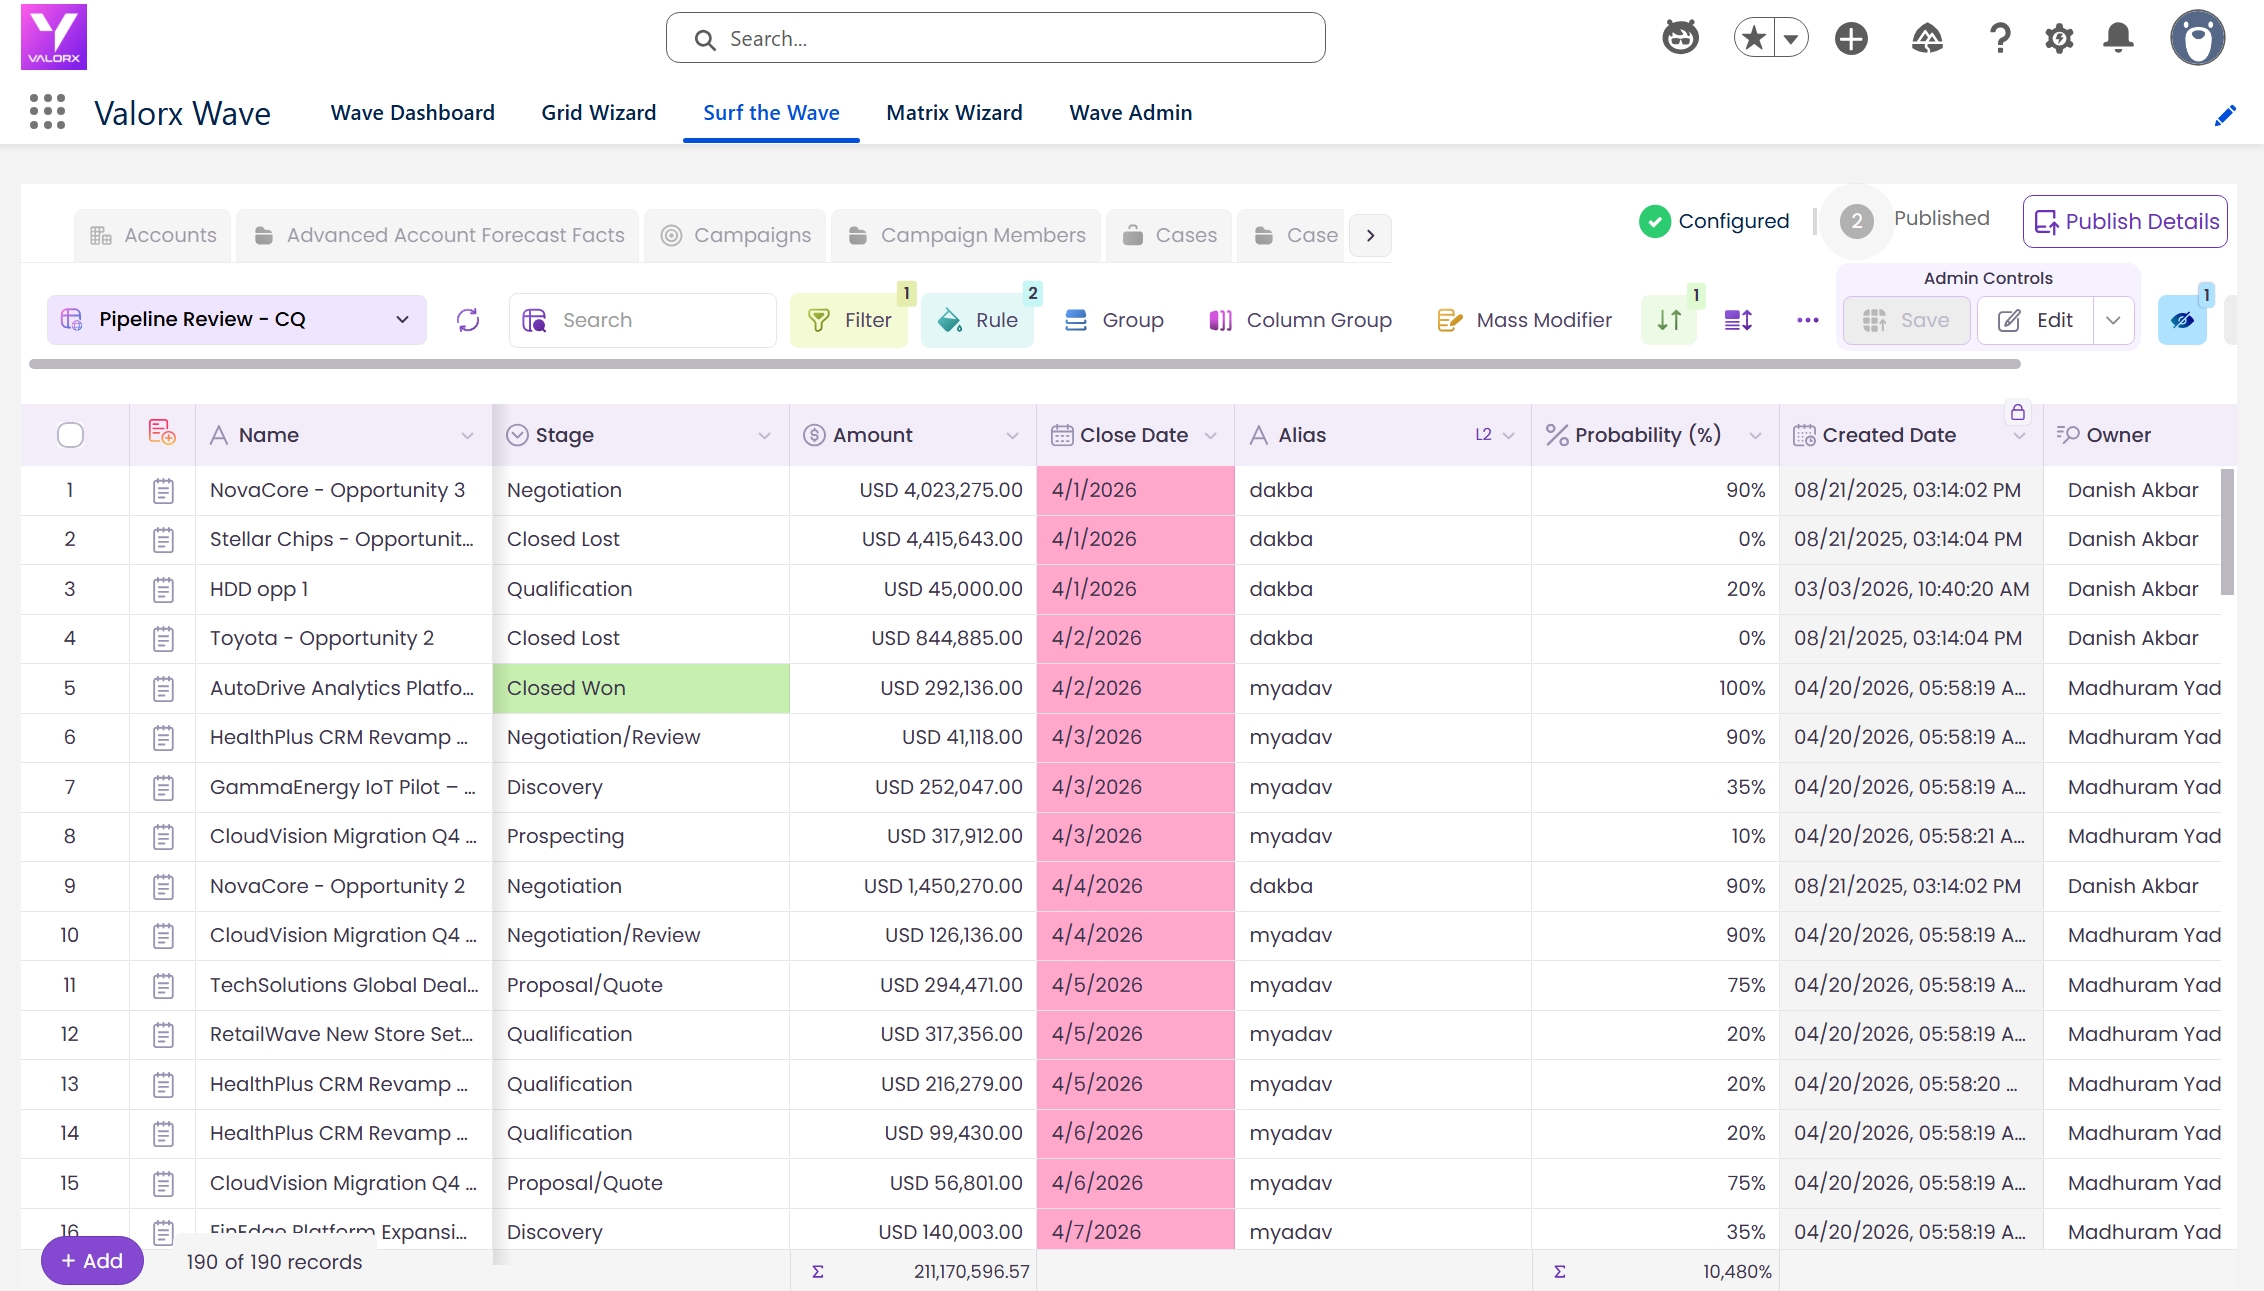
Before we walk through the steps, here’s the end result — the Matrix you’ll have running in under 10 minutes
Time: ~10 minutes | Role: Designer or Admin | Platform: Wave Embedded in Salesforce
Prerequisites
- Valorx Wave embedded package installed in your Salesforce org
- A Designer or Admin role in Wave (Standard Users can view Matrices, not create them)
- At least two related Salesforce objects you want to cross-reference (e.g. Accounts & Opportunities)
Build your first Matrix
Follow along with the screenshots. We’ll use Account × Opportunity (by Close Date) as the example.
Navigate to the Valorx Wave app inside Salesforce. You can find it in the App Launcher — search for “Valorx Wave” and click to open.
From the Wave Dashboard, click Add New → Matrix, or navigate directly to the Matrix Wizard tab.
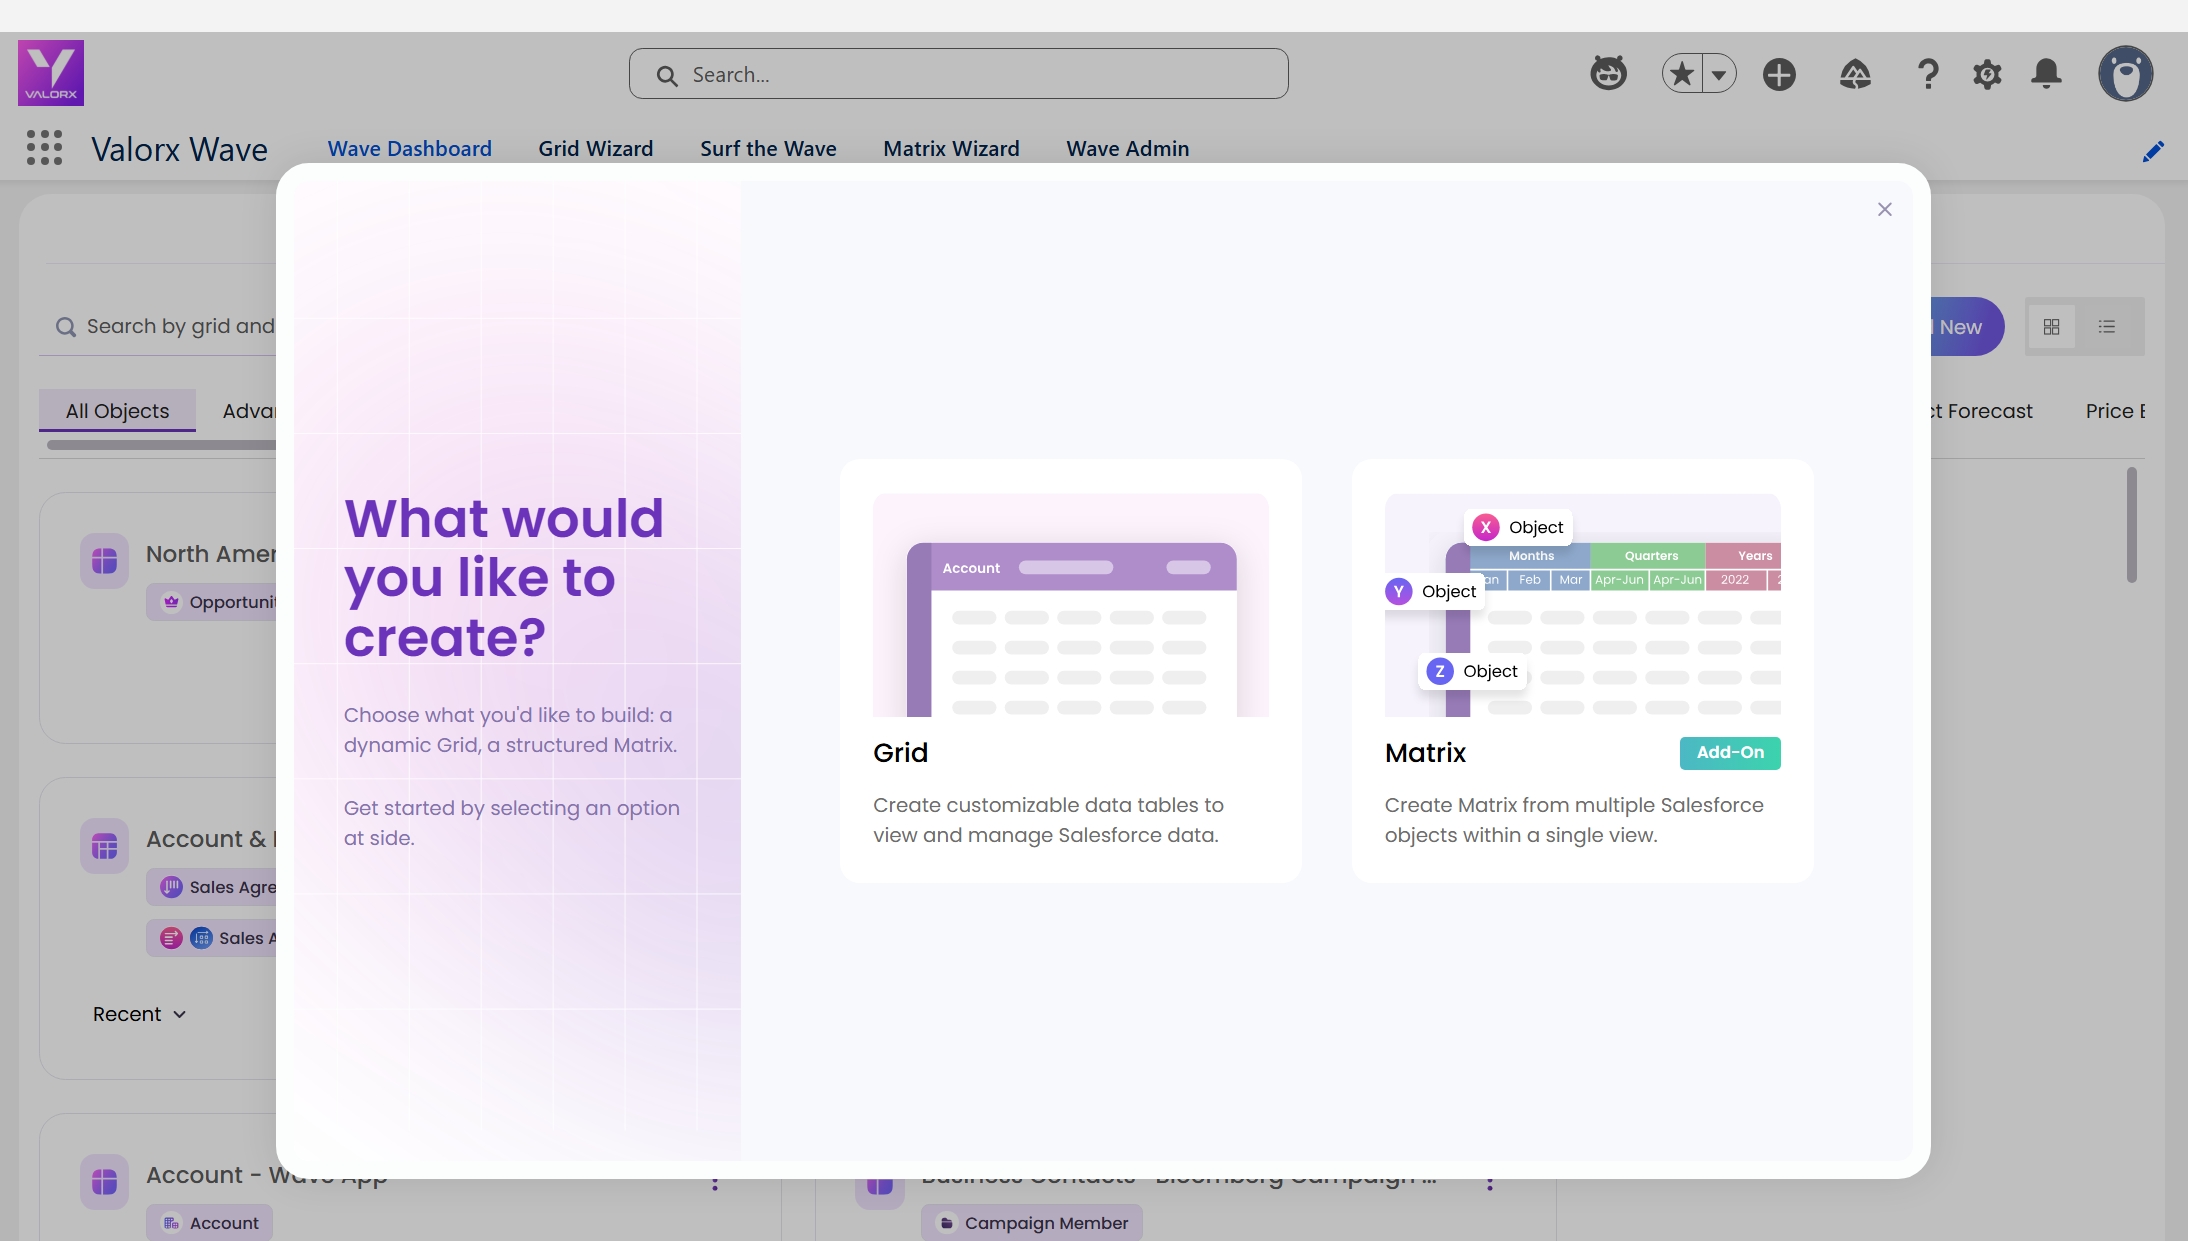
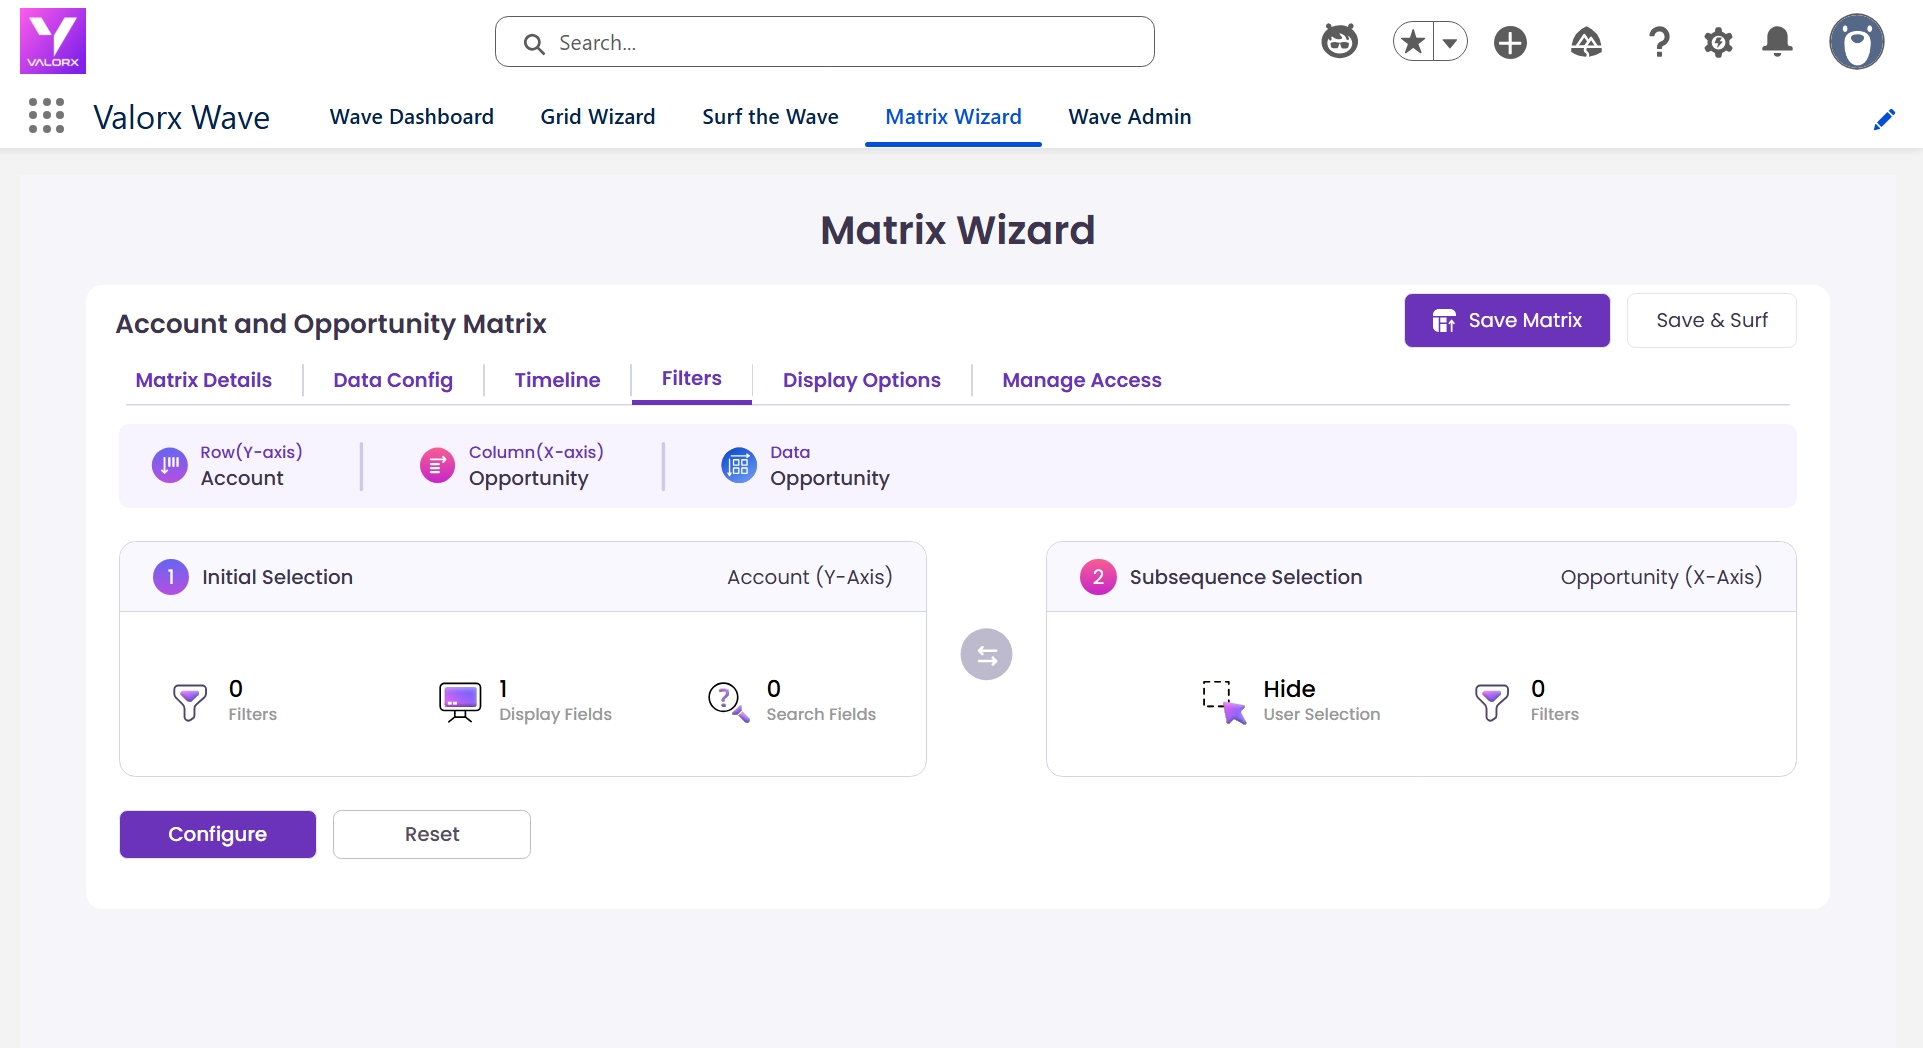
The Matrix Designer opens inside Salesforce. This is a visual wizard that walks you through layout, data config, filters, and display options.
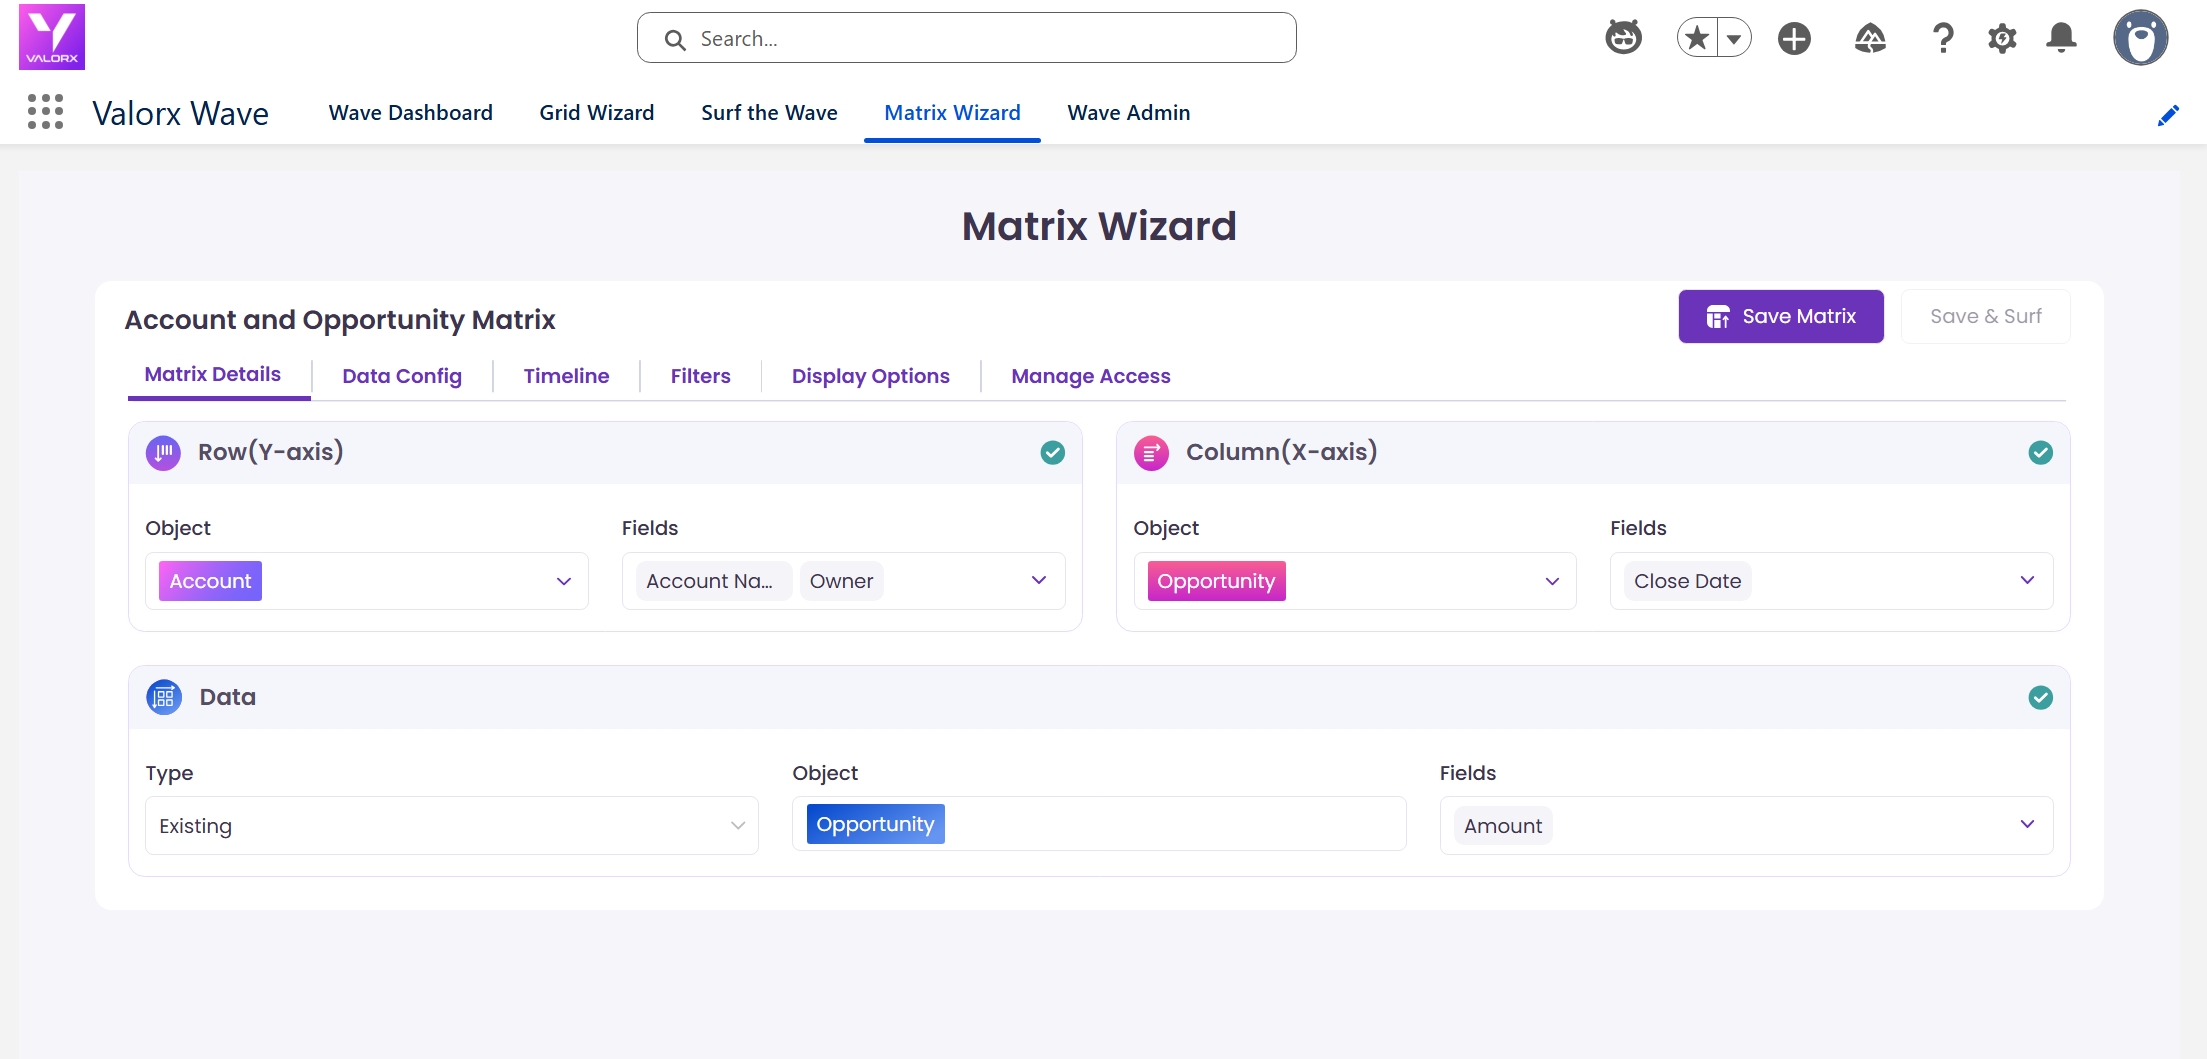
The first panel is Matrix Details. The title auto-generates based on your object selections.
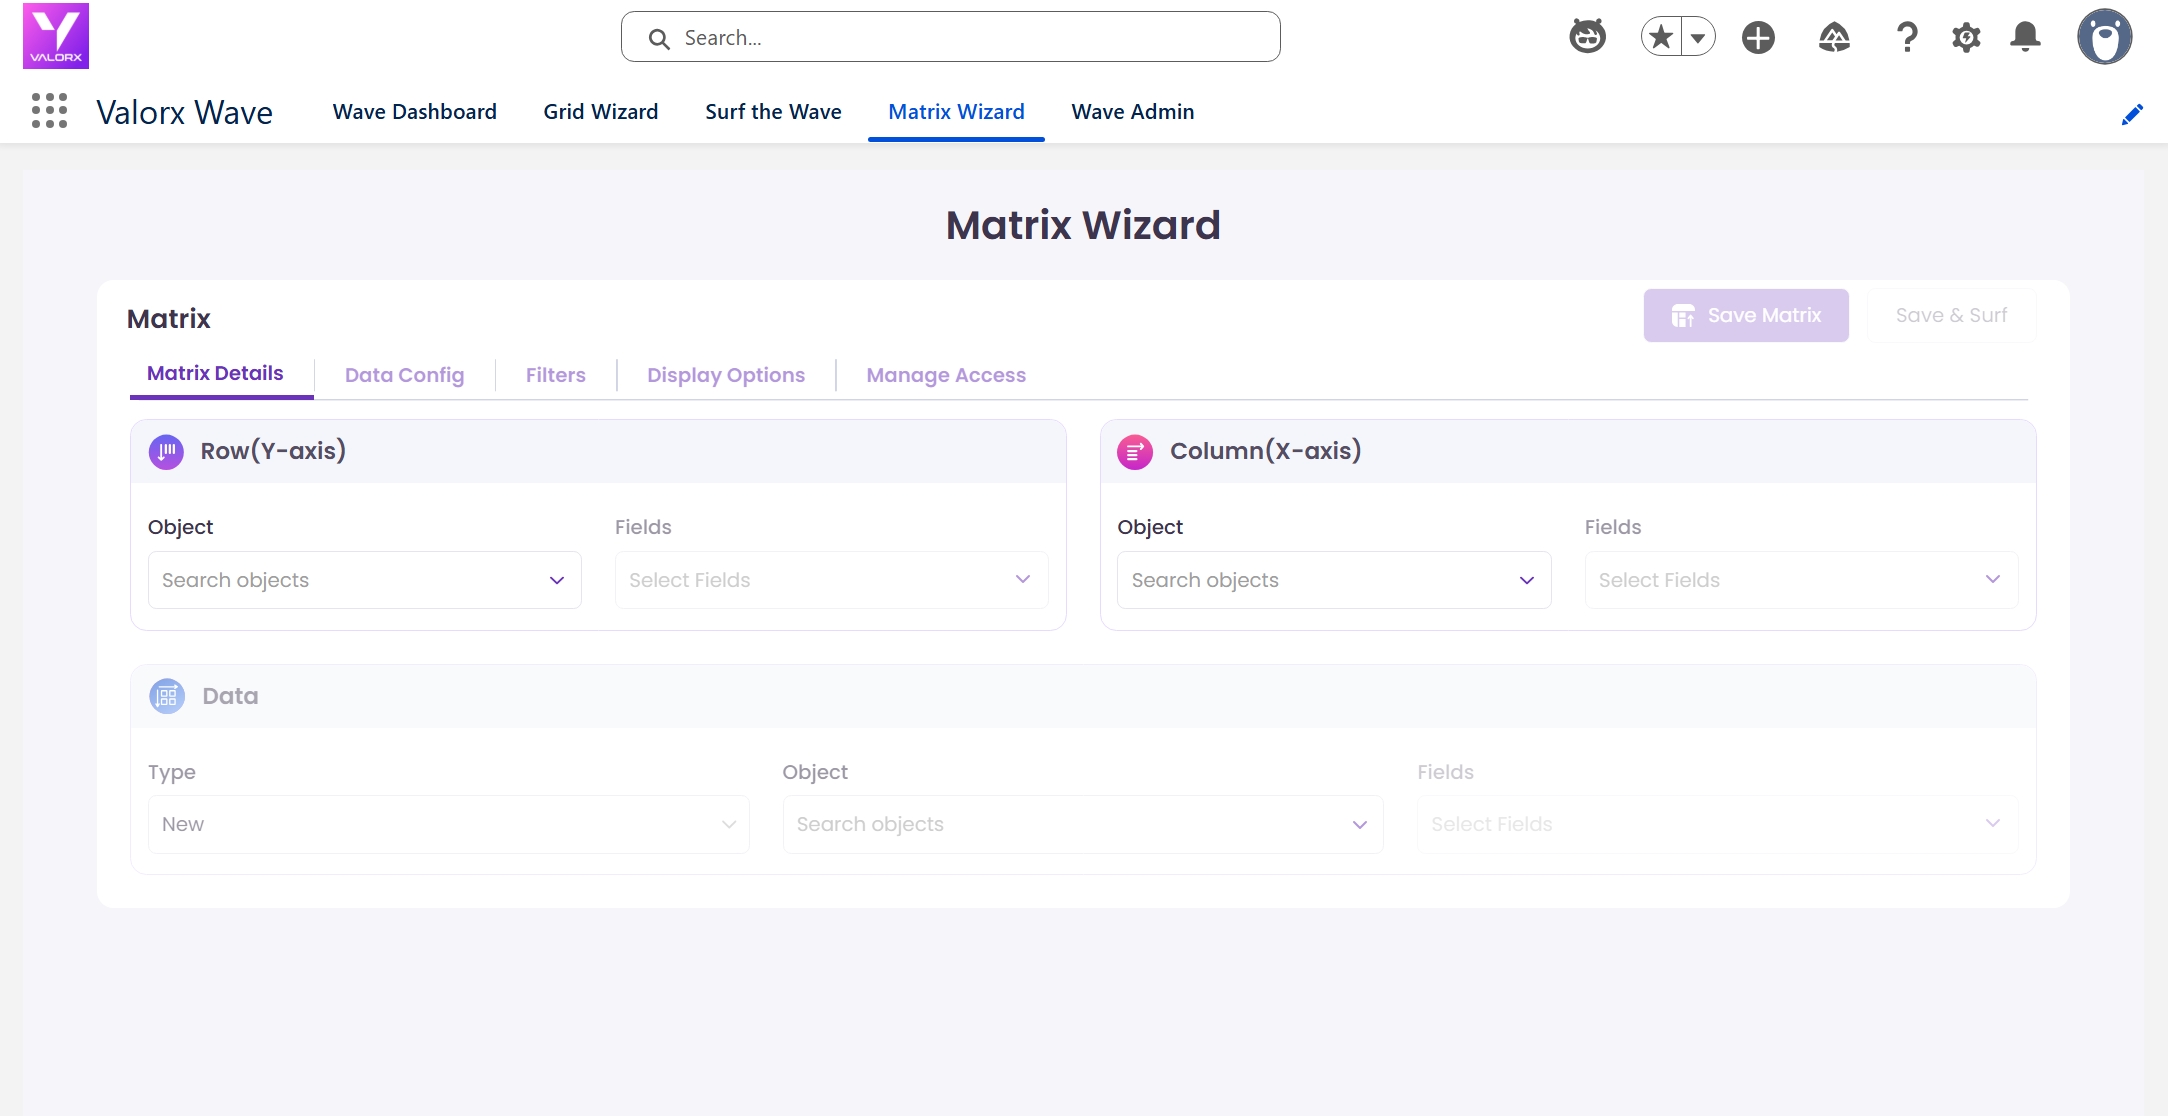
This is the core of the Matrix. You’re assigning a Salesforce object to each axis:
- Row (Y-axis): Choose the object whose records form the rows. Select Account and pick fields like Account Name and Owner.
- Column (X-axis): Choose a field that creates the columns. Select Close Date from Opportunity. Supported types: Date, Lookup, or Picklist.
- Data (Measure): Select the fields whose values fill the cells. Choose Amount from Opportunity.
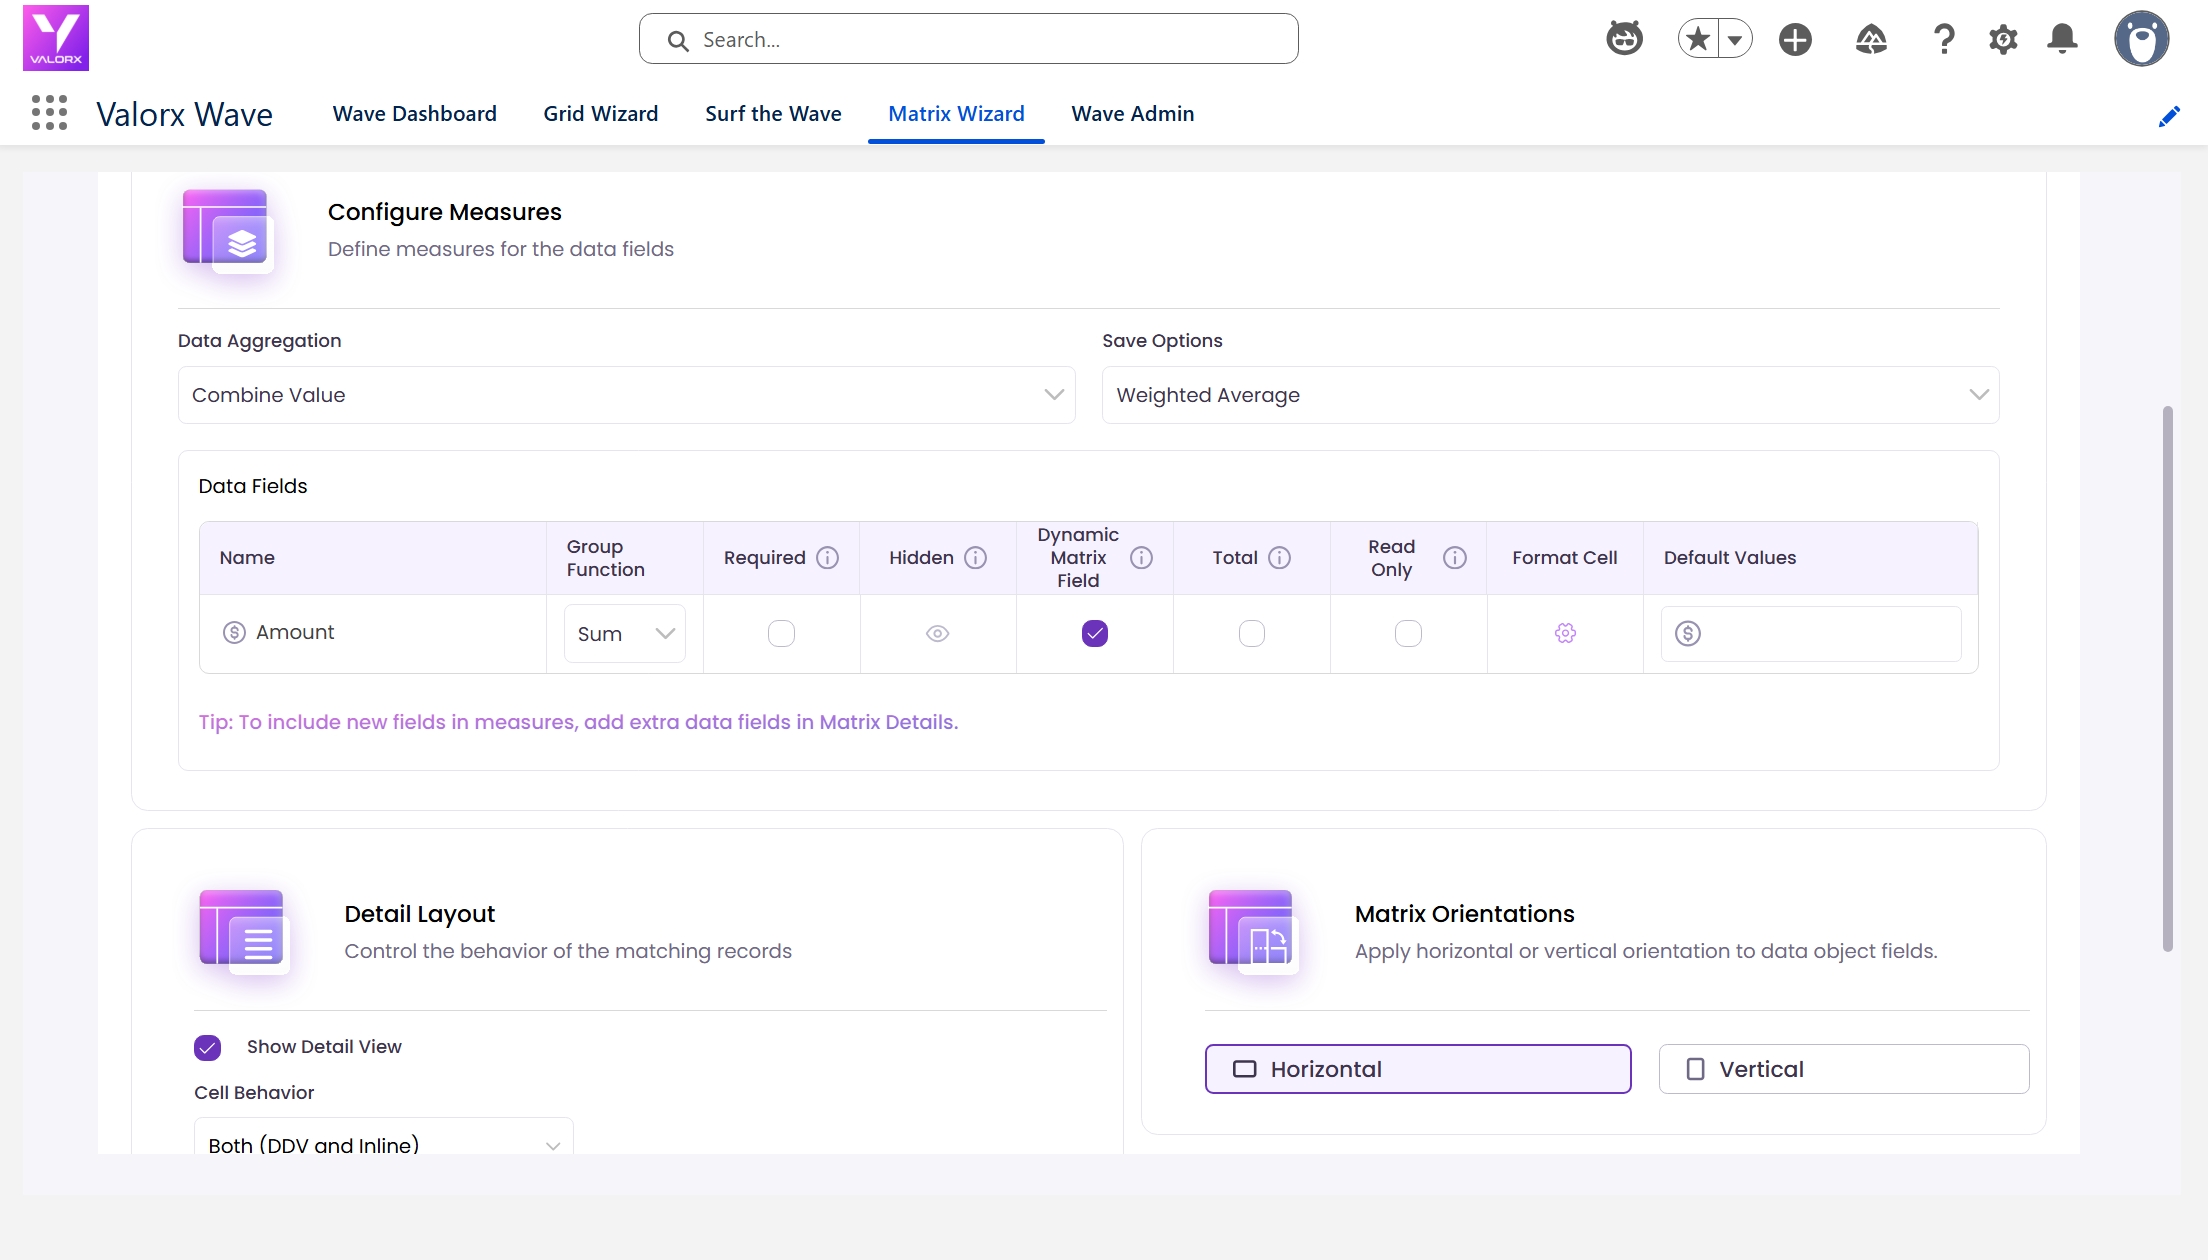
In the Data Config tab, configure how values are aggregated:
- Aggregation: Choose Combine Value → Sum to total Opportunity amounts per Account per month.
- Save Options: Select Weighted Average or Equal Distribution to control how edited values distribute back to records.
- Orientation: Choose Horizontal (data fields as columns) or Vertical (data fields as rows).
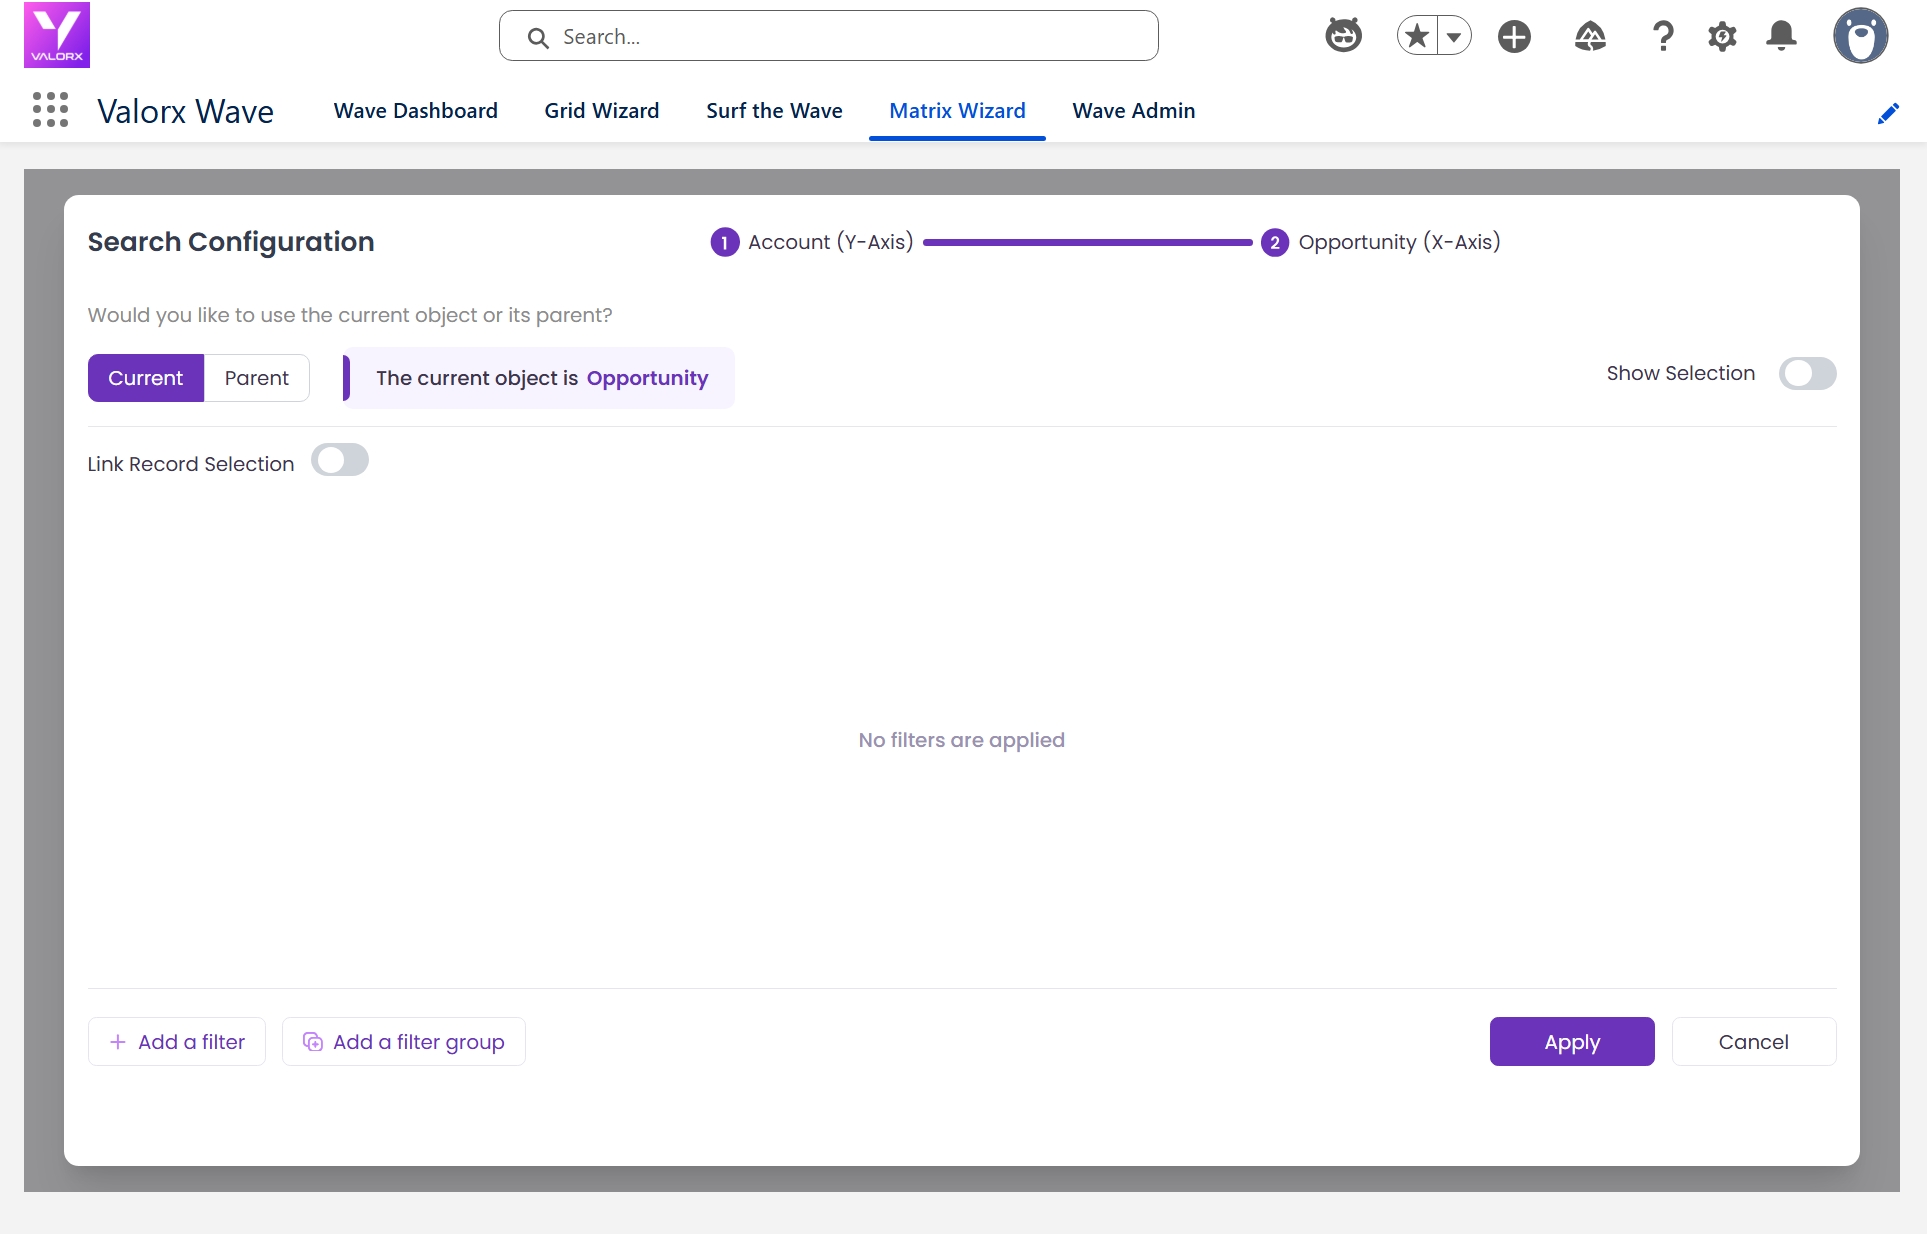
Click the Filter button to define which records appear in your Matrix:
- Initial Selection (Y-axis): Choose which Account fields to display in the record picker. Enable search filters.
- Subsequent Selection (X-axis): By default linked to your Y-axis. Unlink for independent filtering.
- Choose Single or Multi record selection mode, then click Submit.
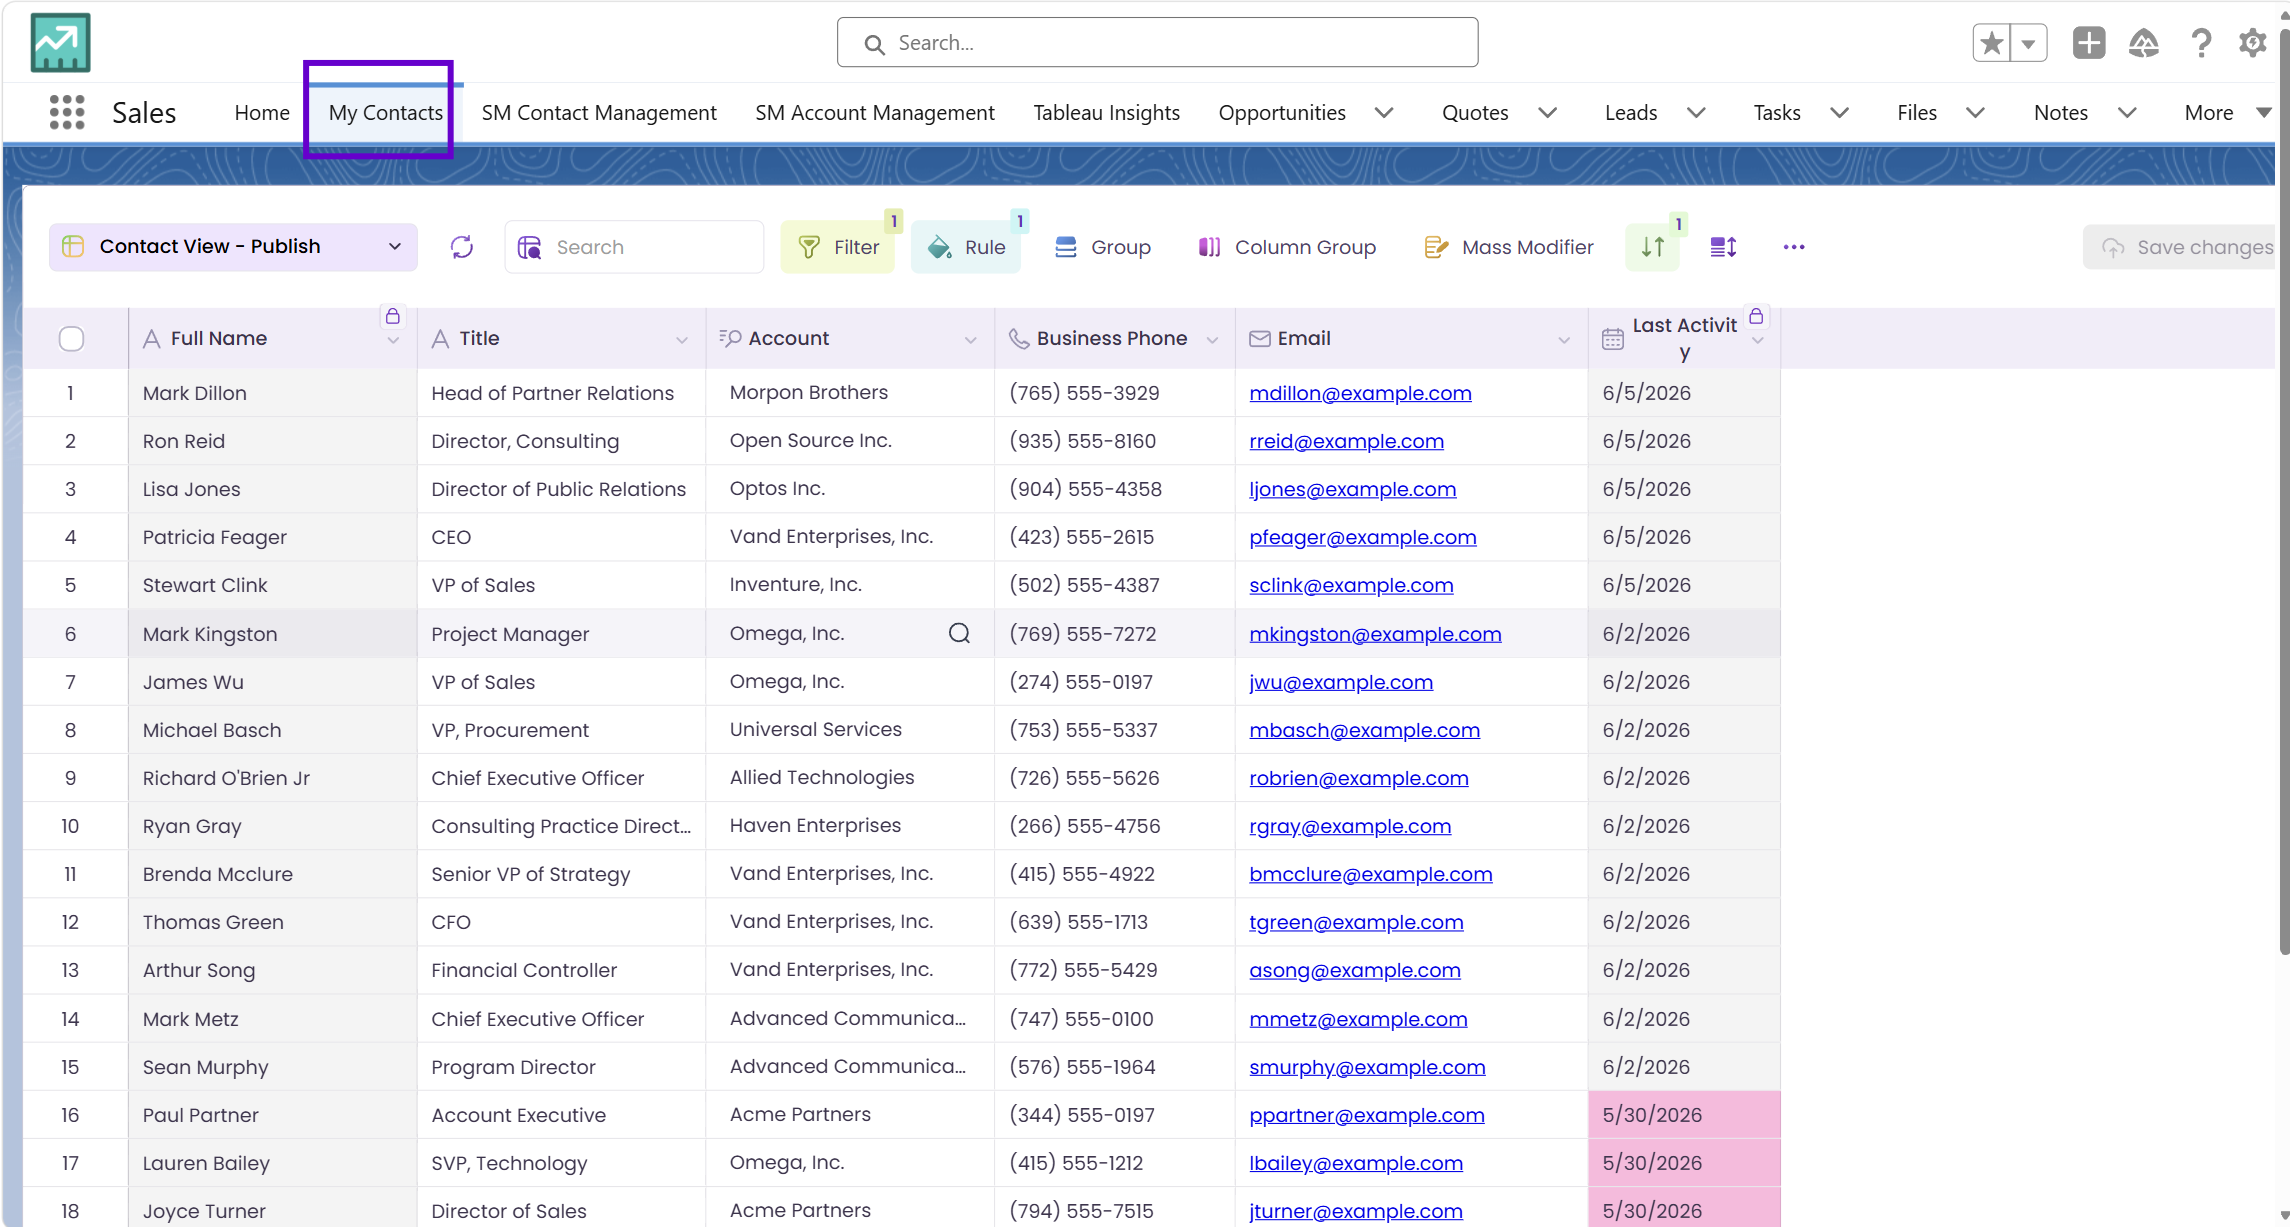
Click Save Matrix, then Save and Surf to open the Matrix runtime inside Salesforce. Select your Accounts from the record picker and your Matrix loads with live data.
You’re now looking at the exact outcome from the top of this guide — a live, editable multi-object pivot table, fully embedded in your Salesforce environment. No new windows, everything stays in Salesforce.
Matrices your team can build today
The steps above work for any Salesforce data. Here are three popular configurations.
Your Monday morning, before & after
The weekly pipeline review used to take half a day. Here’s what changes.
Ready to build your first Matrix?
Install the Wave embedded package, follow the 6 steps above, and see your Salesforce data like you’ve never seen it before.

Choose the workflow you need:
Try Wave in browser Extension

Try Wave in Salesforce

Try Fusion In Excel

Enhancing Salesforce for industry leaders