Forecast 360
Pull accounts by region into Excel, adjust quarterly forecasts with formulas, and push them back to Salesforce.

Try it yourself
Forecast with Salesforce data in Excel
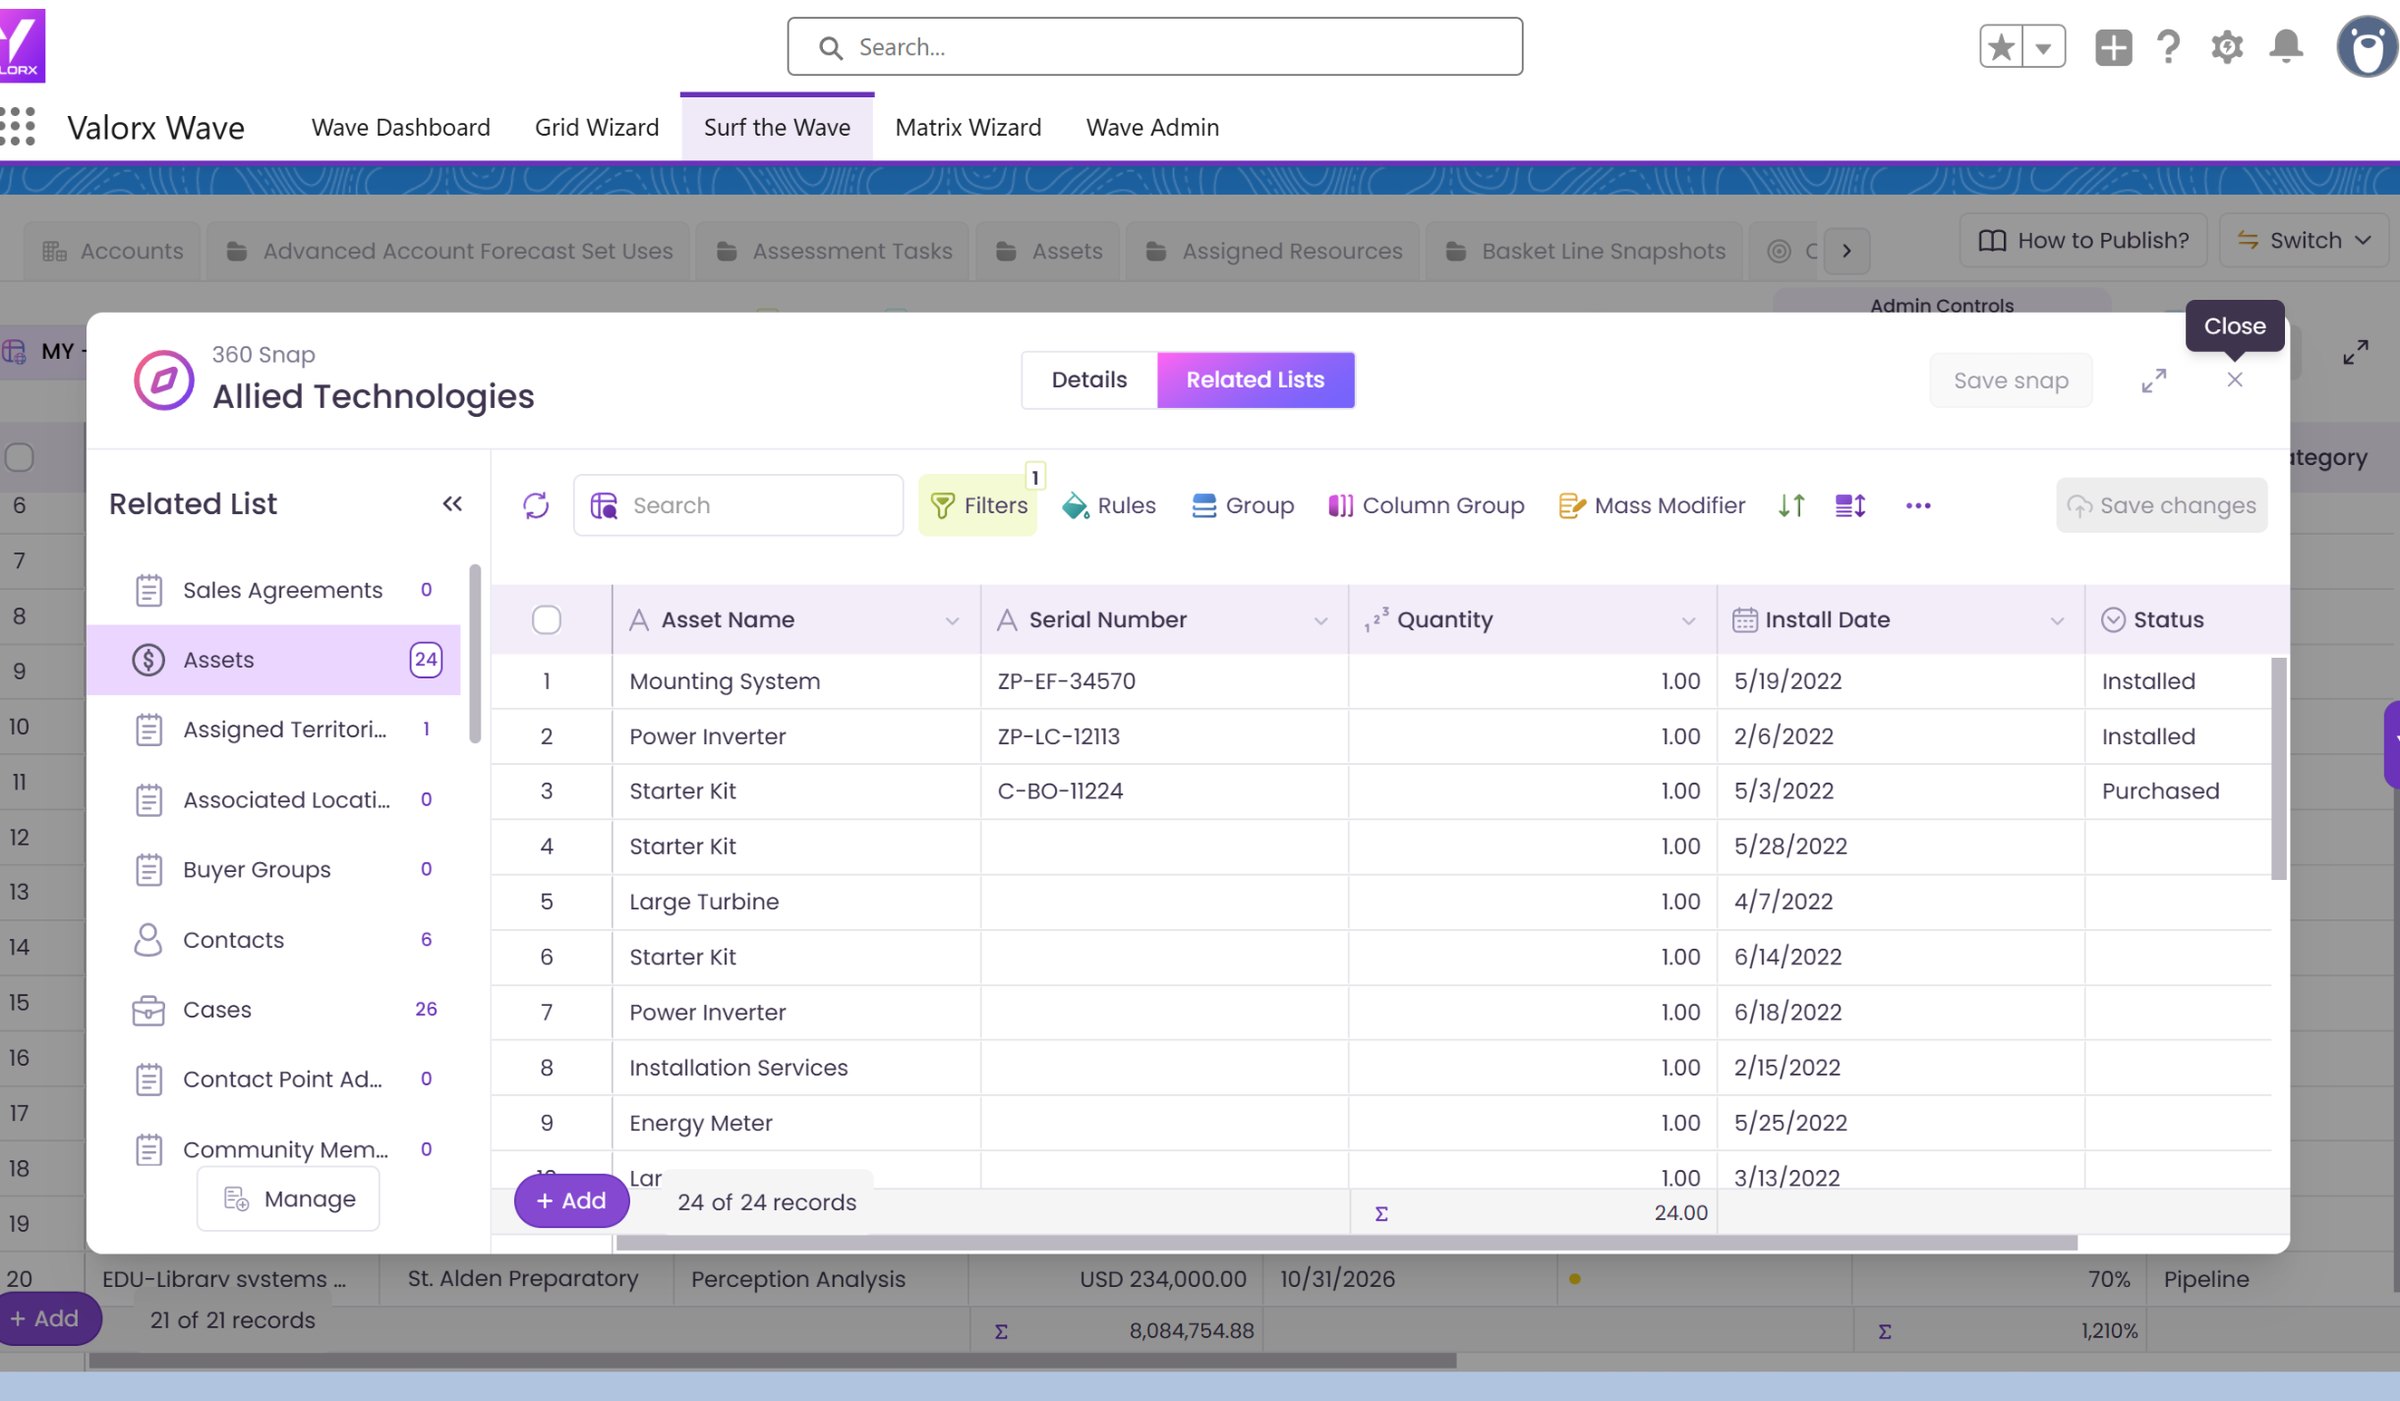
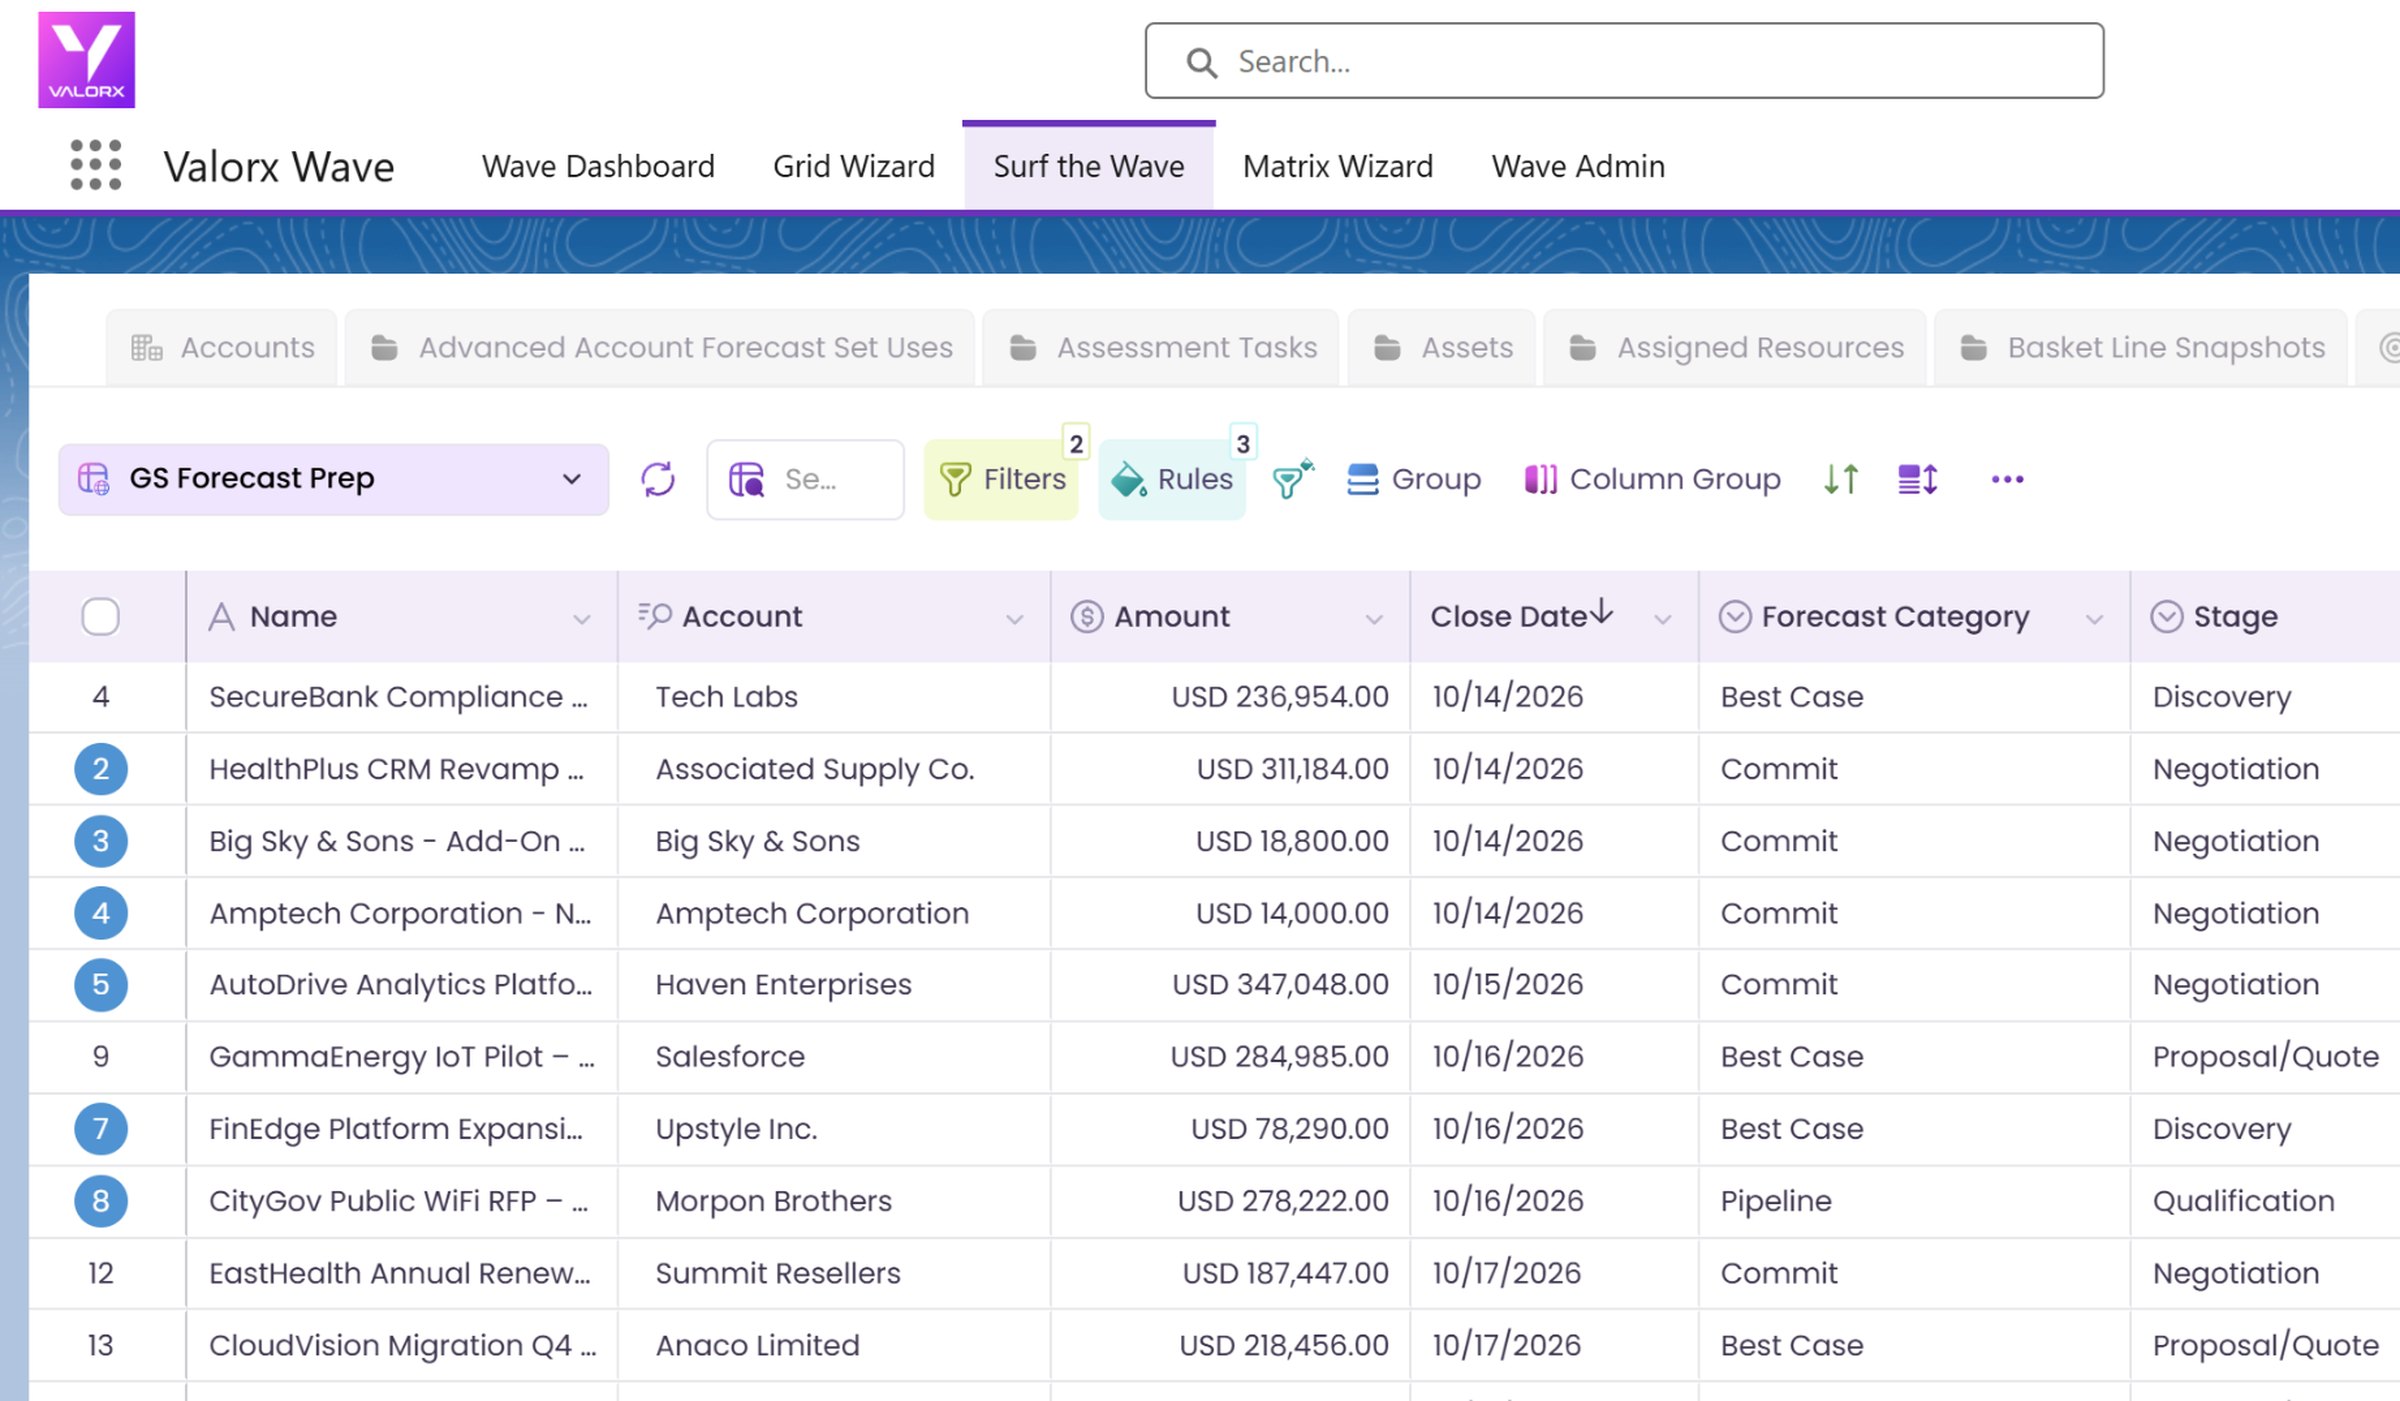
This walkthrough shows Forecast 360 in Fusion: filter accounts by name or region, load their sales agreements and opportunities, and see historical and forecast figures by quarter for each product. Apply changes such as a 20% uplift with Excel formulas, then save to push the forecast back to Salesforce.


Ready to try it in your own org?
Install Wave free and build your first grid in minutes, or book a demo and we will walk through your use case.