Making Your First Grid
Here’s what you’re building
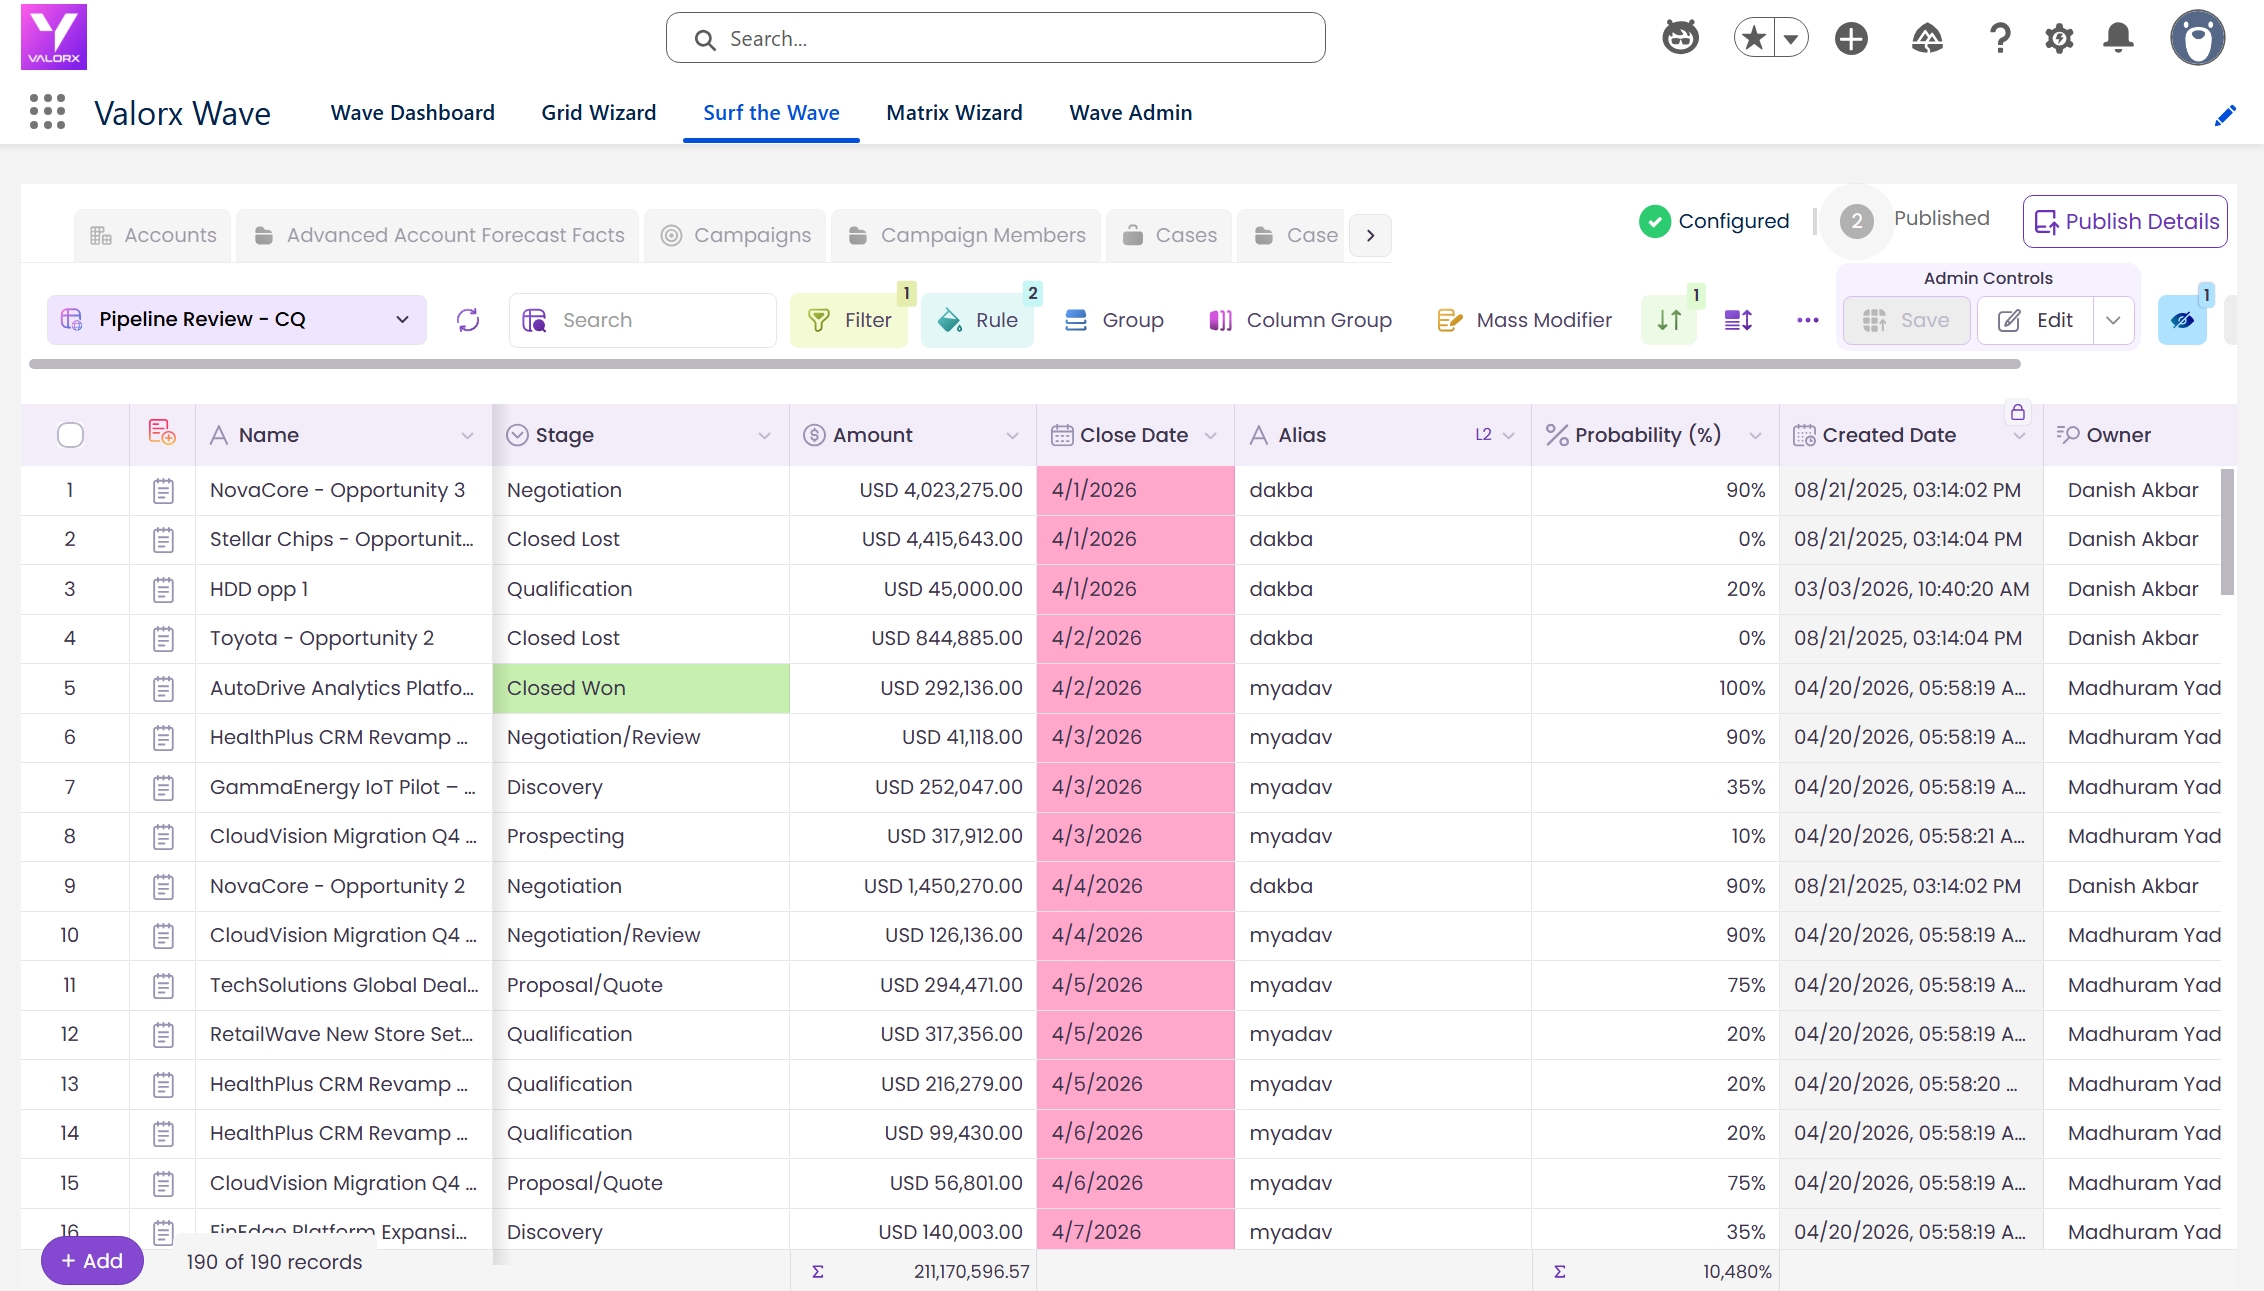
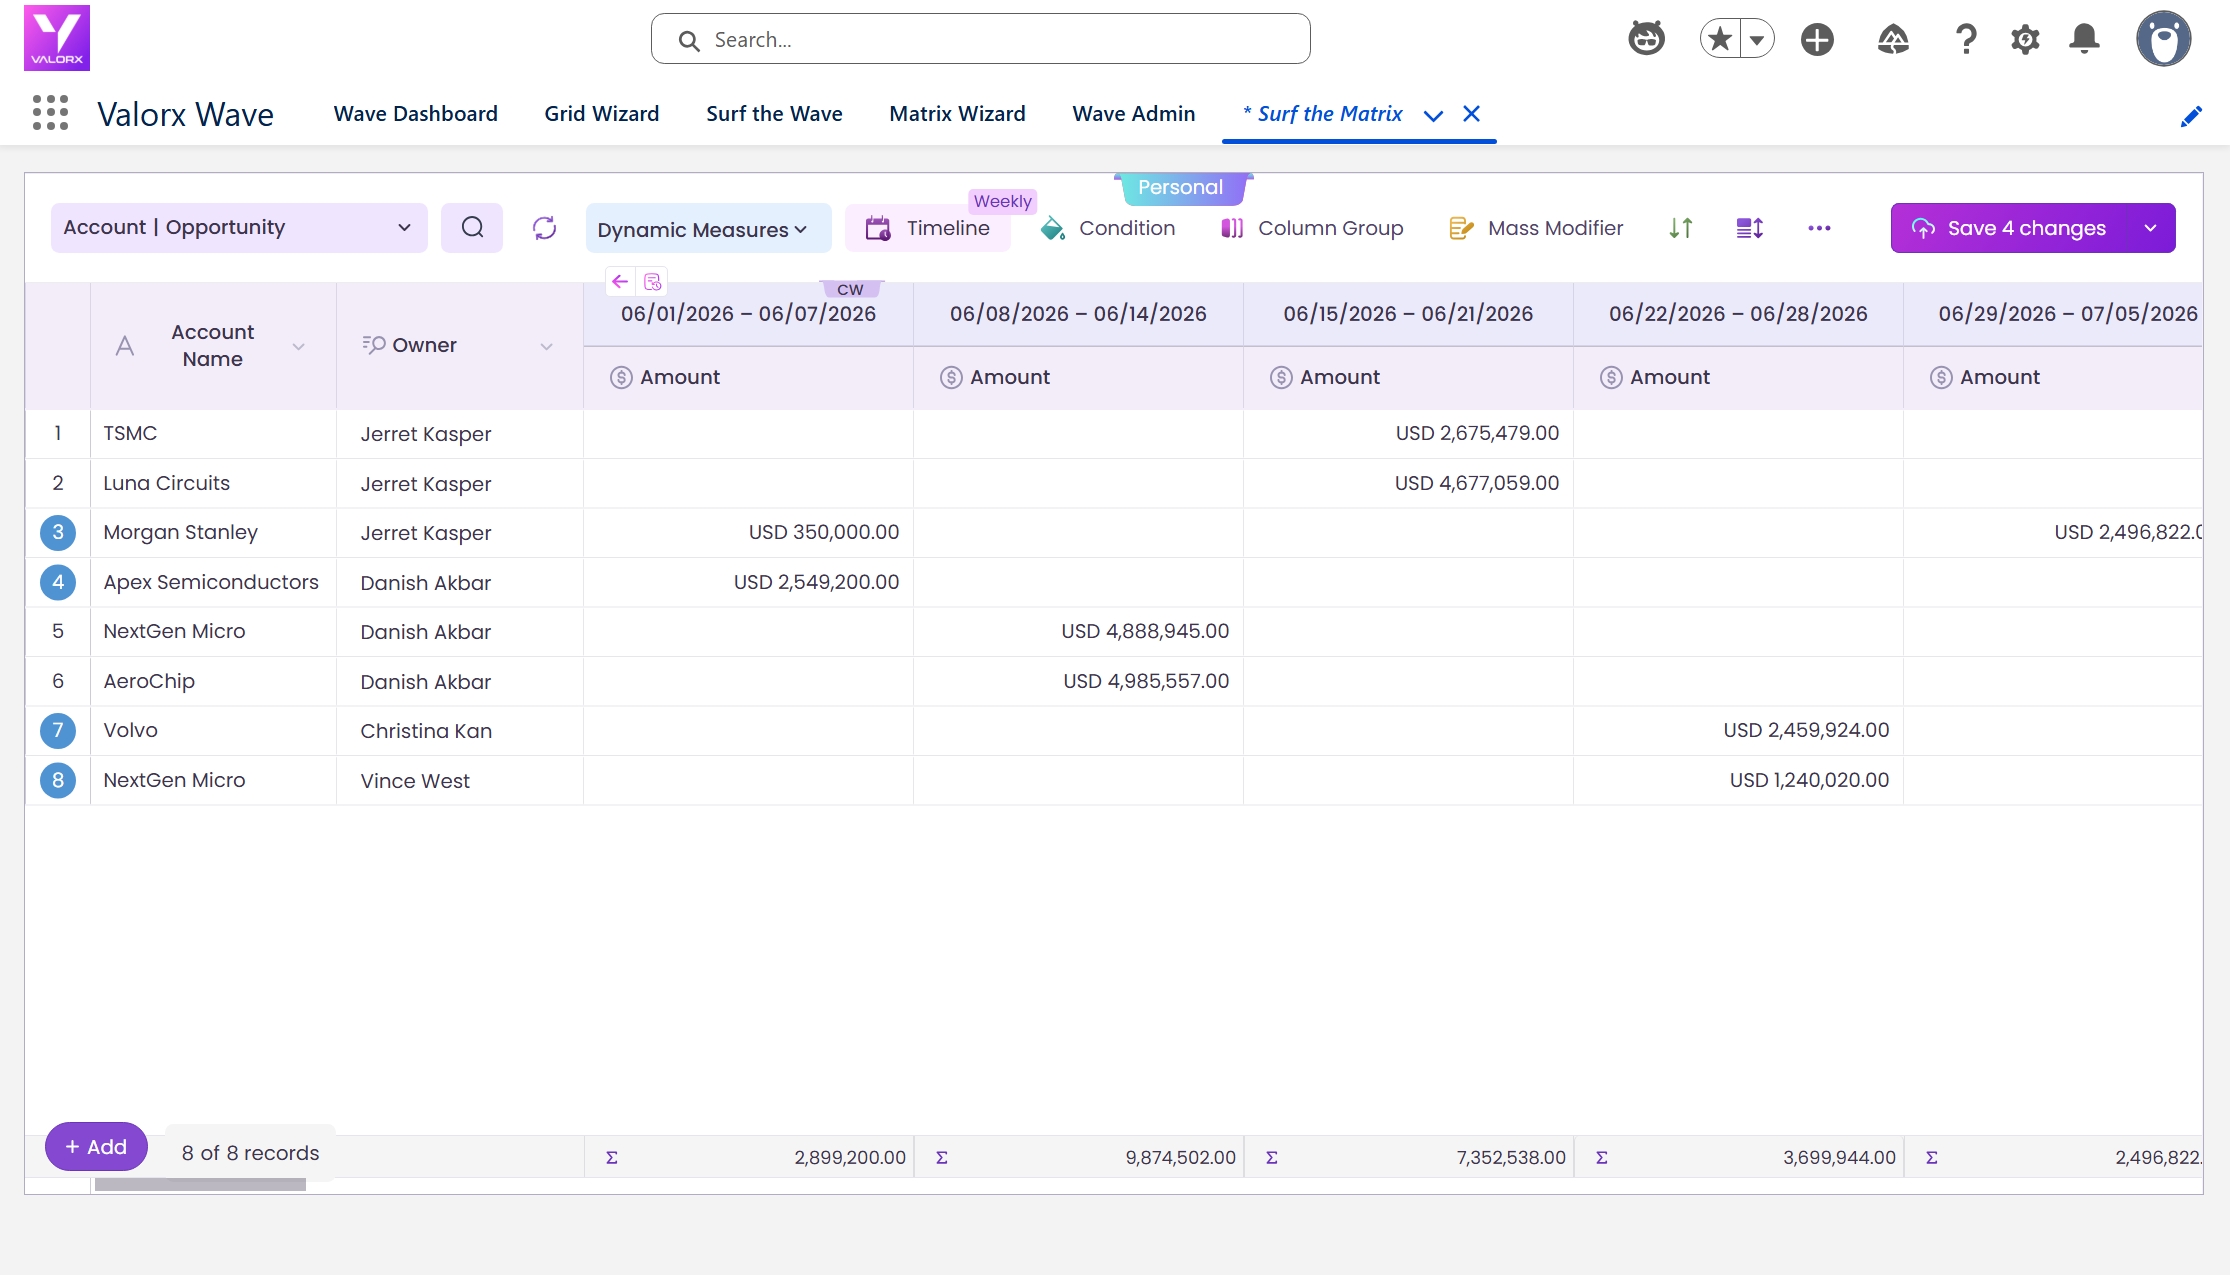
Before we walk through the steps, here’s the end result — the grid you’ll have running in under 5 minutes.
Time: ~5 minutes | Role: Any Wave User | Platform: Wave Embedded in Salesforce
Prerequisites
- Valorx Wave embedded package installed in your Salesforce org
- A Designer or Admin role to create grids (Standard Users can view and interact with shared grids)
- A Salesforce object you want to work with (e.g. Opportunity, Account, Case, Contact — or any custom object)
Build your first Grid inside Salesforce
We’ll use Opportunities as the example — the most common first grid for sales teams.
Navigate to the Valorx Wave app inside Salesforce. You can find it in the App Launcher (the waffle icon in the top-left) — search for “Valorx Wave” and click to open.
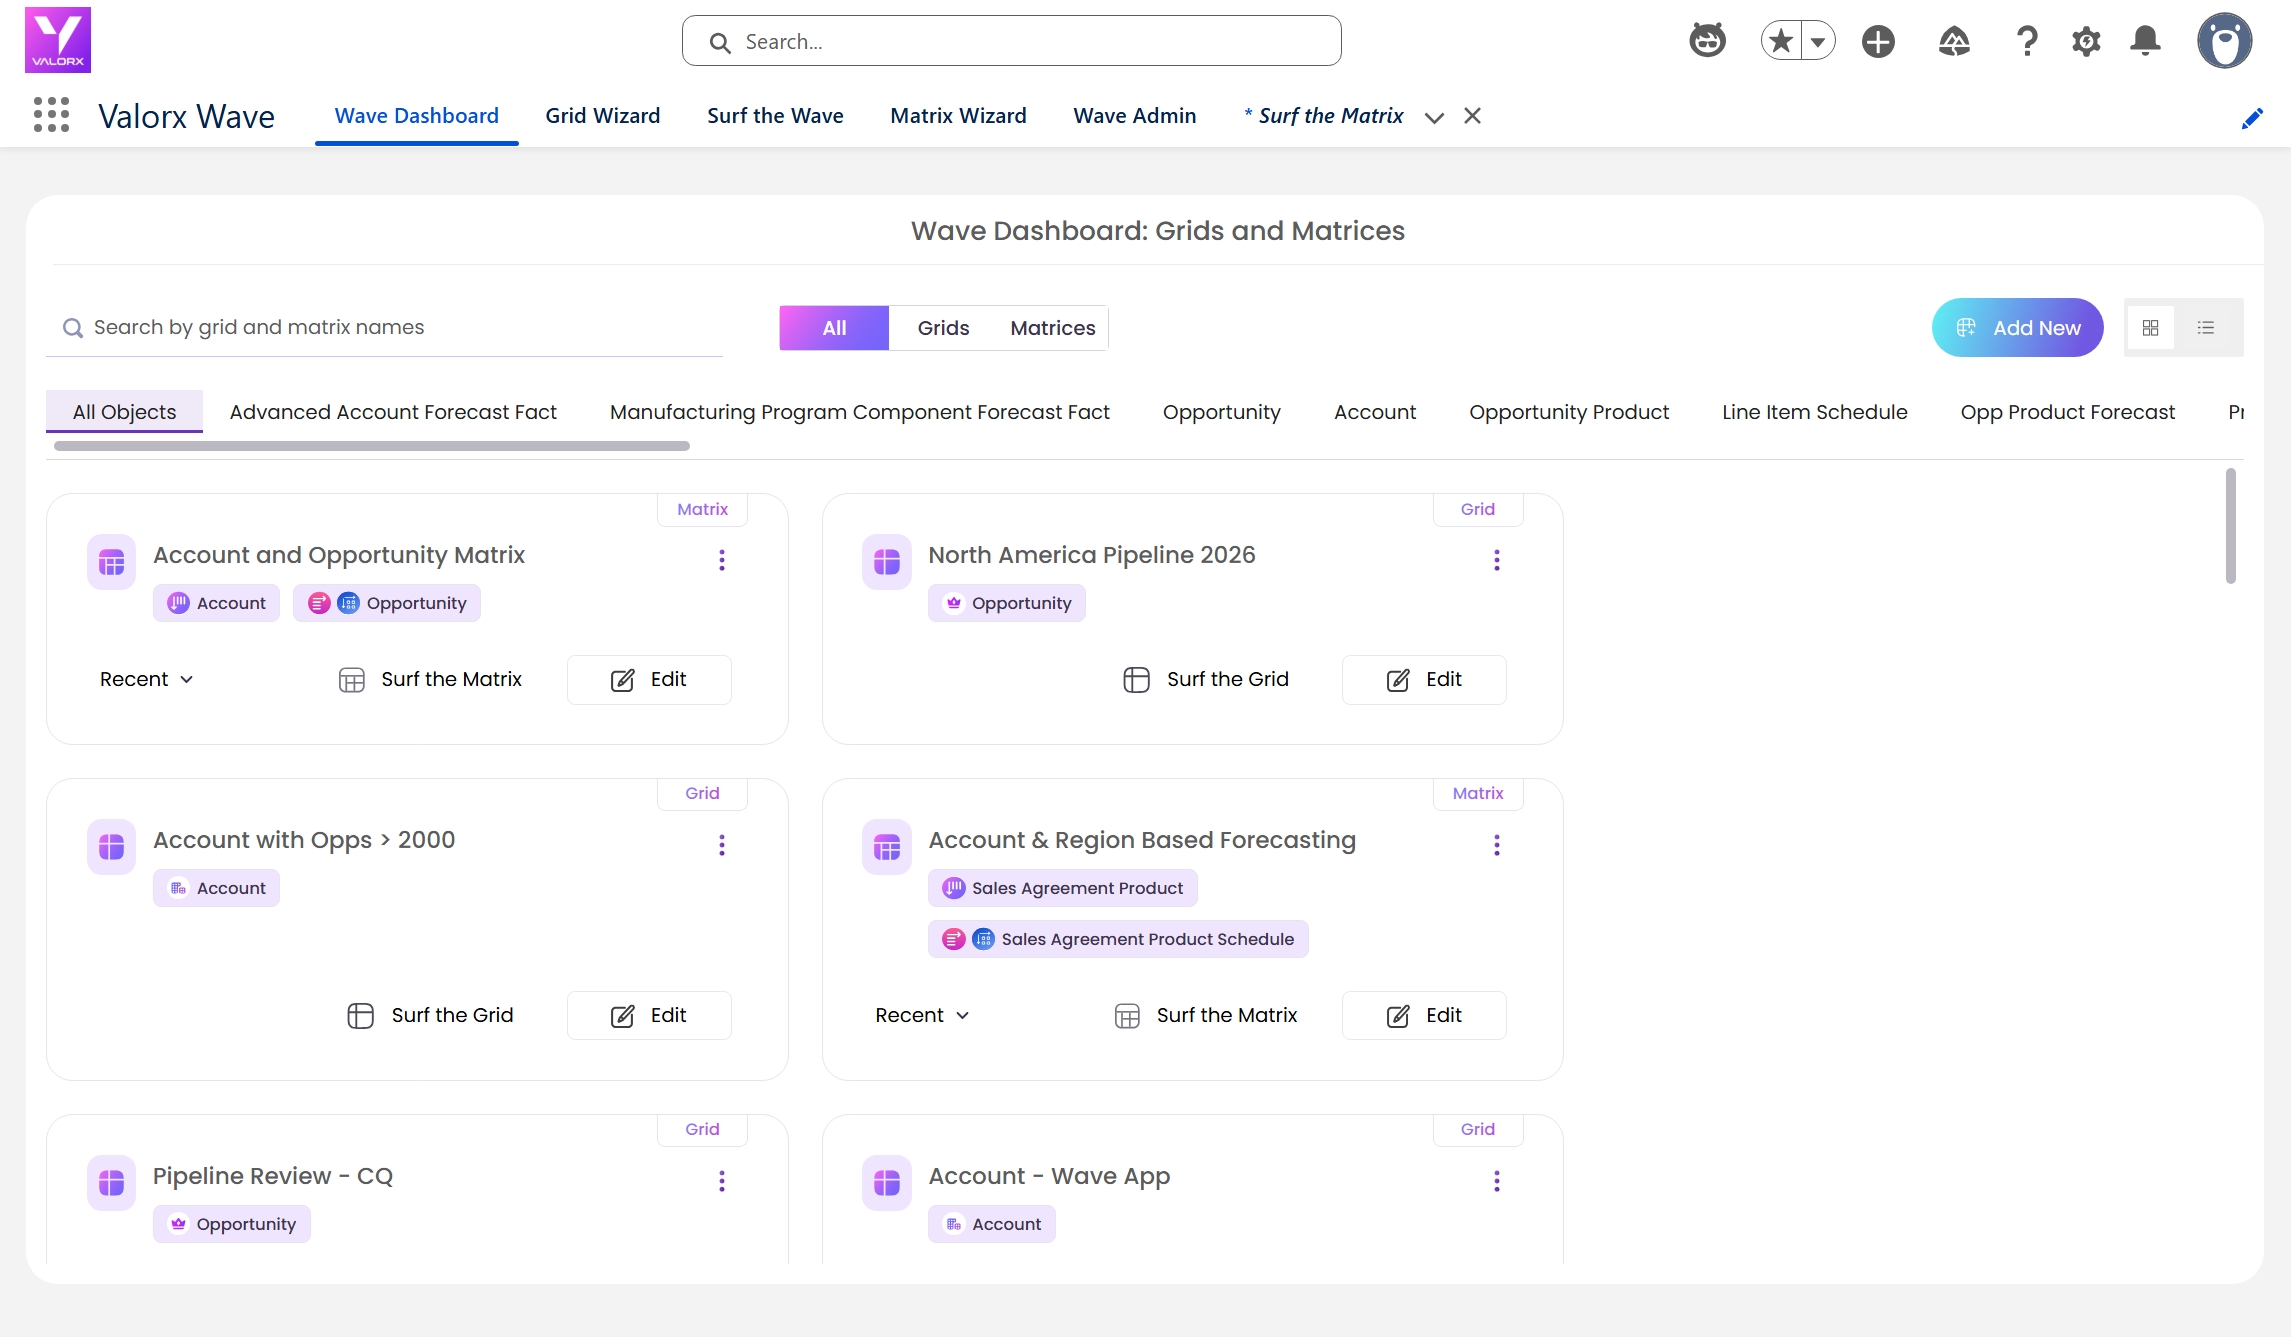
You’ll land on the Wave Dashboard tab. If this is your first time, you’ll see a “Create Your 1st Grid” prompt. Otherwise, click the Add New button in the top right, or navigate to the Grid Wizard tab.
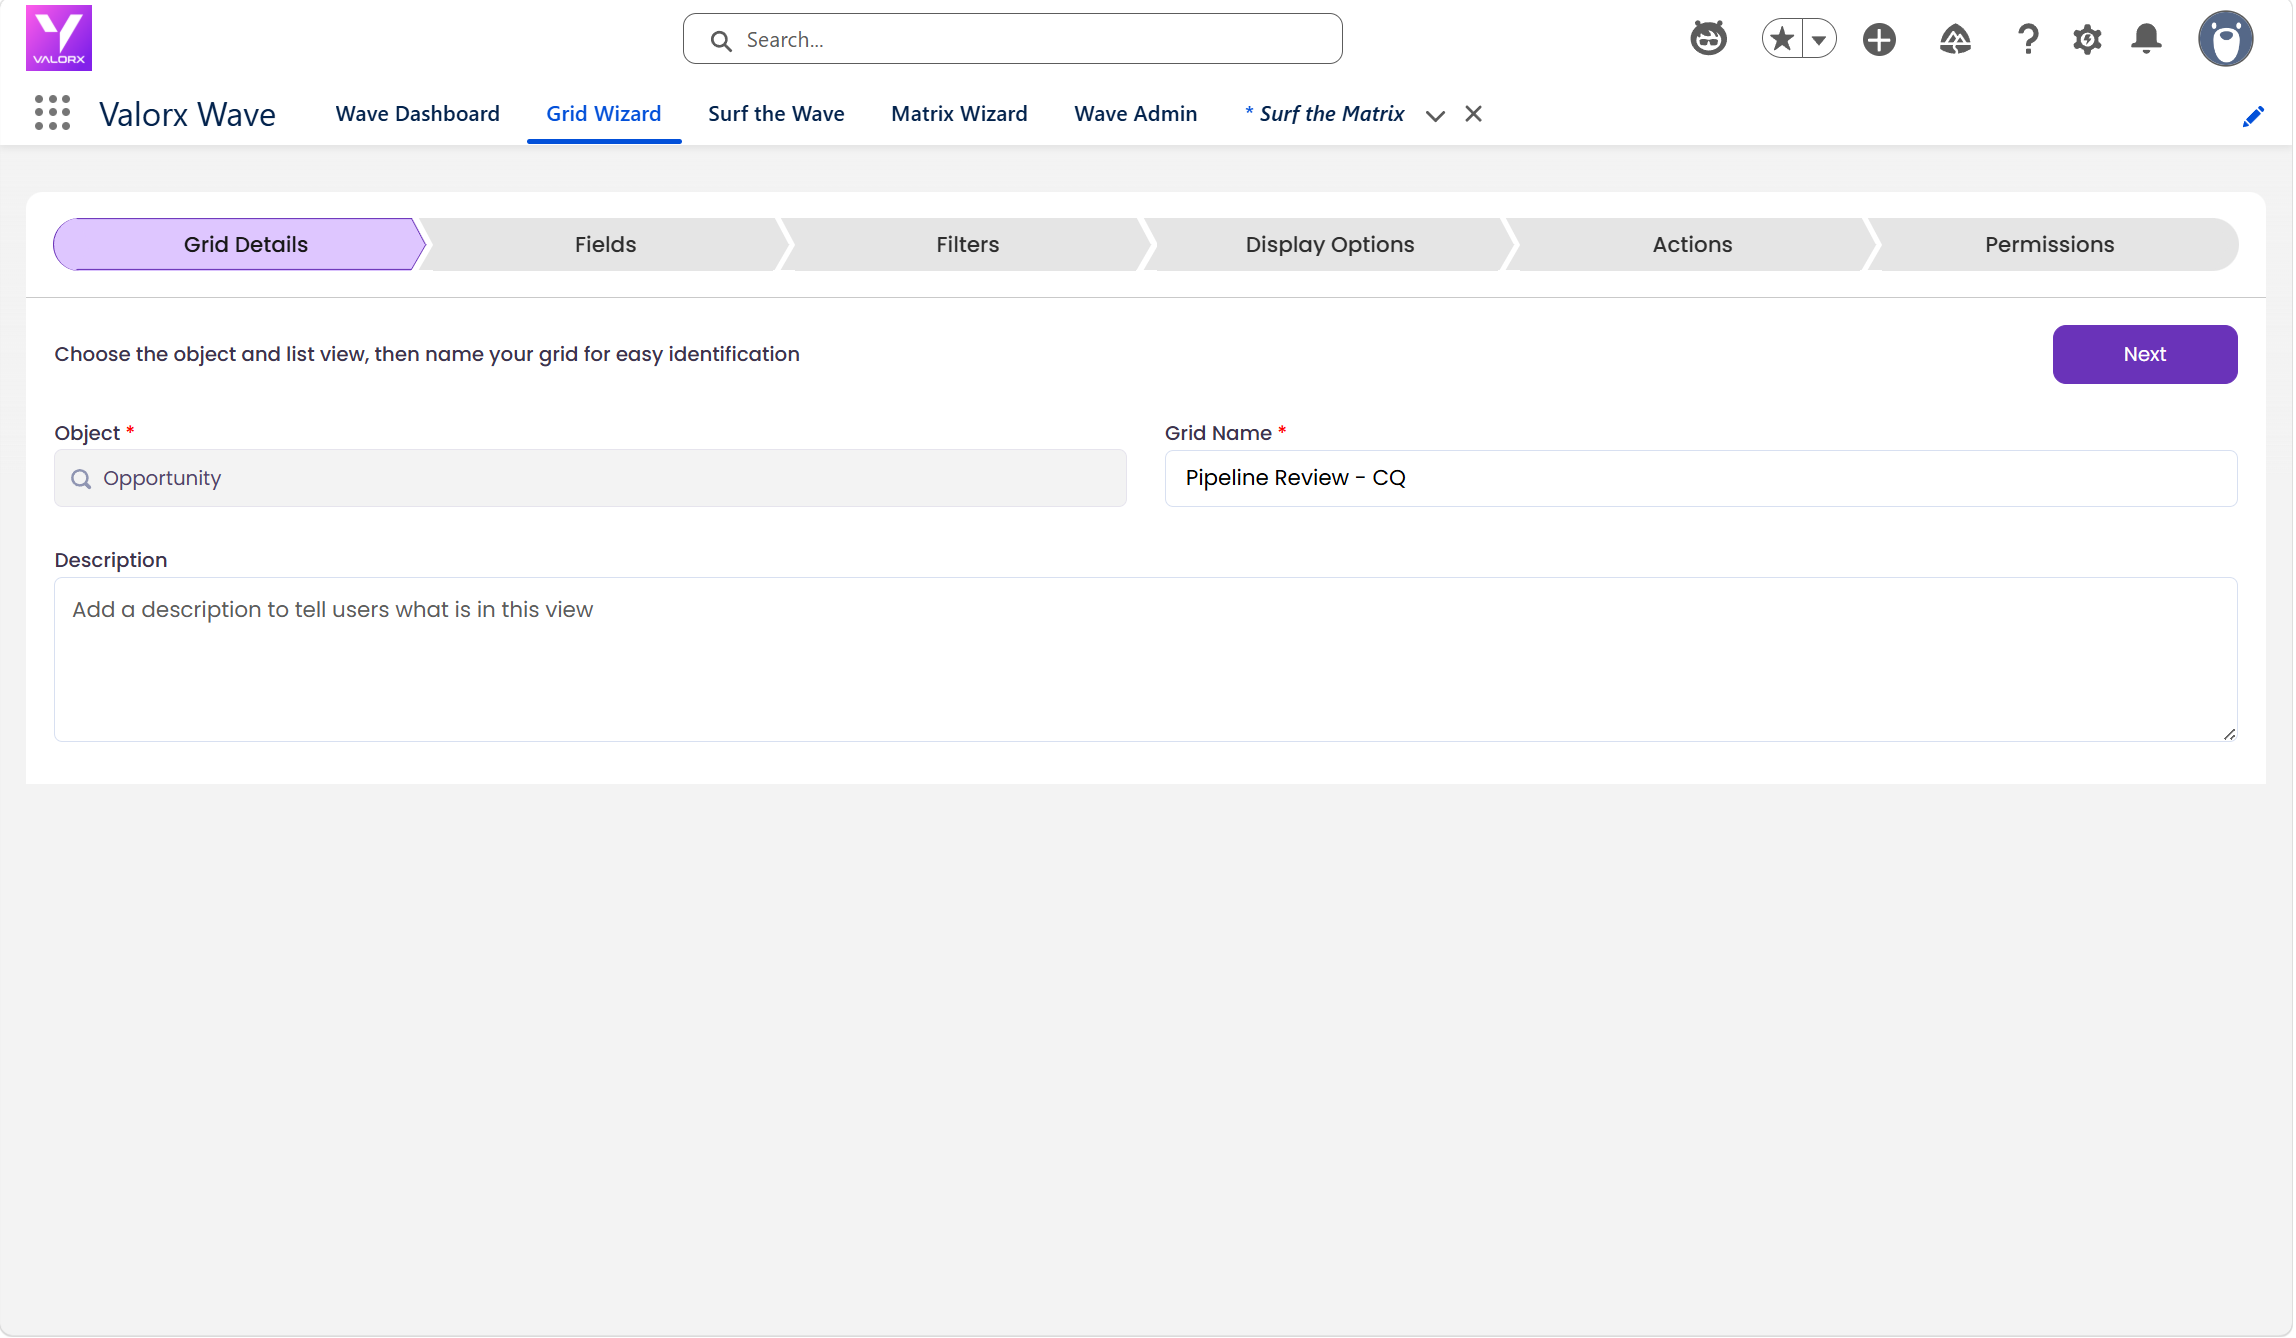
The Grid Wizard opens inside Salesforce. First, search for and select your Salesforce object — pick Opportunity for this example.
Then choose how to start:
- Create from Scratch: Start with a blank grid and manually add the fields you want.
- Select from an Existing List View: Pull in a Salesforce list view you’ve already built — fields and filters carry over automatically.
- Give your grid a name (e.g. “Pipeline Review — CQ”) and optionally add a description. Click Next
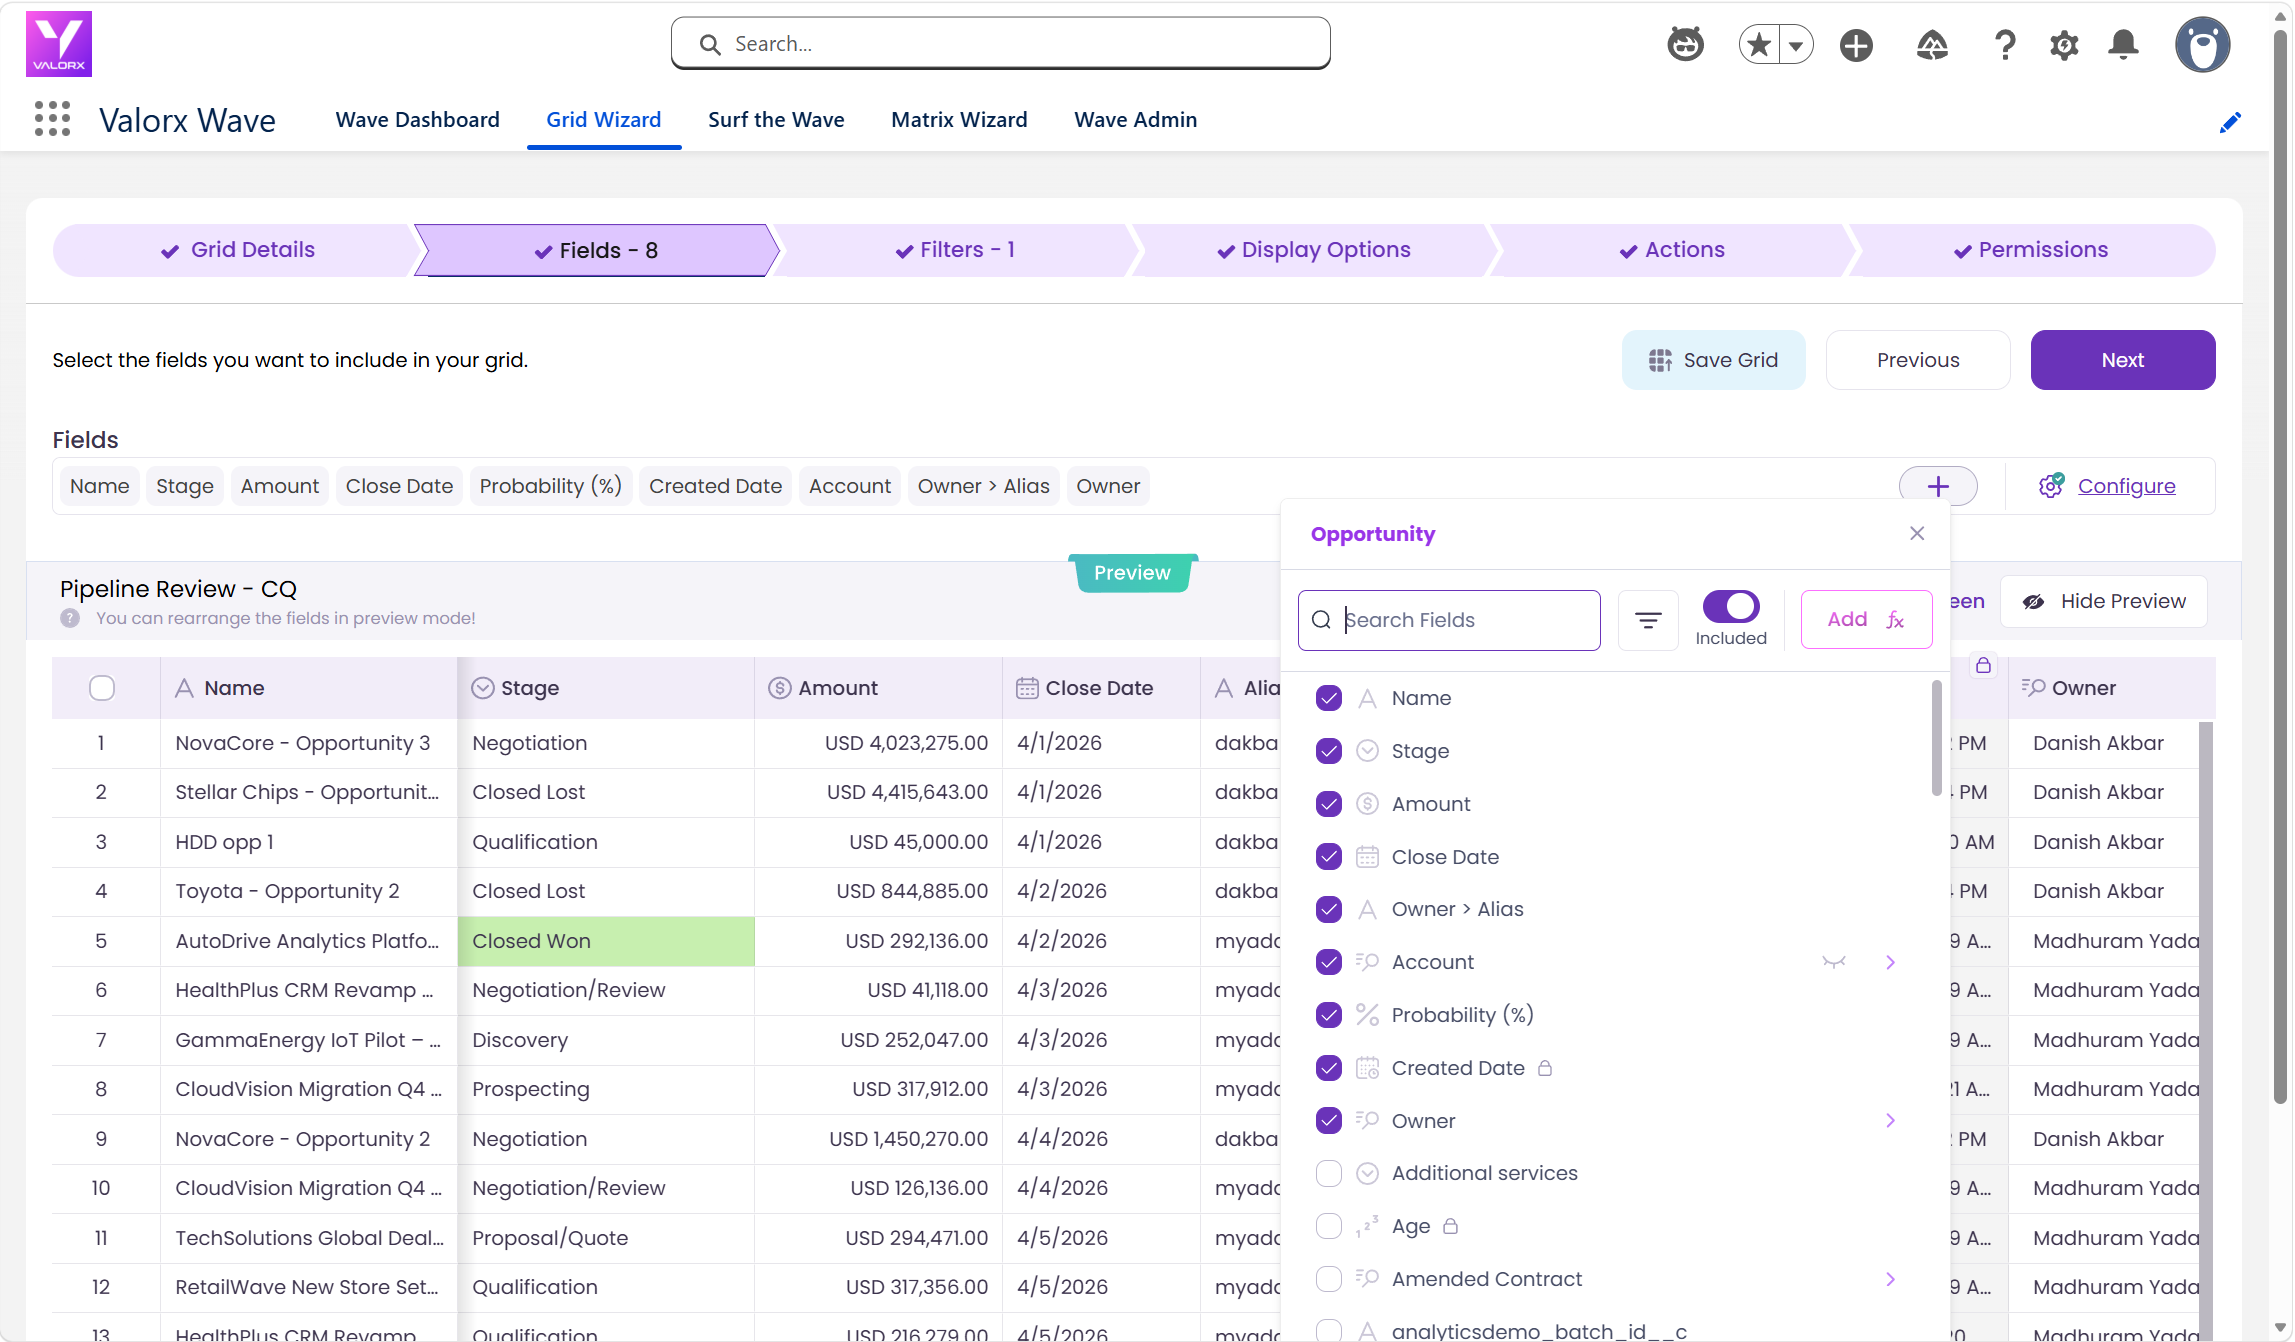
Select the fields that will appear as columns in your grid. Use the + button to add fields and drag-and-drop to reorder them. For our pipeline grid, pick:
Opportunity Name, Stage, Amount, Close Date, Owner, Account Name, Probability
You can also configure fields here — rename column headers, mark fields as required, set defaults for new records, or hide fields that should run in the background without appearing in the grid.
Click Next when you’re happy with the field selection.
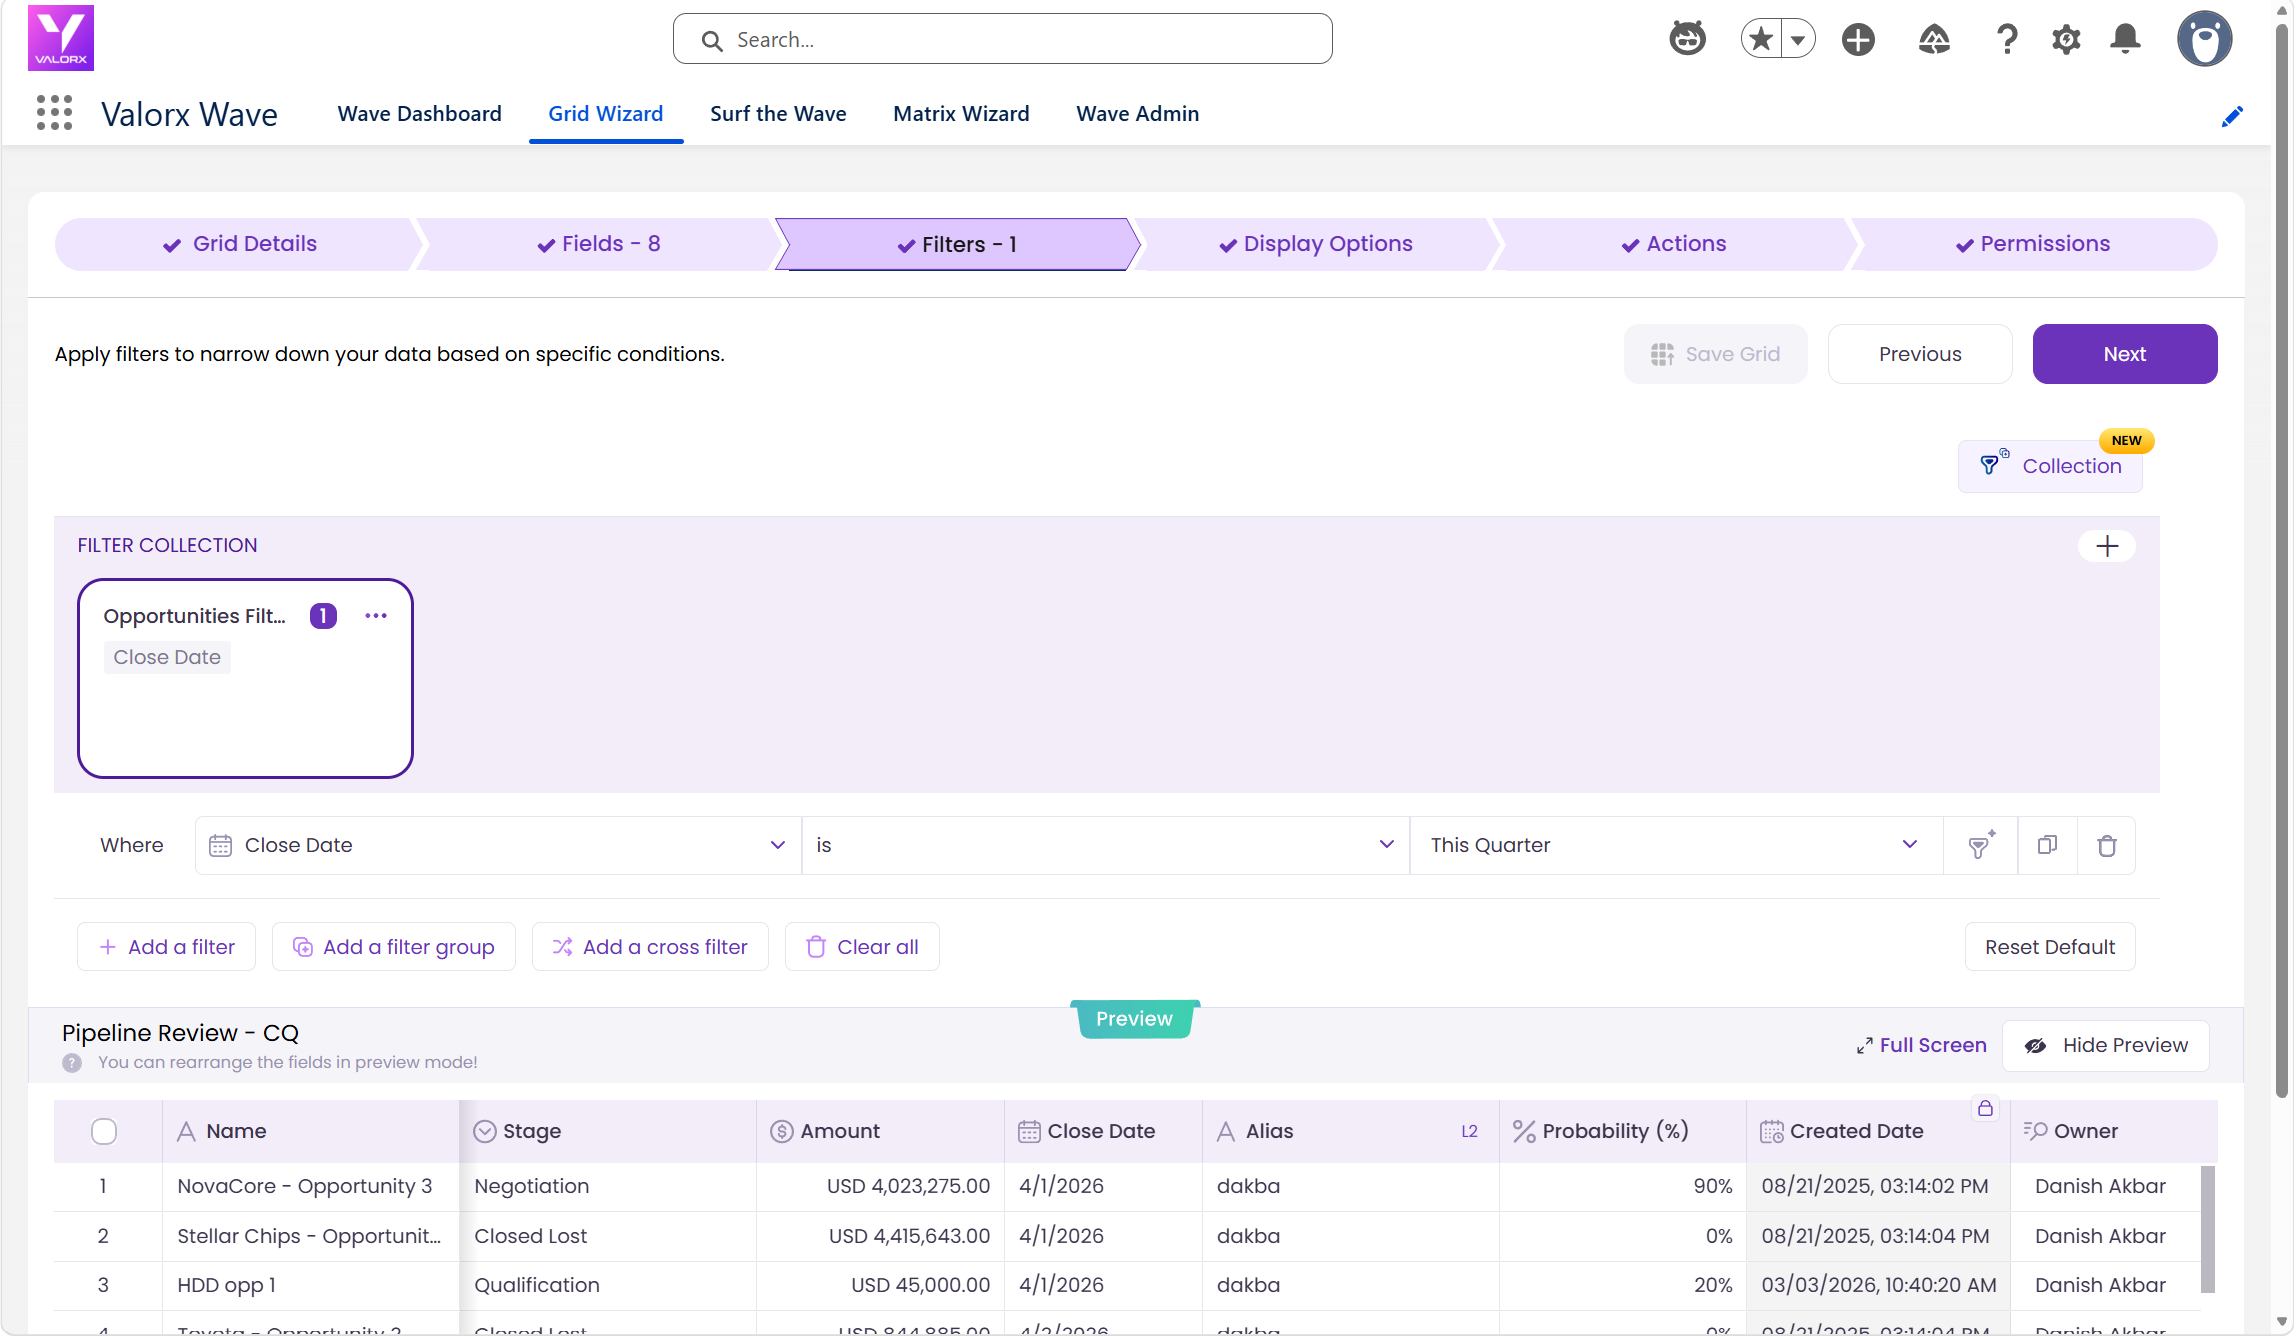
Filters narrow down which records appear in your grid. For a pipeline review, you might filter to:
Close Date = This Quarter and Stage ≠ Closed Won
Click Add a Filter for single conditions, or Add a Filter Group to combine multiple conditions with AND/OR logic. You can even use Cross Filters to filter parent records by related child data.
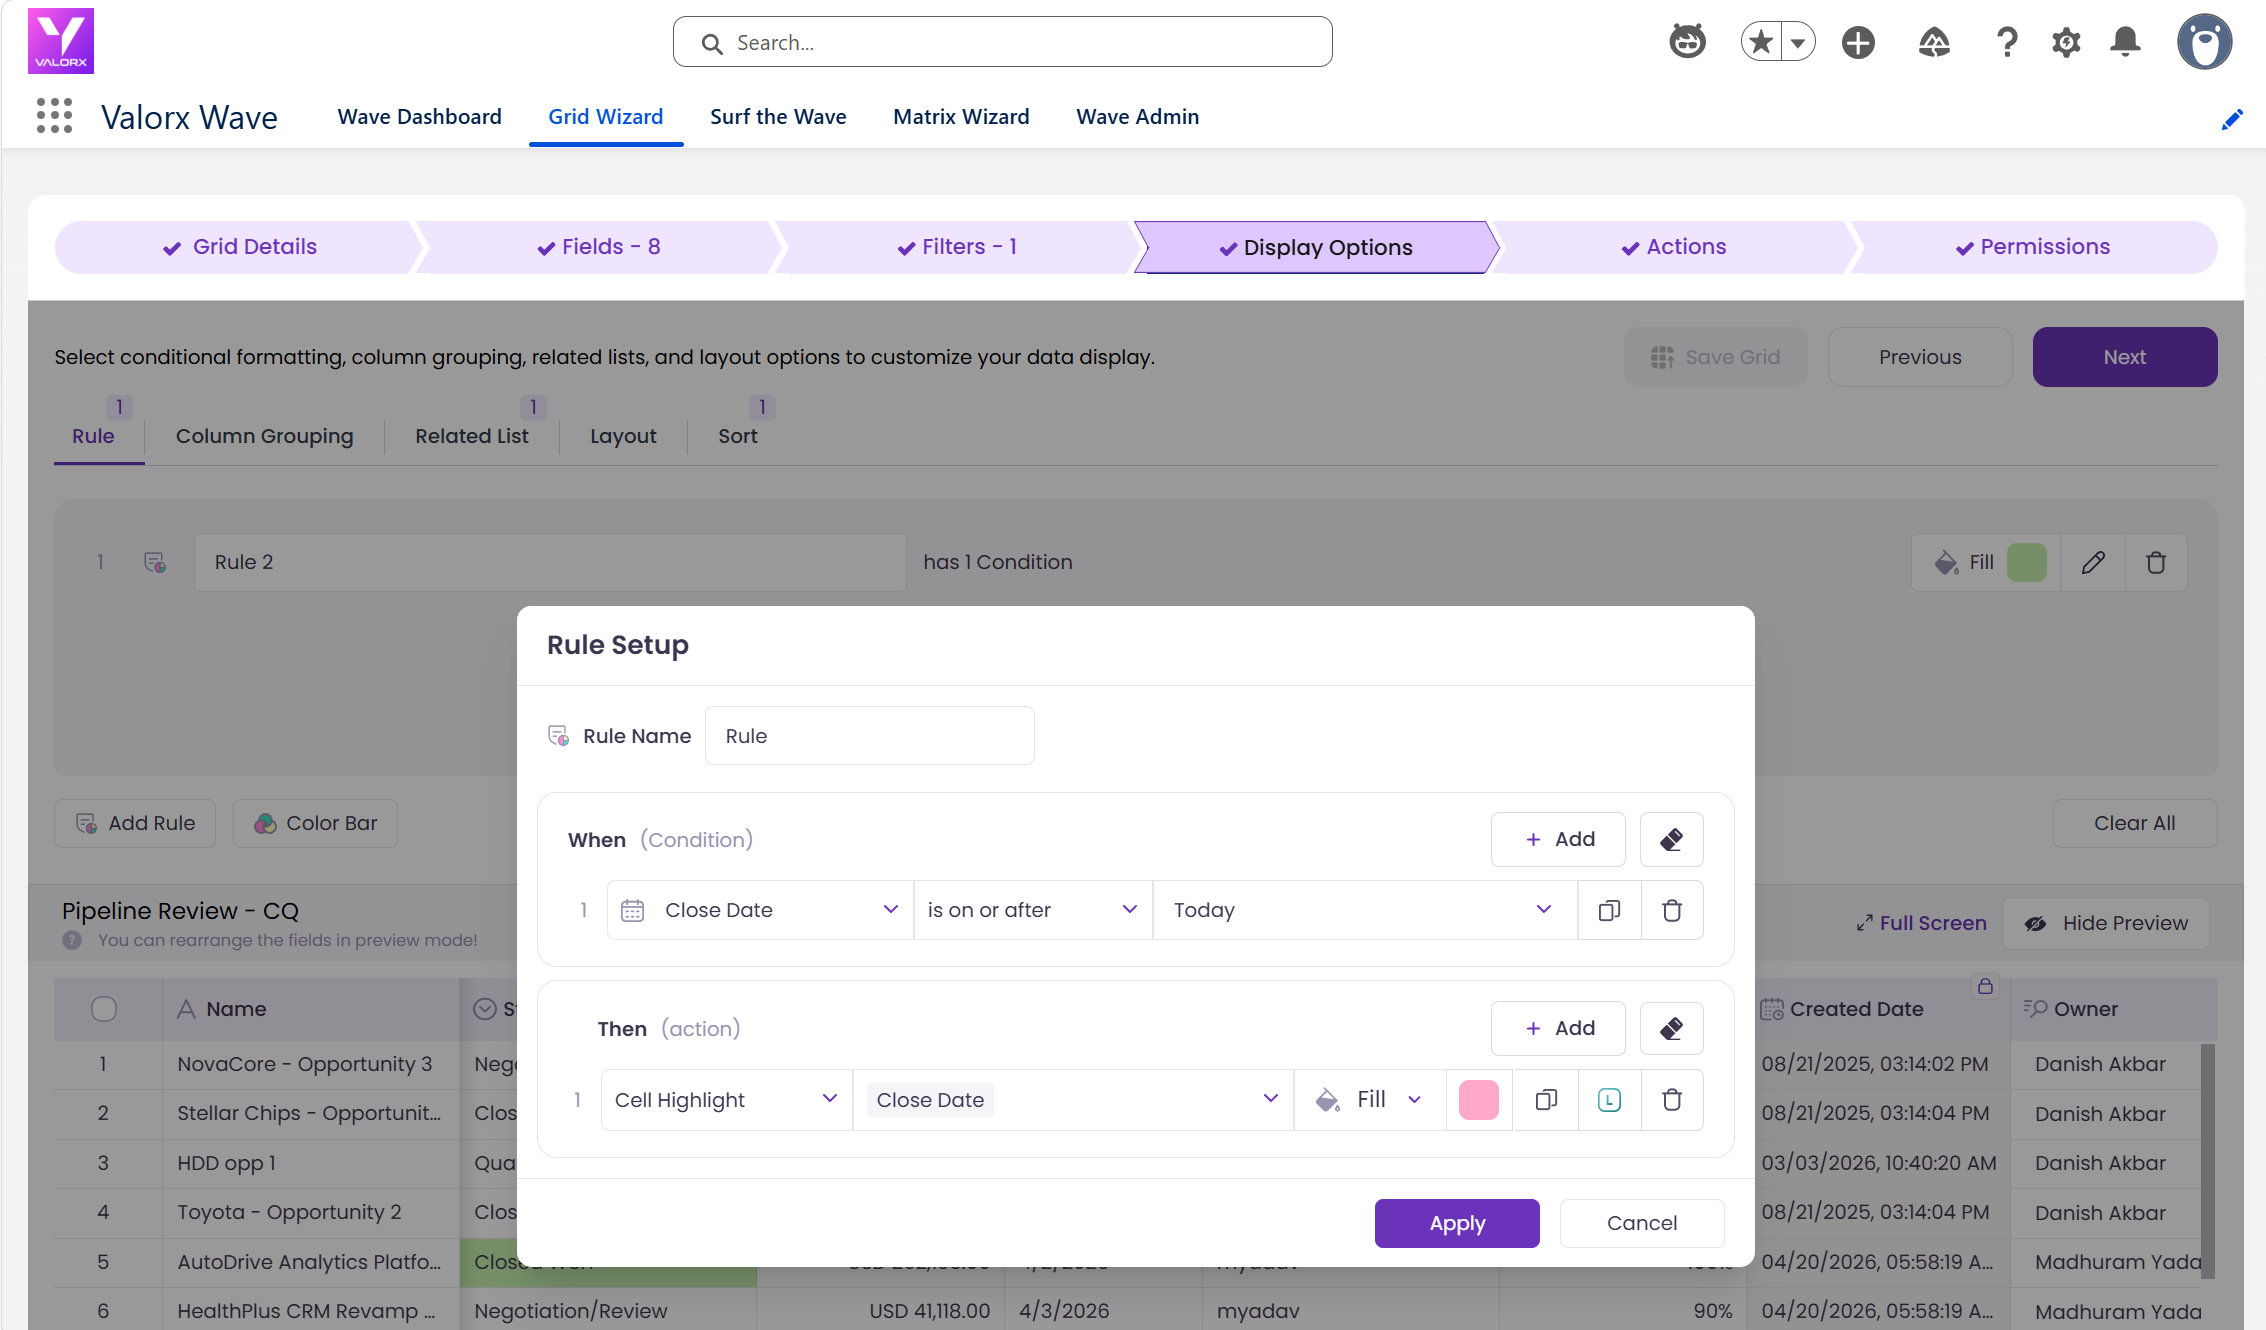
Customize how your grid looks and behaves:
- Rules (Conditional Formatting): Highlight records based on field values — e.g. red when Close Date is past due, green when Stage is “Closed Won.”
- Sort: Set a default sort order (e.g. Close Date ascending) so records always appear in a useful order.
- Layout: Freeze key columns (like Opportunity Name) so they stay visible when scrolling.
- Related Lists: Add related records (like Contacts or Activities) as a panel alongside each row for full context.
- Click Next when done.
This is where you can enable all the different grid controls for your team. You can allow them to edit filters, add or remove fields, or changing display options.
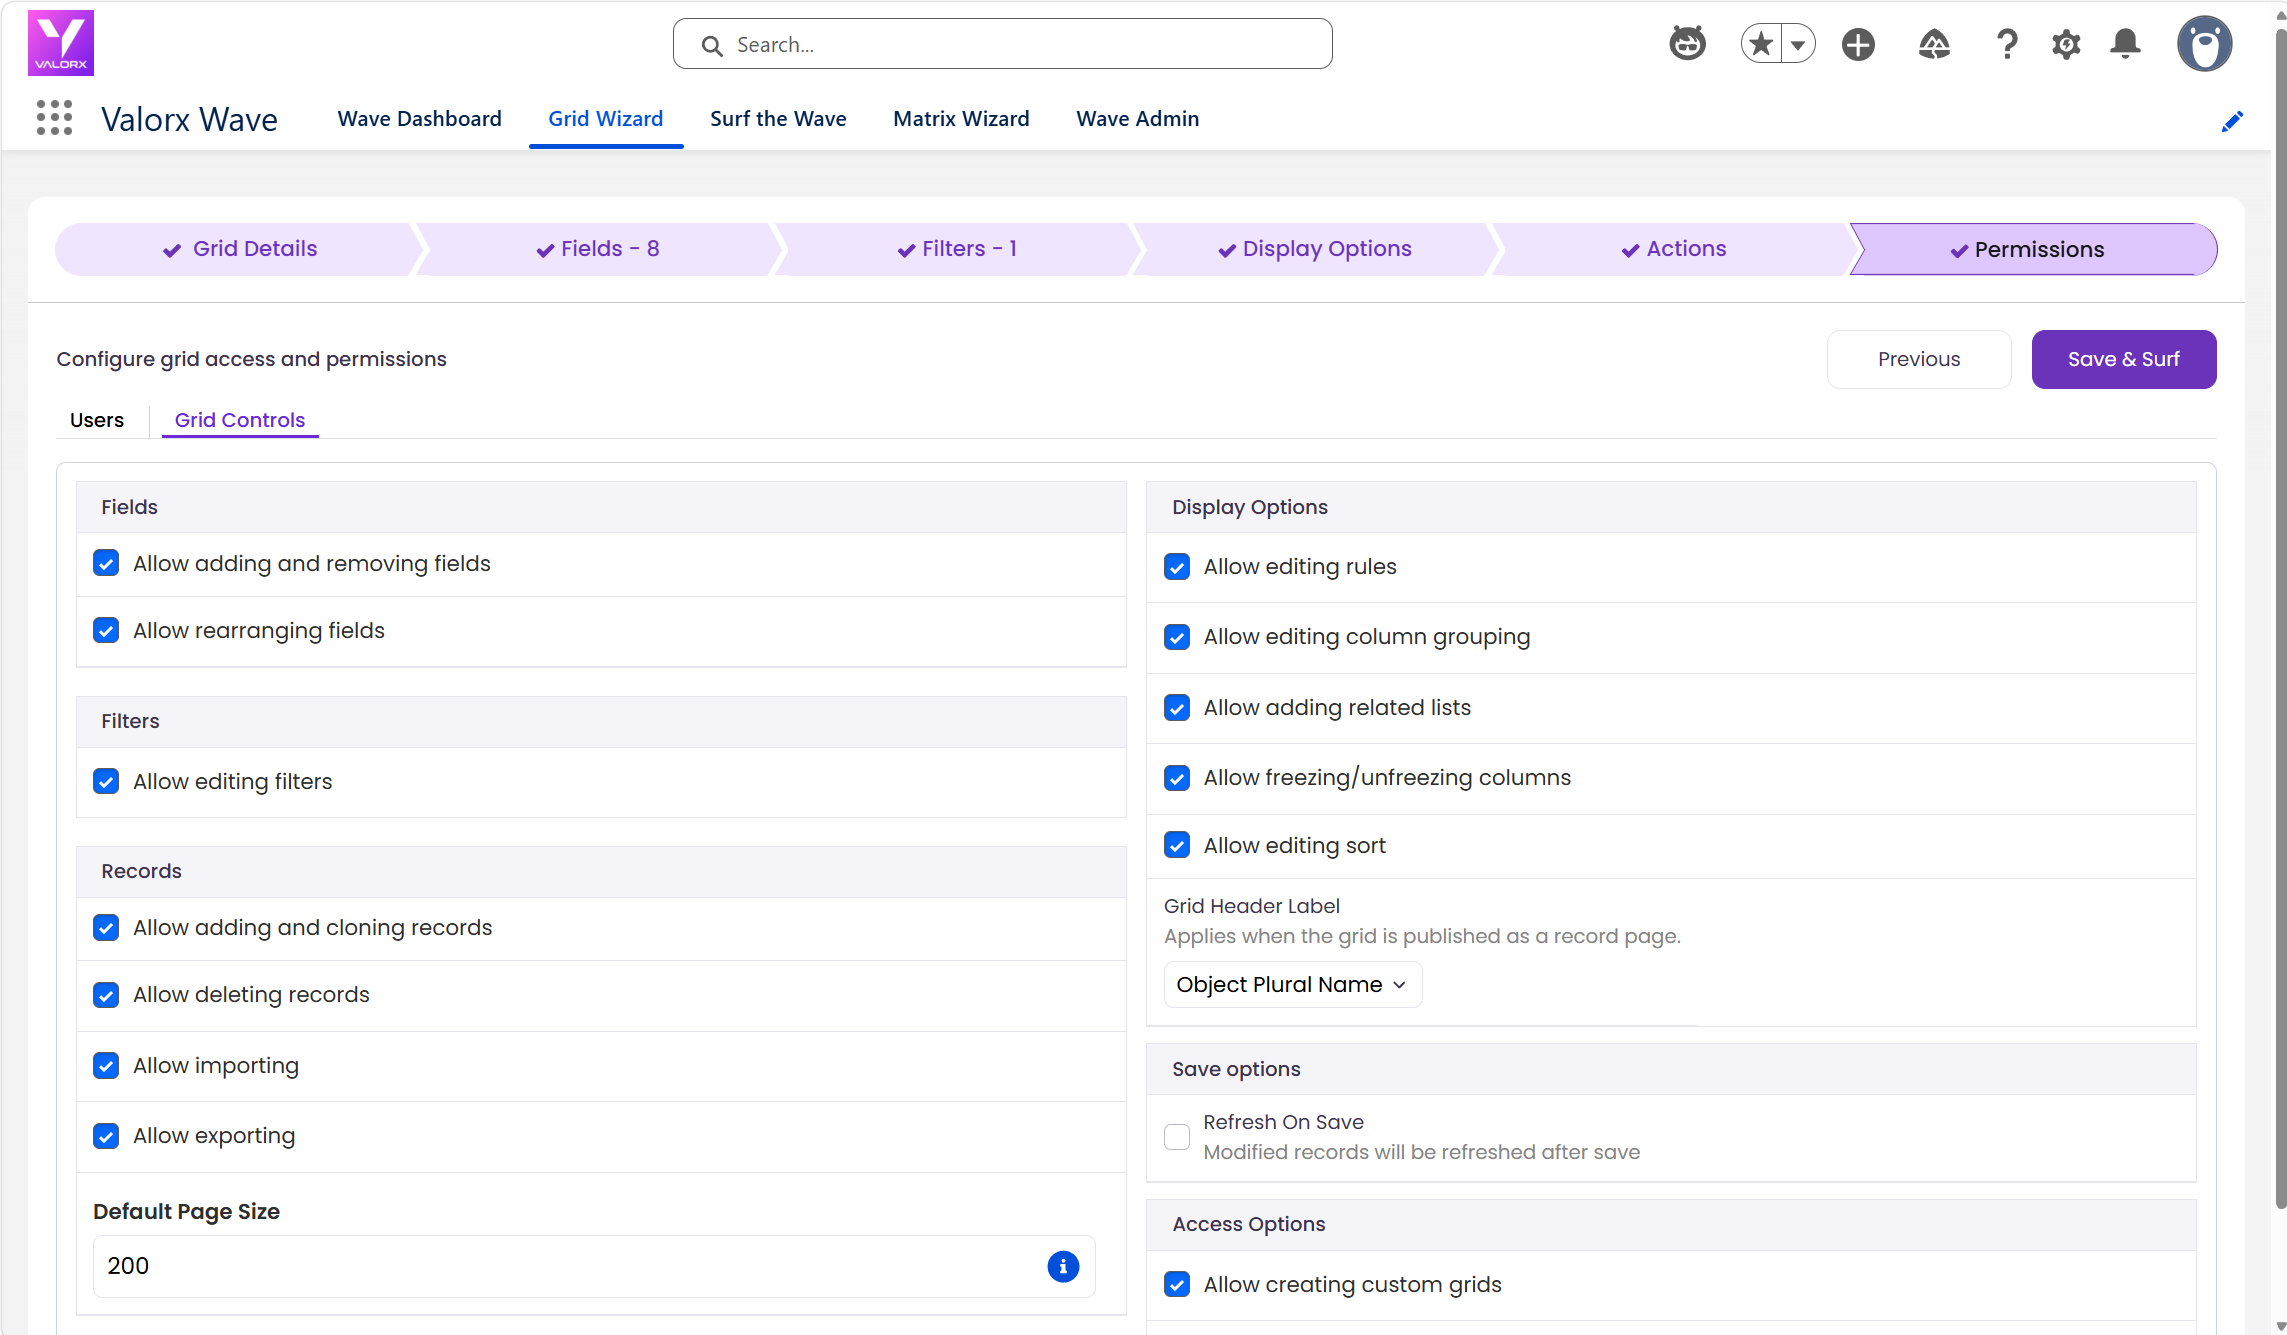
Click Save & Surf to save your grid configuration.
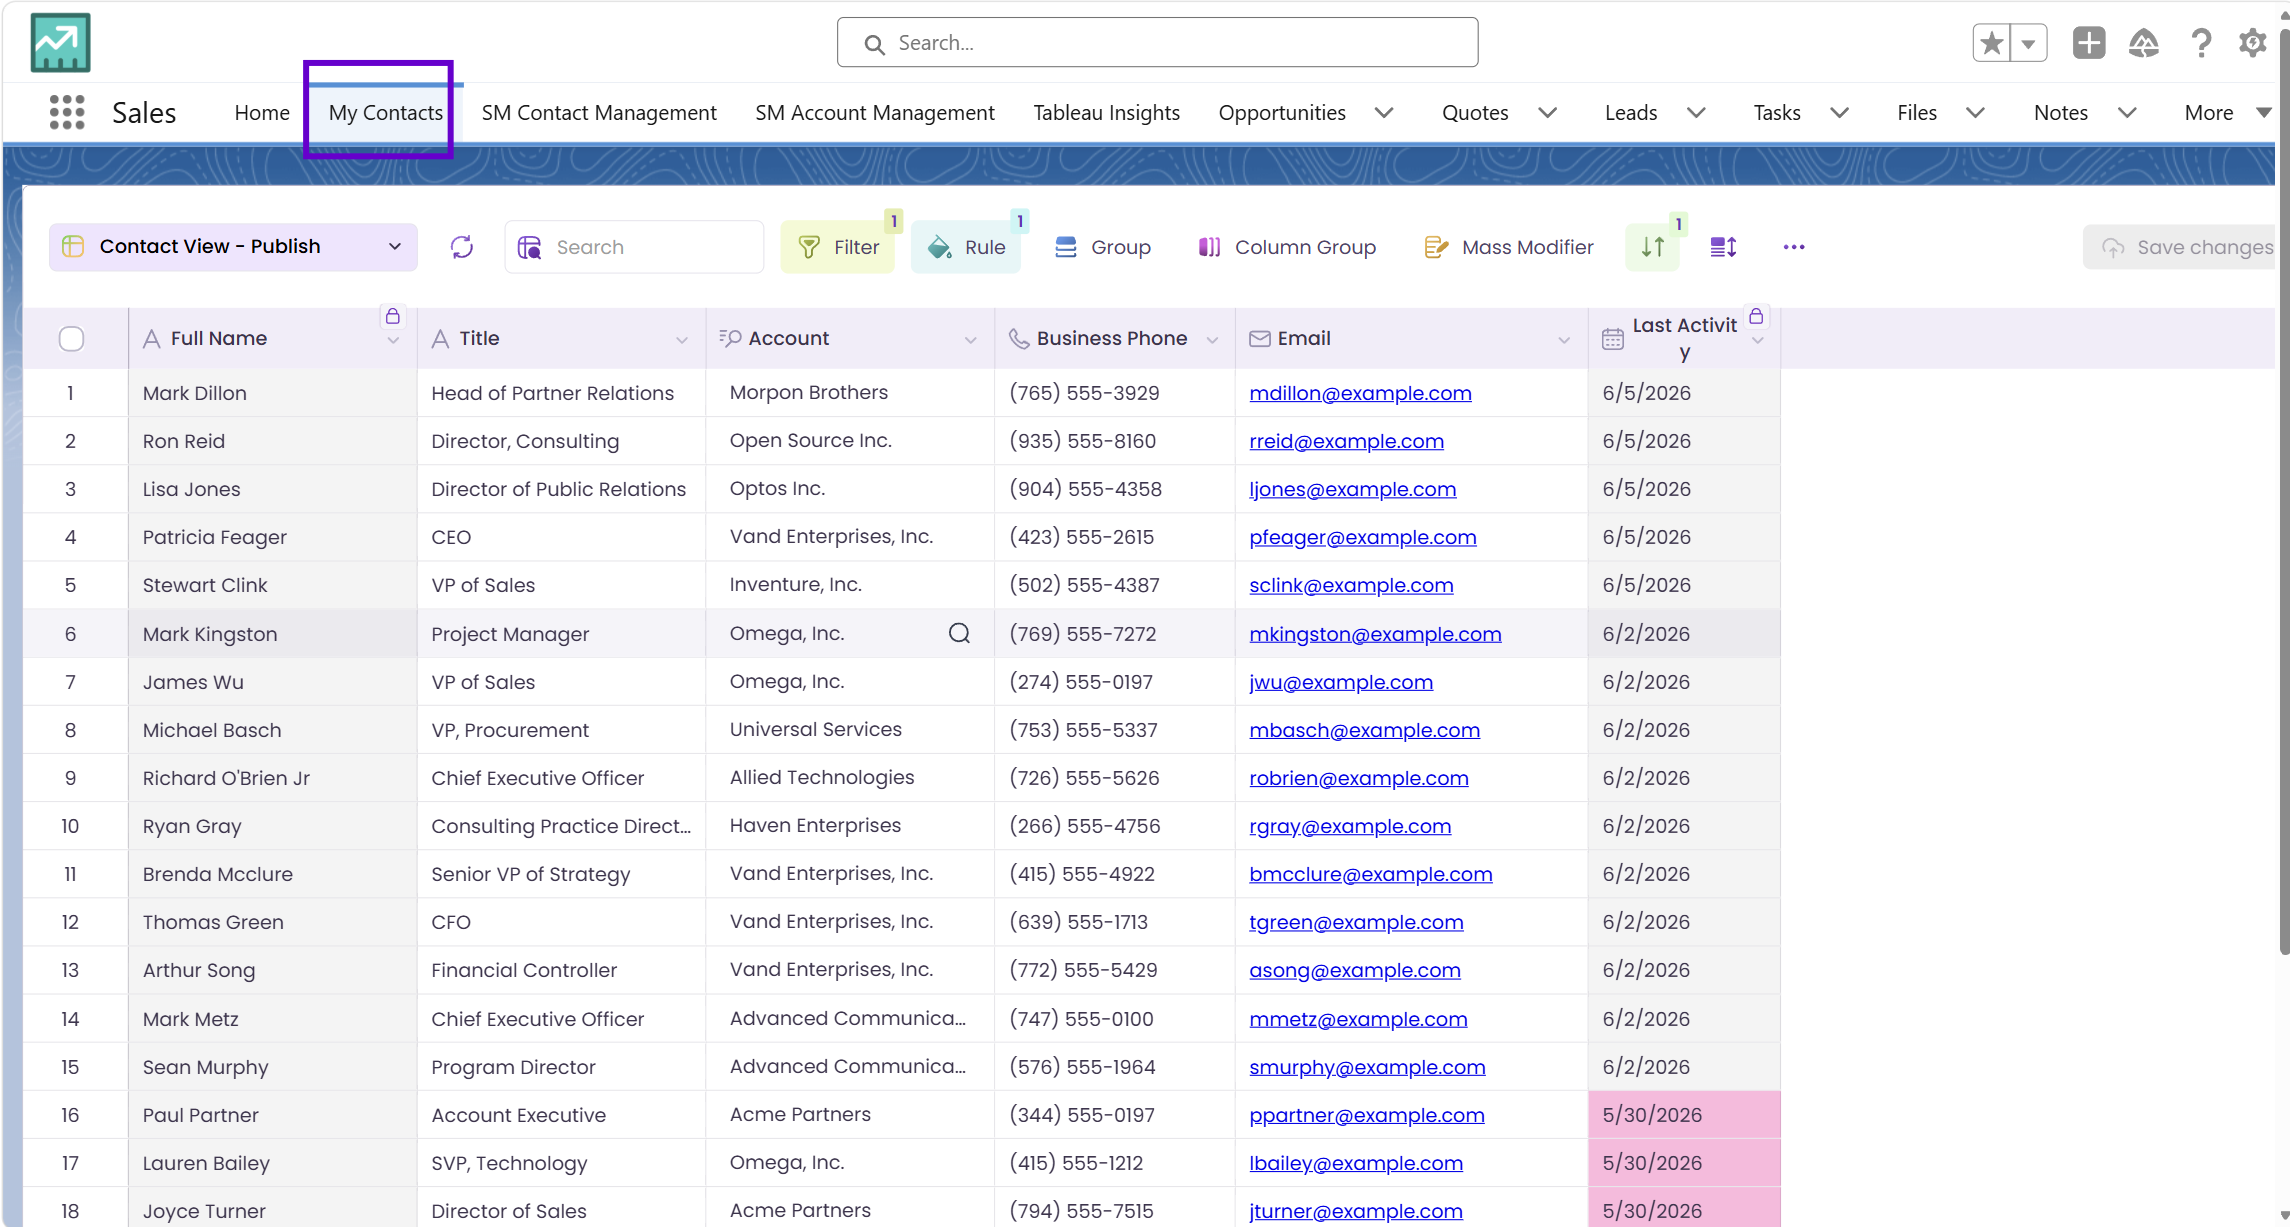
You’re now looking at the exact outcome from the top of this guide — a live spreadsheet of your Salesforce data, fully embedded in your Salesforce environment.
Grids your team can build today
The same 6 steps work for any Salesforce object. Here are four popular grids teams build first.
Updating 200 records, Two ways
The difference between native Salesforce editing and a Wave Grid.
Ready to build your first grid with Valorx Wave?
Install the Wave embedded package in your Salesforce org, pick any object, and have a working grid in under 5 minutes.

Choose the workflow you need:
Try Wave in browser Extension

Try Wave in Salesforce

Try Fusion In Excel

Enhancing Salesforce for industry leaders