Unlock Salesforce's full forecasting potential
Create more accurate, adaptive forecasts with an interface as familiar as Excel.
Trusted by leading Salesforce partners
Implementation and consulting partners choose Valorx to deliver spreadsheet experiences on top of Salesforce.


USE CASES
What your manufacturing forecasting has been missing
Turn Salesforce data into actionable forecasts.
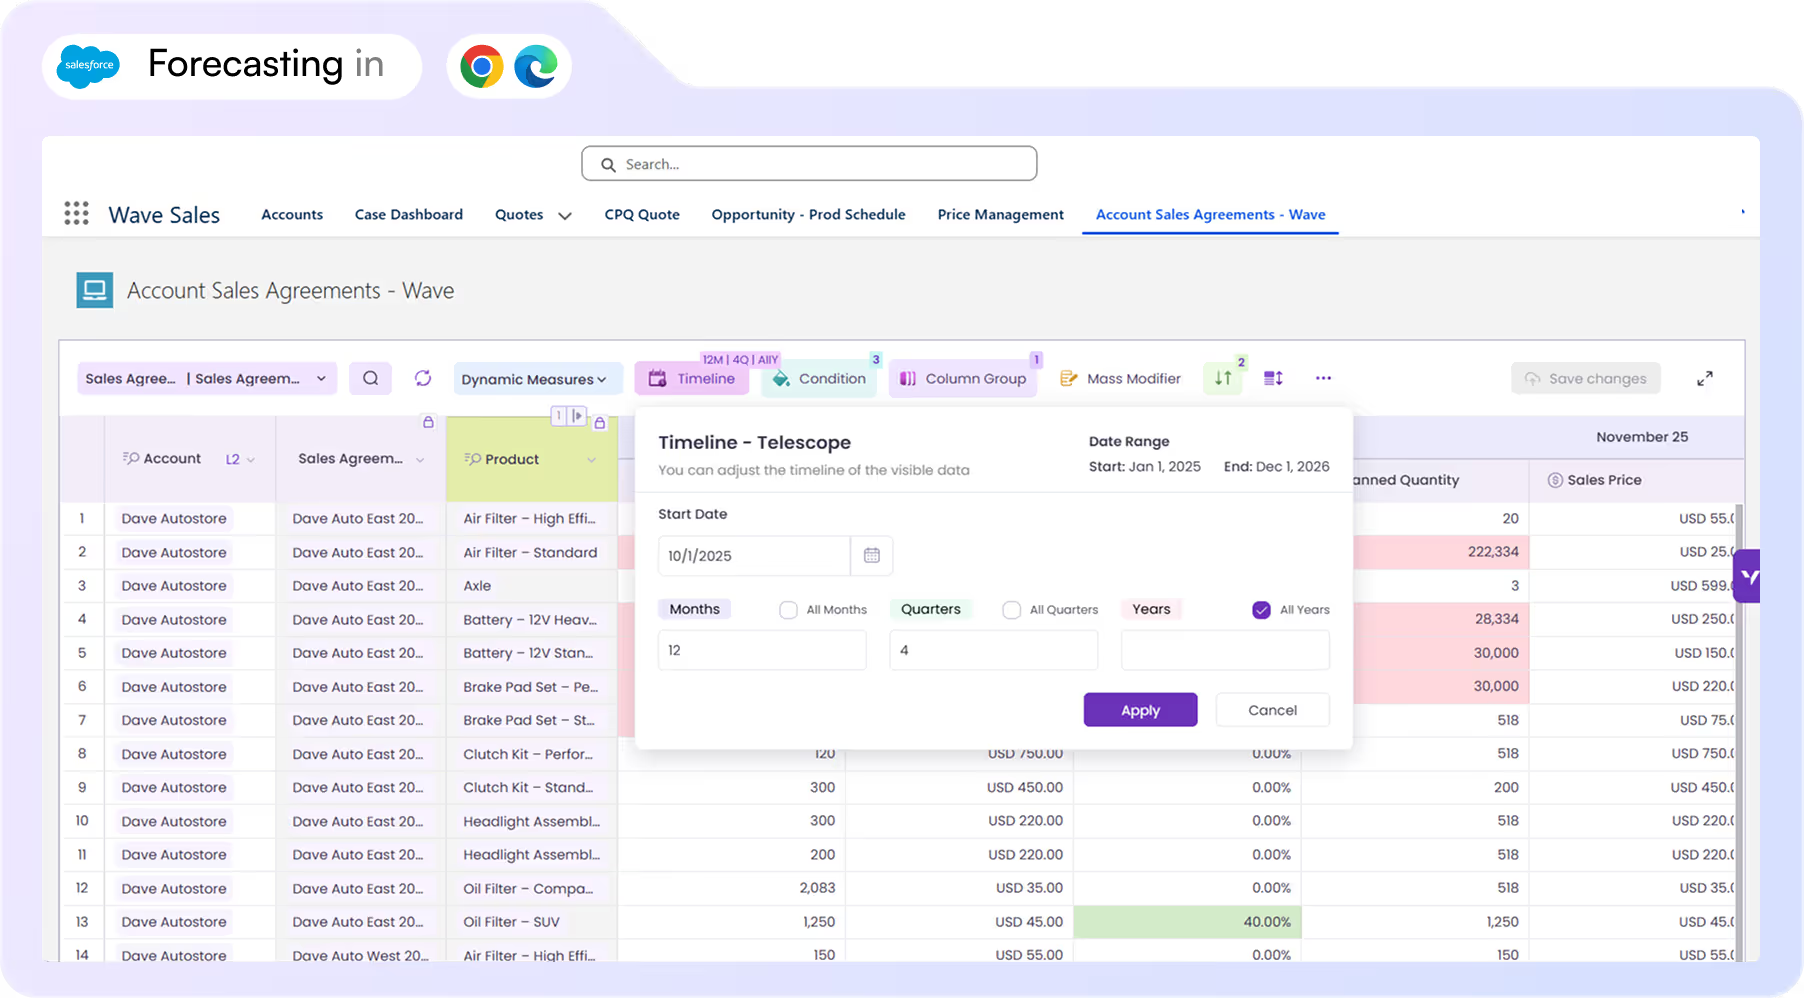
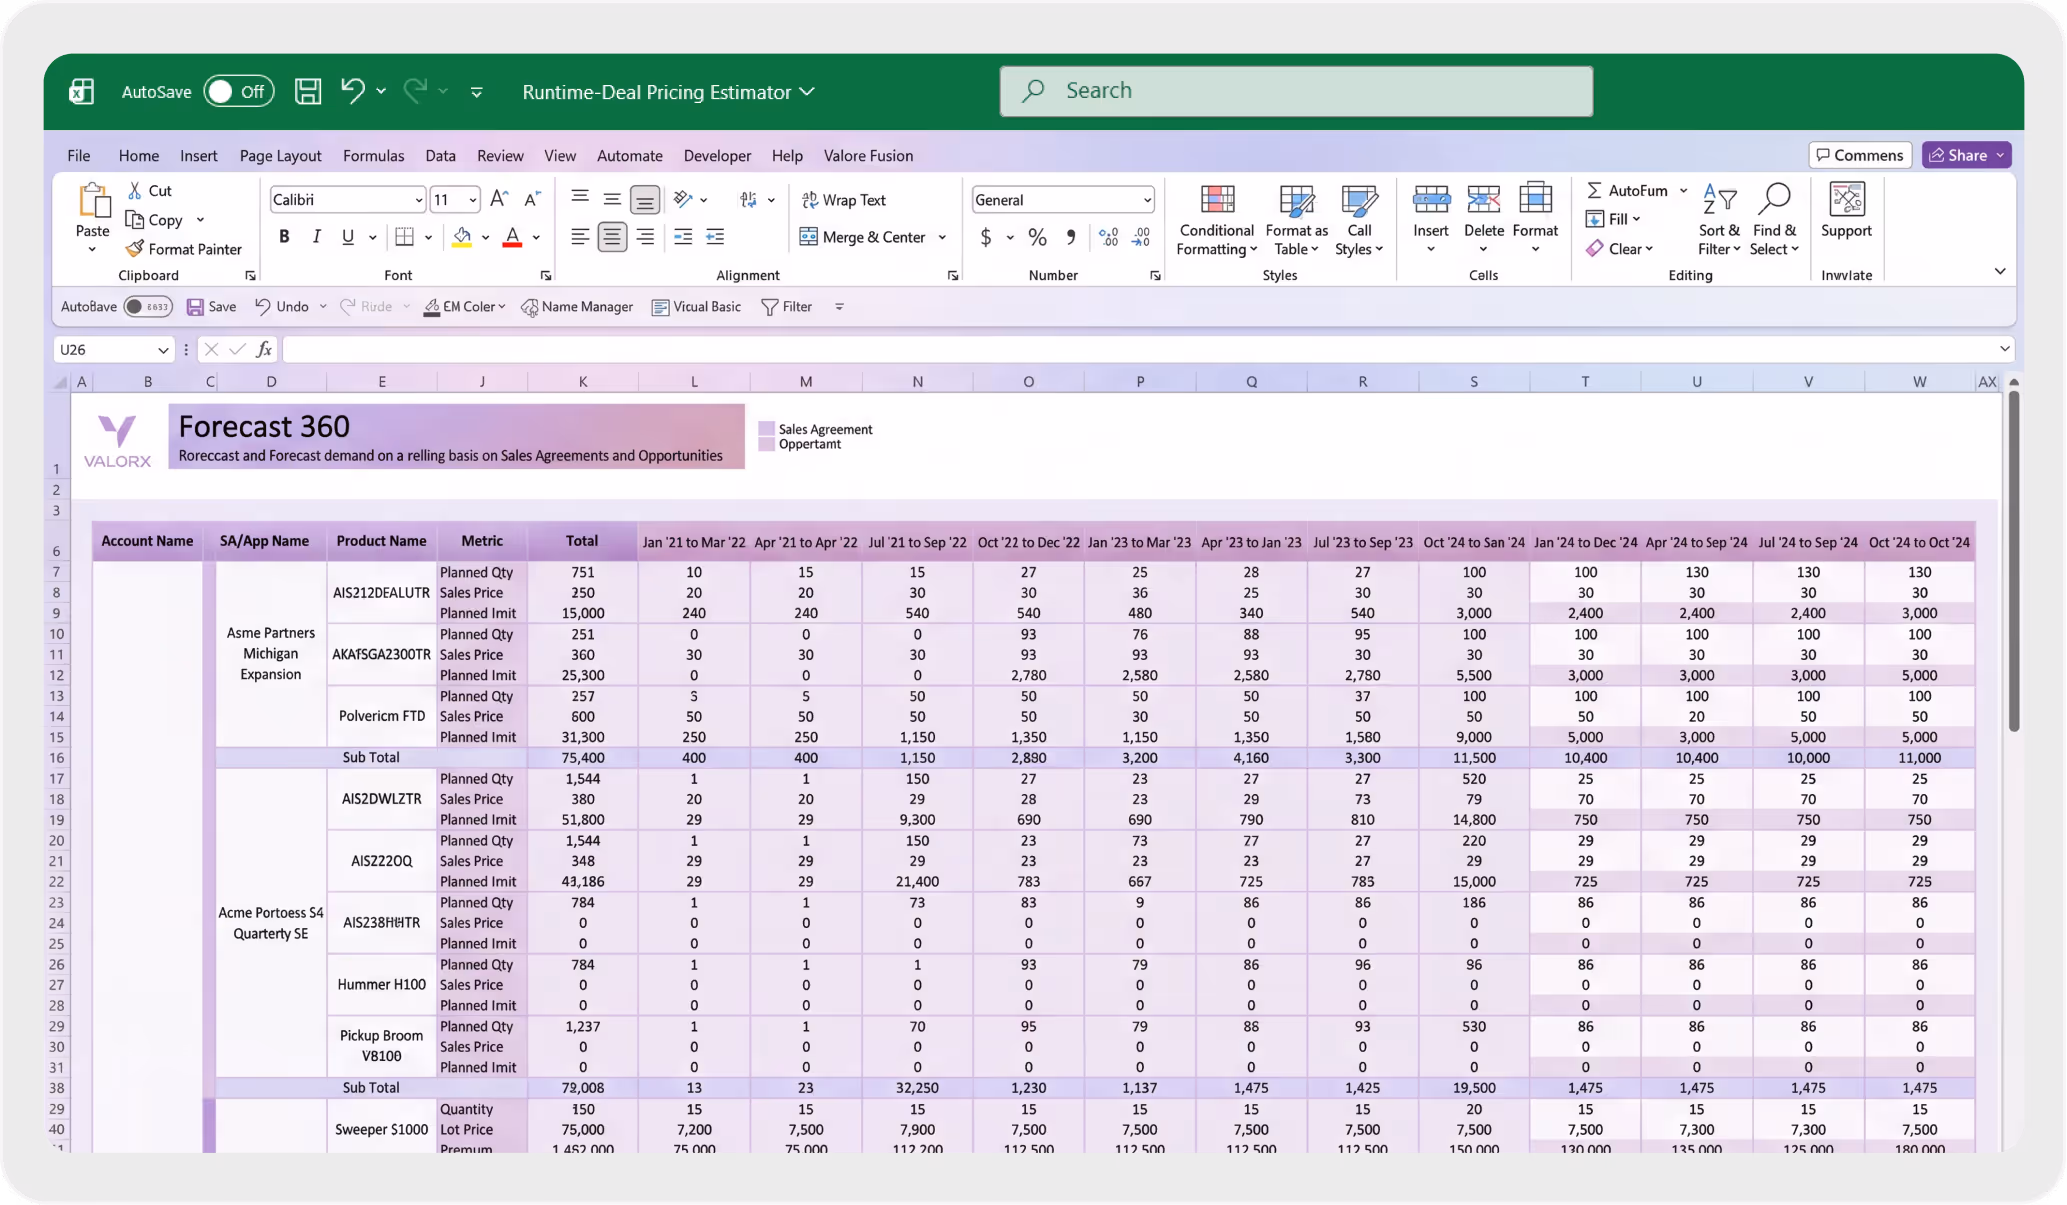
Account-based sales forecasting
Combine long-term agreements and new opportunities into unified account forecasts.
Learn more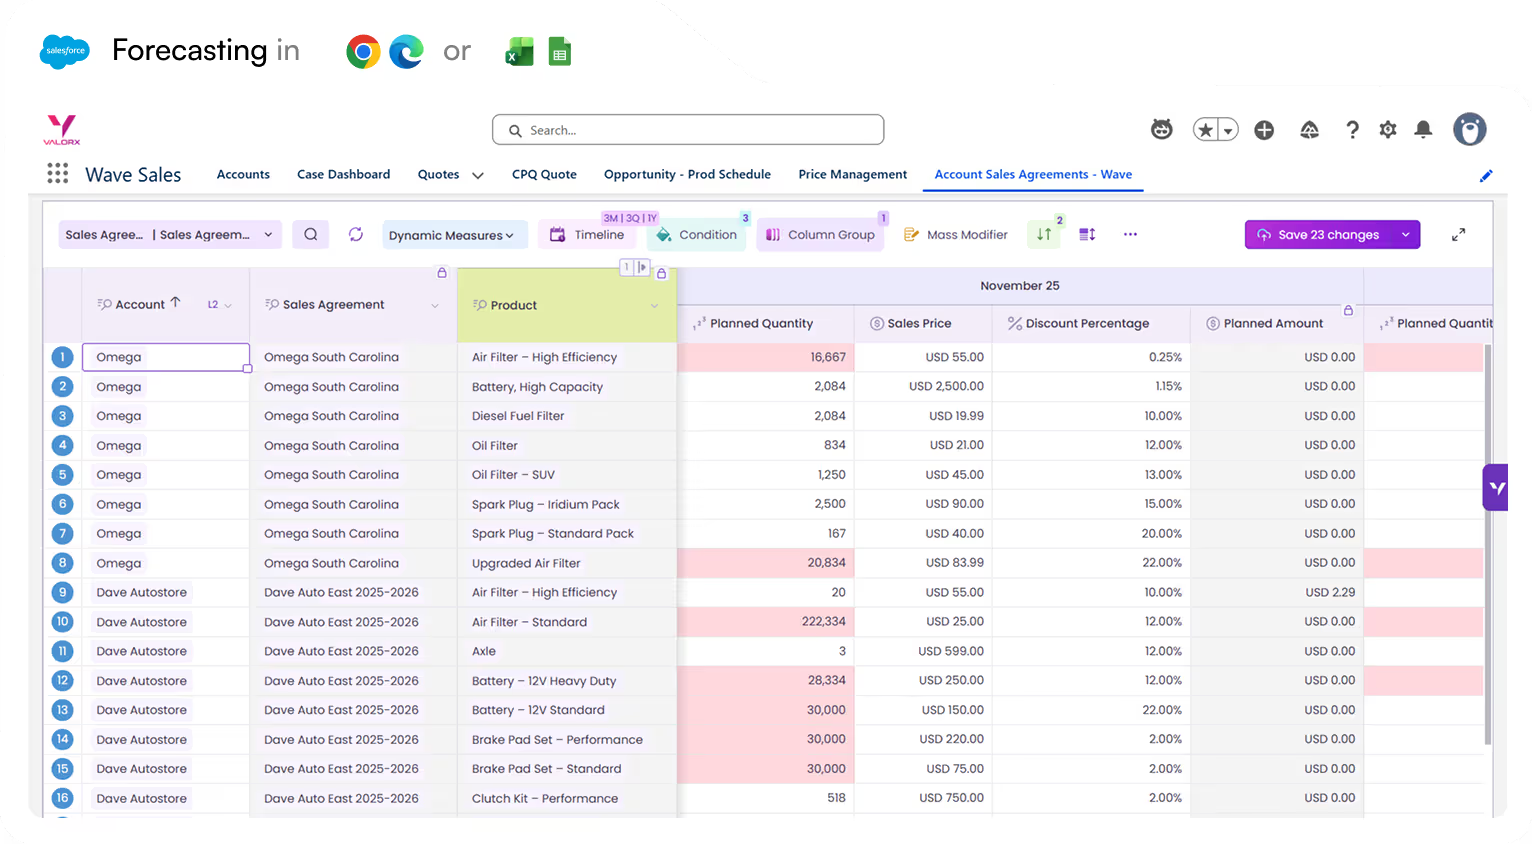
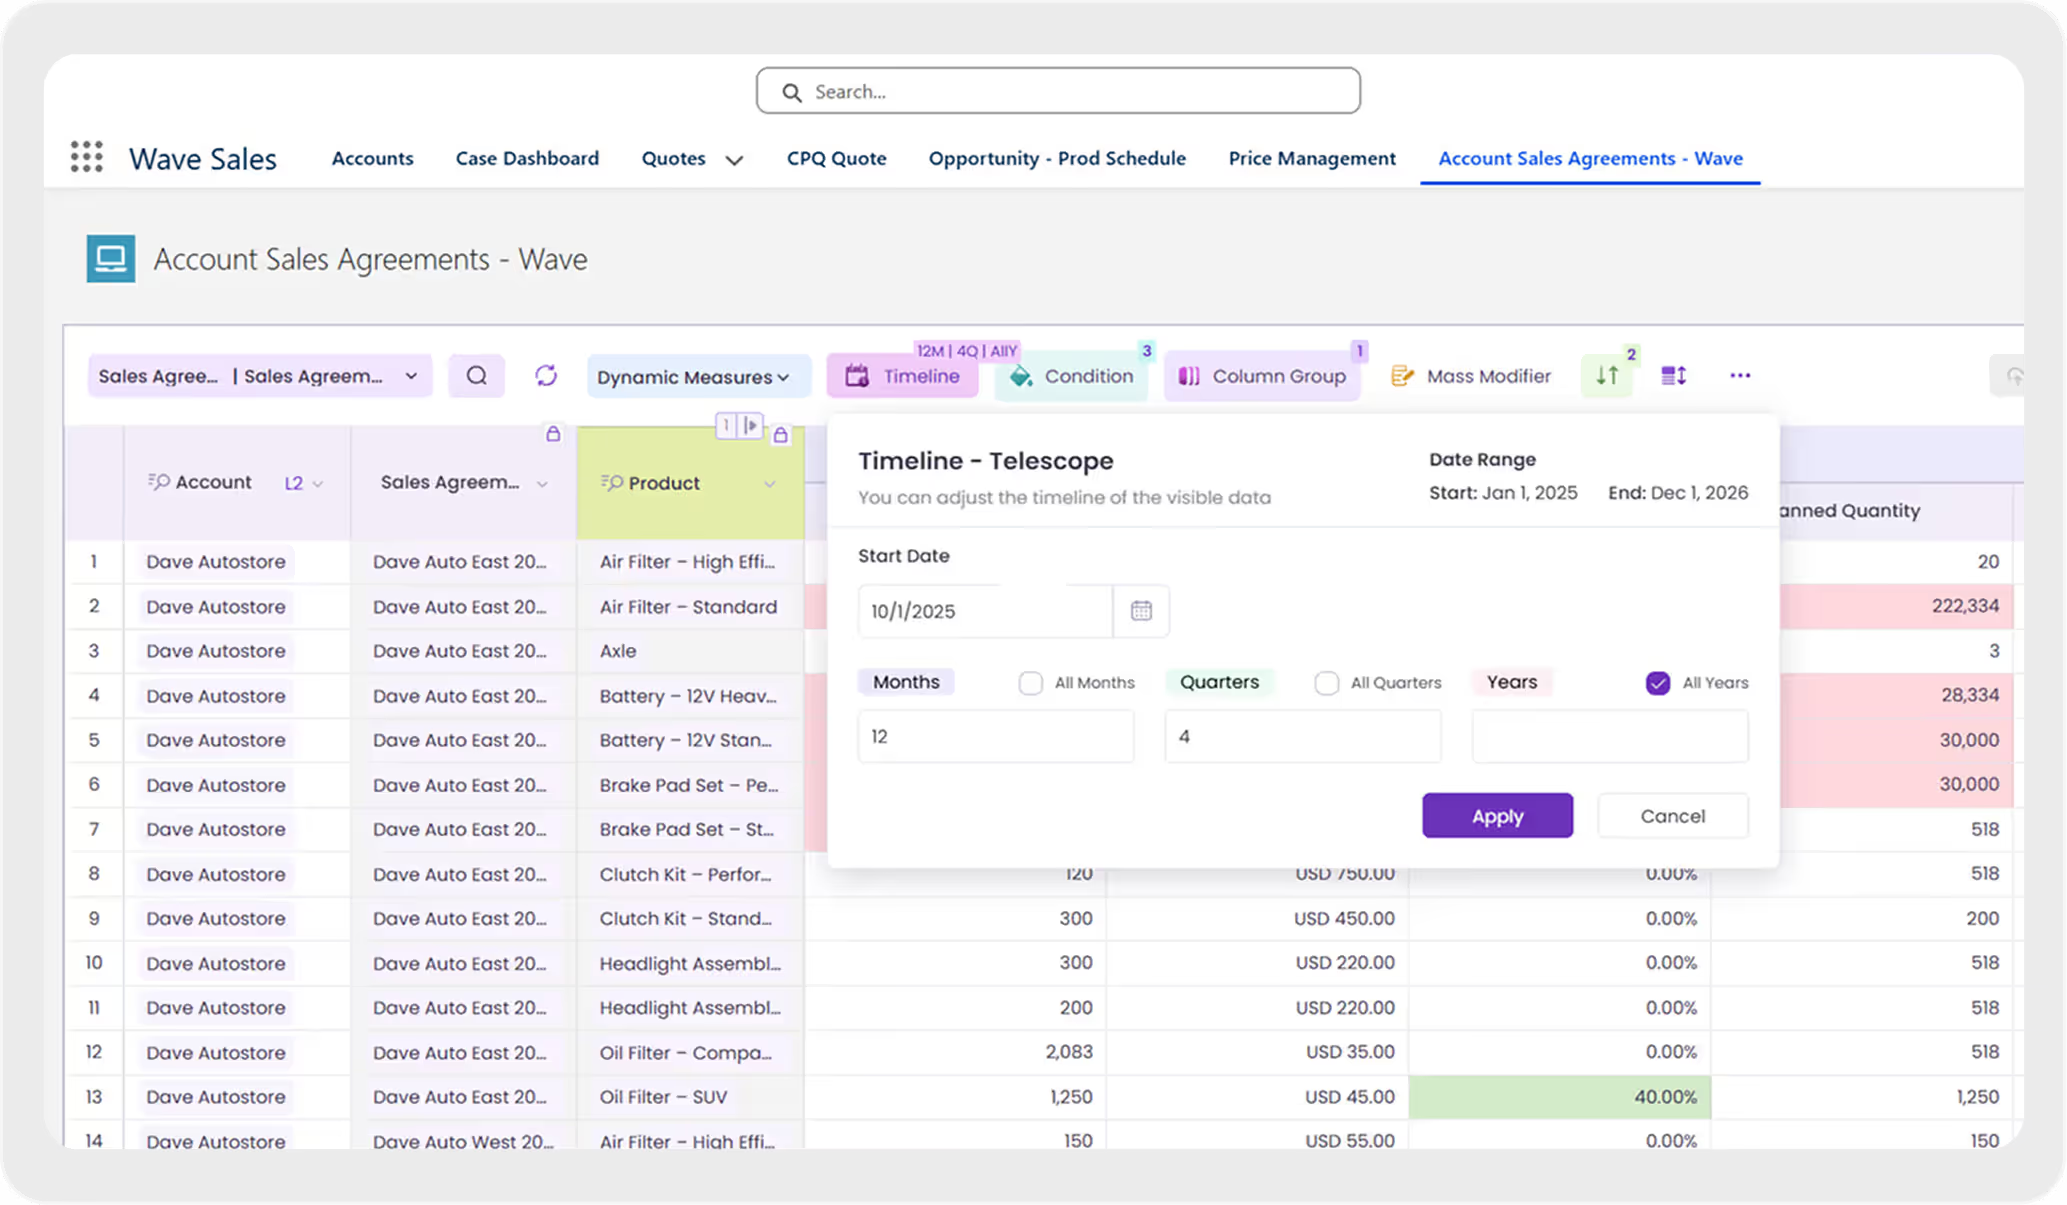
Demand planning and production alignment
Connect sales forecasts directly to production planning with flexible time views.
Learn more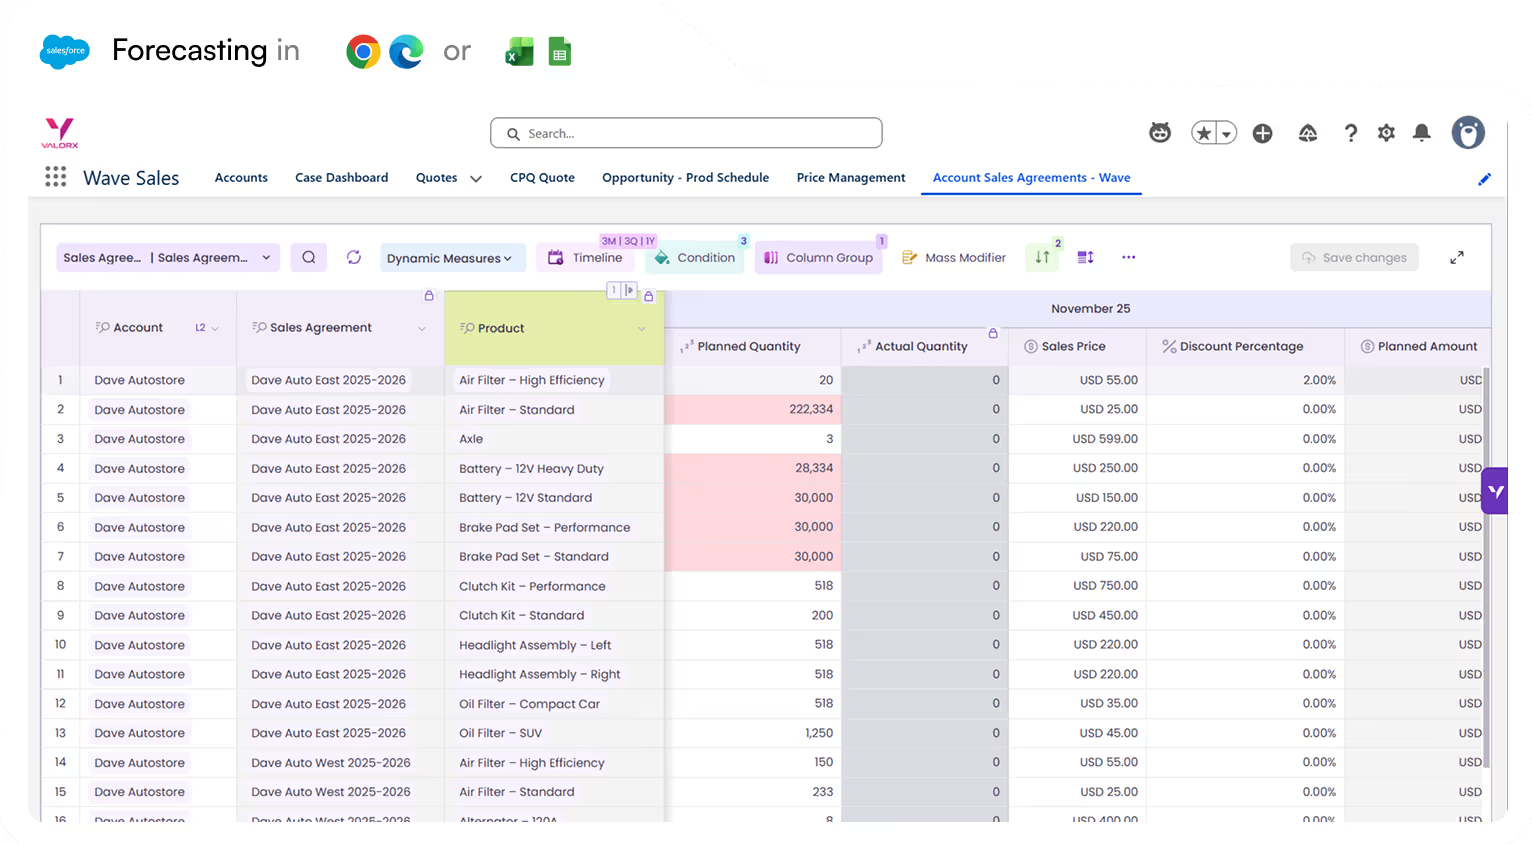
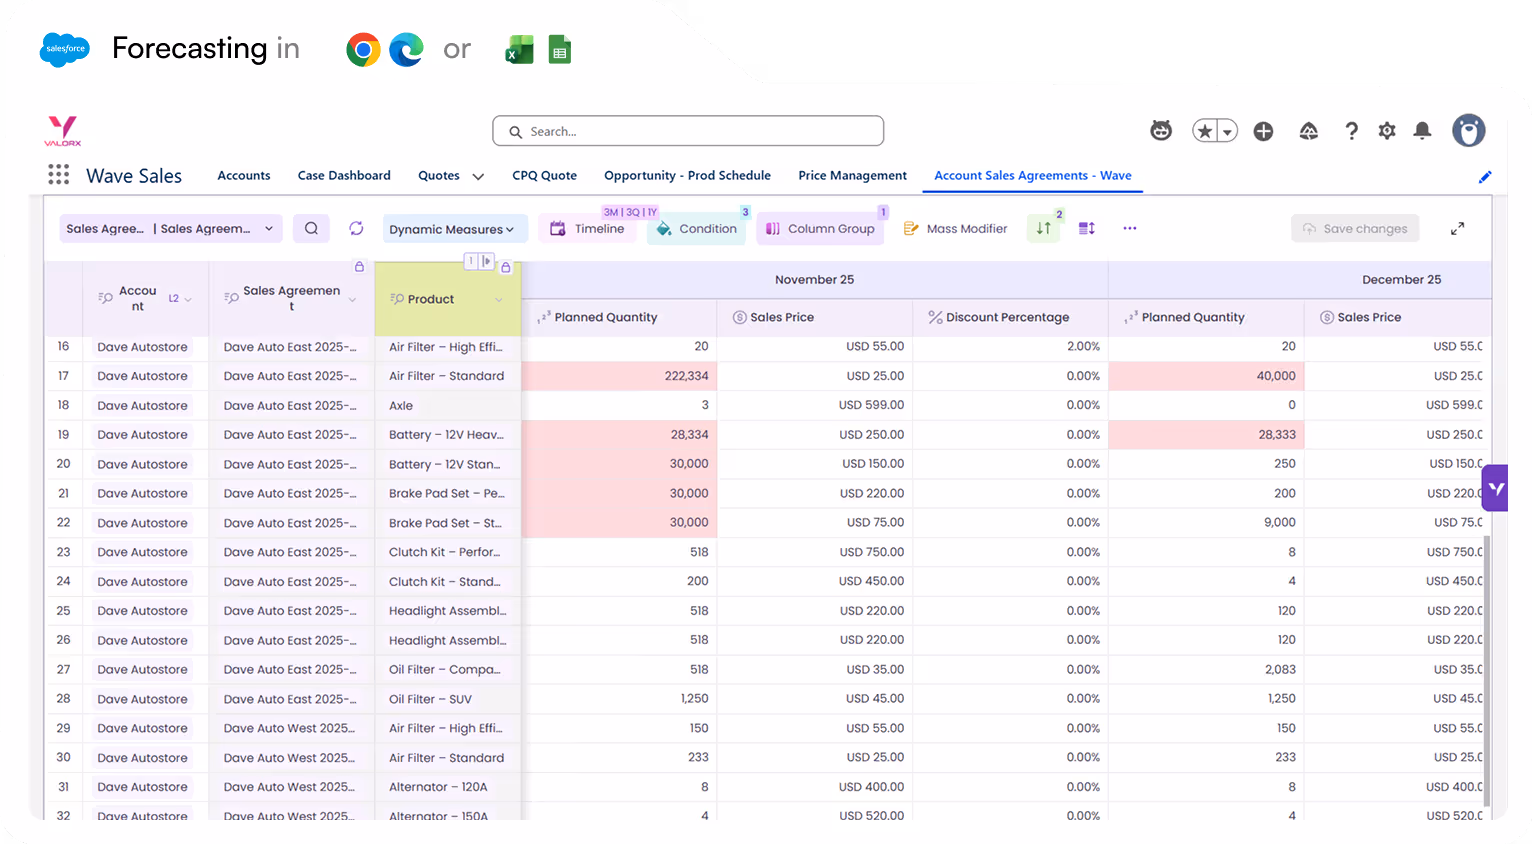
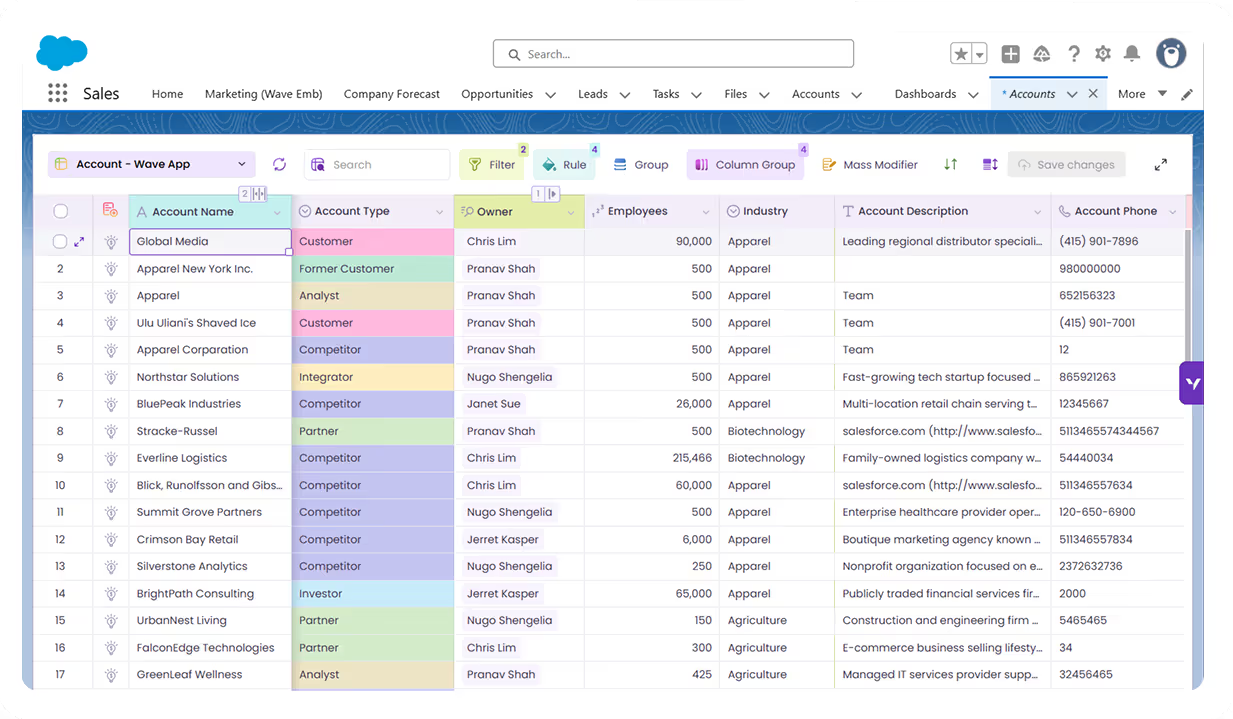
Unified performance tracking
Track forecast performance against actuals inreal time with spreadsheet-like simplicity.
Learn more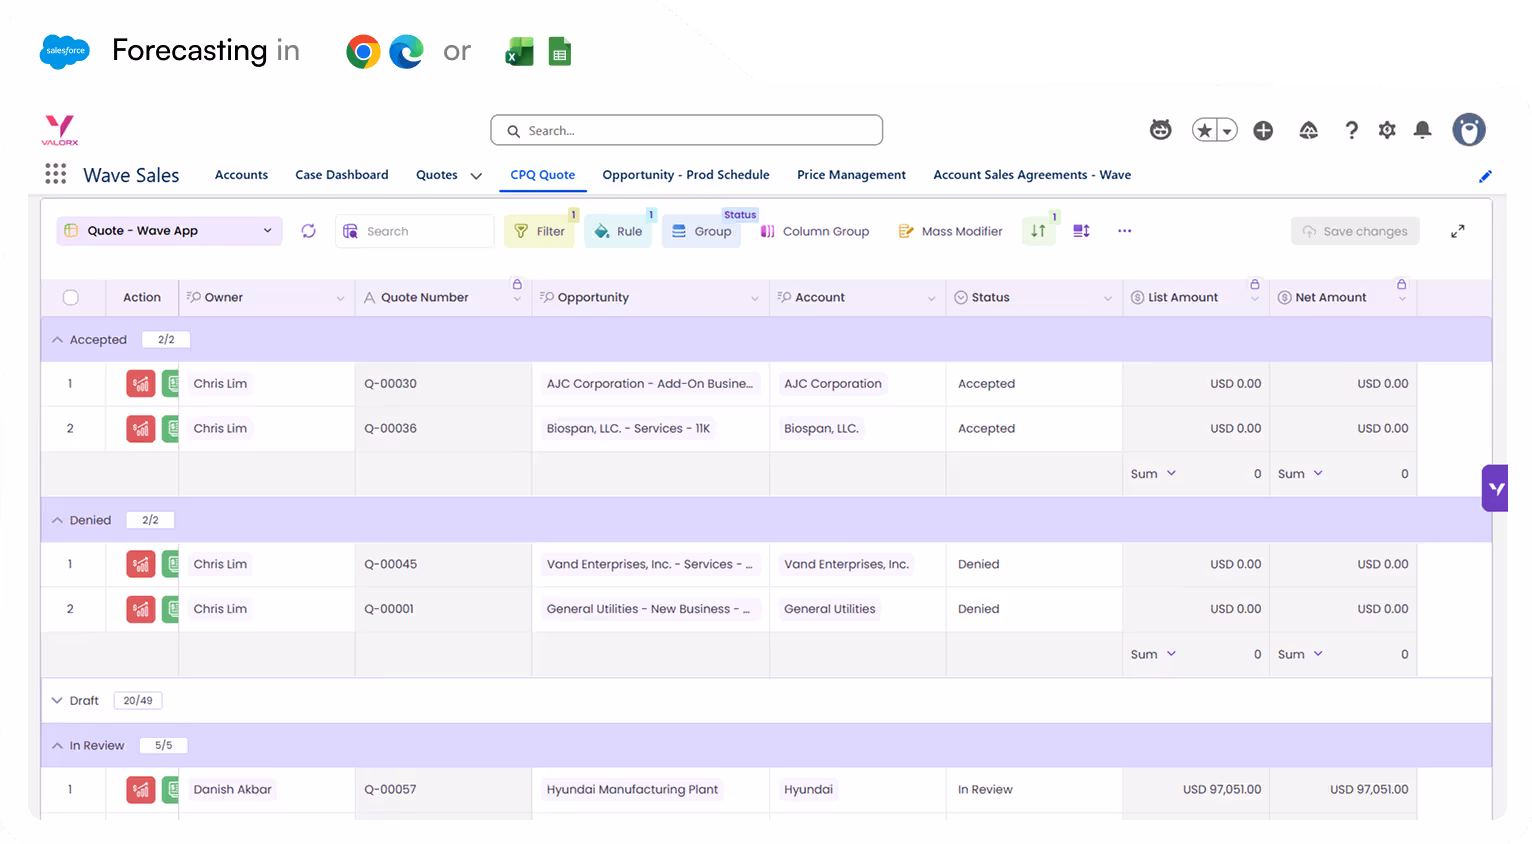
Cross-functional collaboration
Enable all teams to work from the same datawith custom views tailored to their needs.
Learn more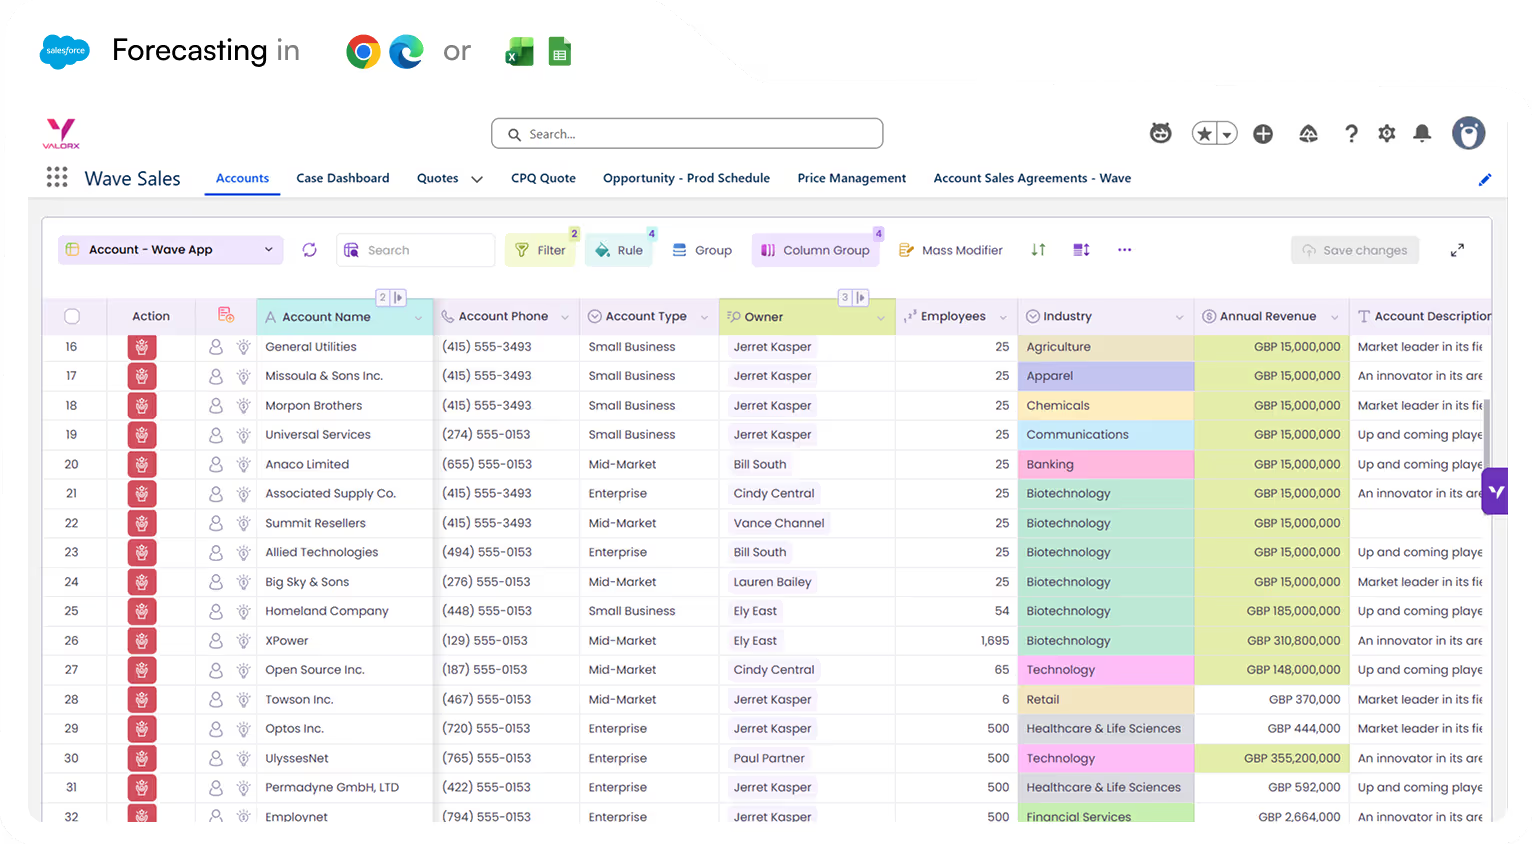
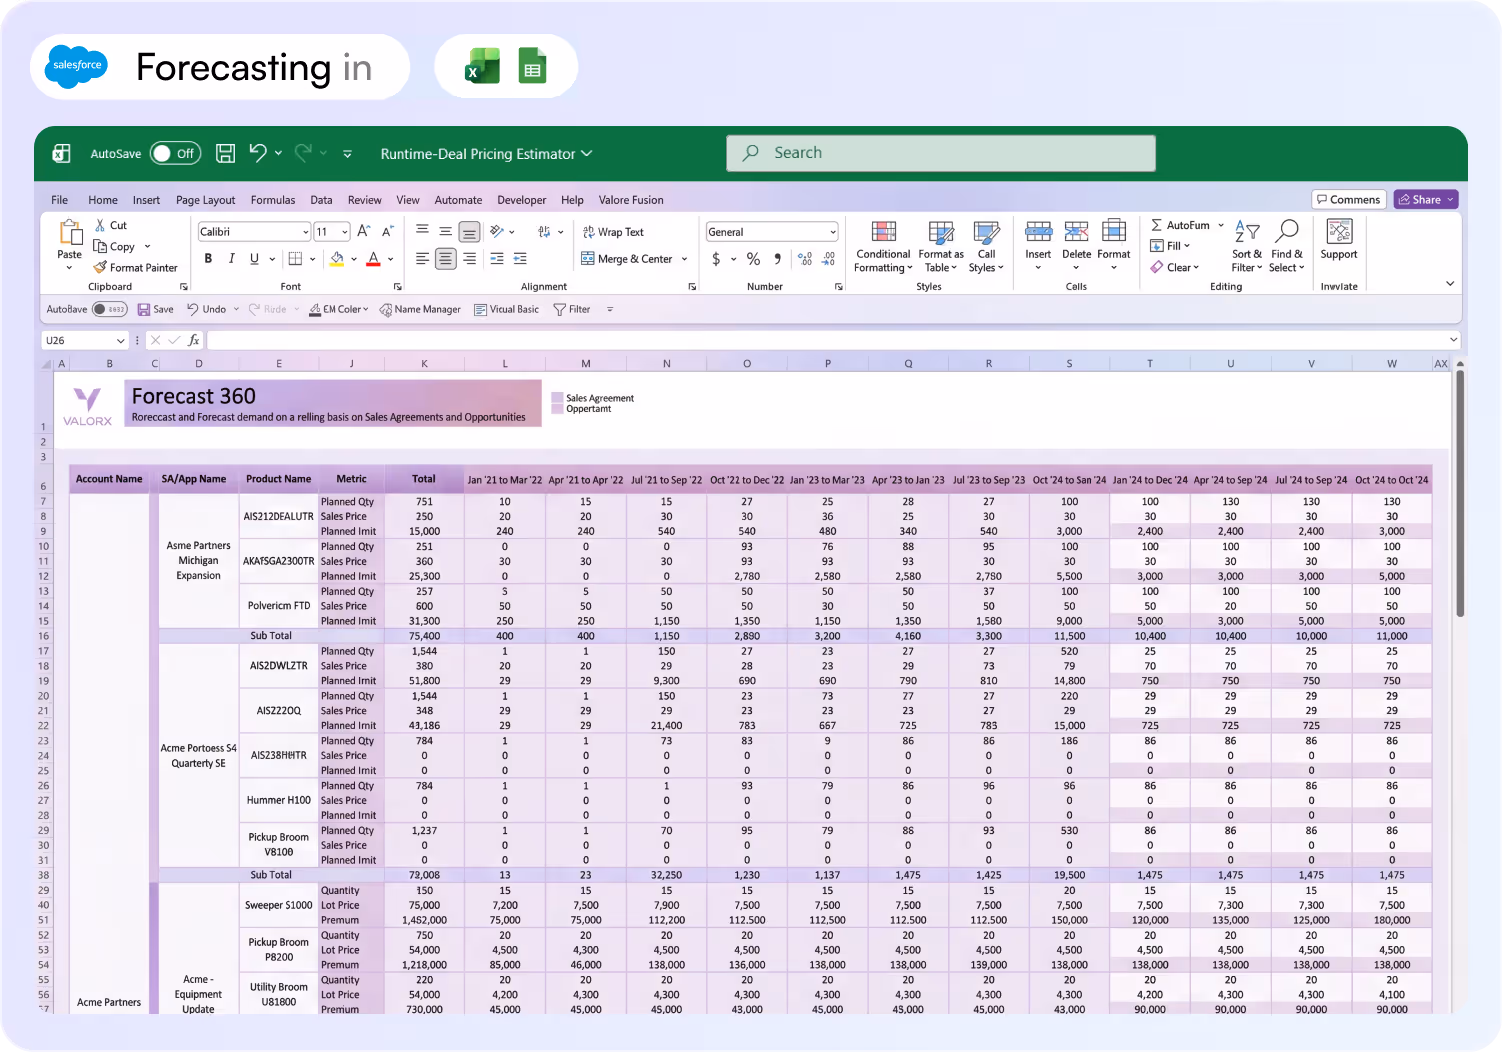
Easy adoption
Use familiar Excel tools while keeping datasecure in Salesforce — without complextraining.
Learn moreSee how fast Salesforce
can actually feel.
If you can do it in spreadhseet,
you can do it in Valorx.
you can do it in Valorx.
Start for free
1.3 Billion
Records updated by Valorx customers
0.51 Seconds
To update 1000 records in Salesforce
99.99%
Data accuracy with better interface for Salesforce

Choose your interface for forecasting
Built for needs with CP needs

Copy and paste
Quickly copy and paste data between Wave, Excel, and other sources using familiar shortcuts, while staying fully synced with Salesforce.

Filter columns
Apply fast, column-level filters to zero in on exactly the records you need without leaving the grid.

Drag and drop
Reorder columns, move fields, and organize your grid layout intuitively with simple drag-and-drop.

Global grids
Standardized, reusable grid templates that can be shared across teams and orgs for consistent Salesforce data views.

Custom grids
Personalized grids tailored to specific roles or workflows with custom columns, filters, and logic.

Sort columns
Sort by one or multiple columns to surface top priorities—ascending or descending—in just a click.
Column group
Visually group related columns under a single header to keep complex datasets easy to read and navigate.

Layout
Save and switch between different grid layouts—columns, sorting, grouping, filters—optimized for each workflow.

Freeze columns
Pin key columns (like Account or Opportunity) so they stay visible while you scroll horizontally through the grid.

Global search
Search across all visible columns and records in a grid to instantly find what you’re looking for.

Smart import
Import data with intelligent field mapping, validation, and error handling powered by live Salesforce metadata.

Manage access
Control who can view, edit, or configure grids at object, field, and layout level using role-based permissions.
Two ways to simplify complex quoting inSalesforce

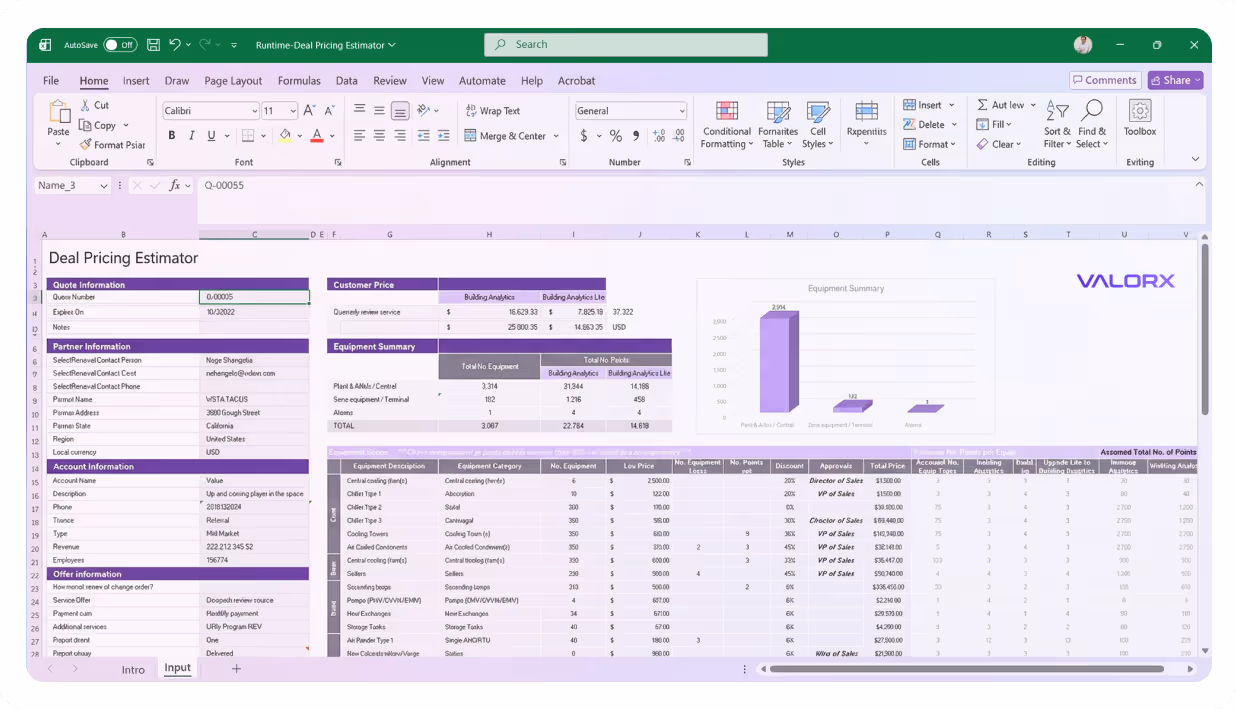

See what Valorx adds to Salesforce Manufacturing Cloud
Get more from your Manufacturing Cloud investment with solutions built specifically to fix forecasting limitations.
Without Valorx
Slow user adoption due to complexity
Fragmented data across multiple systems
Limited, rigid customization options
Revenue loss from inaccurate forecasting
With Valorx
Familiar interface for easy adoption
Centralized, real-time forecasting
Customizable forecasting capabilities
Higher accuracy, lower costs