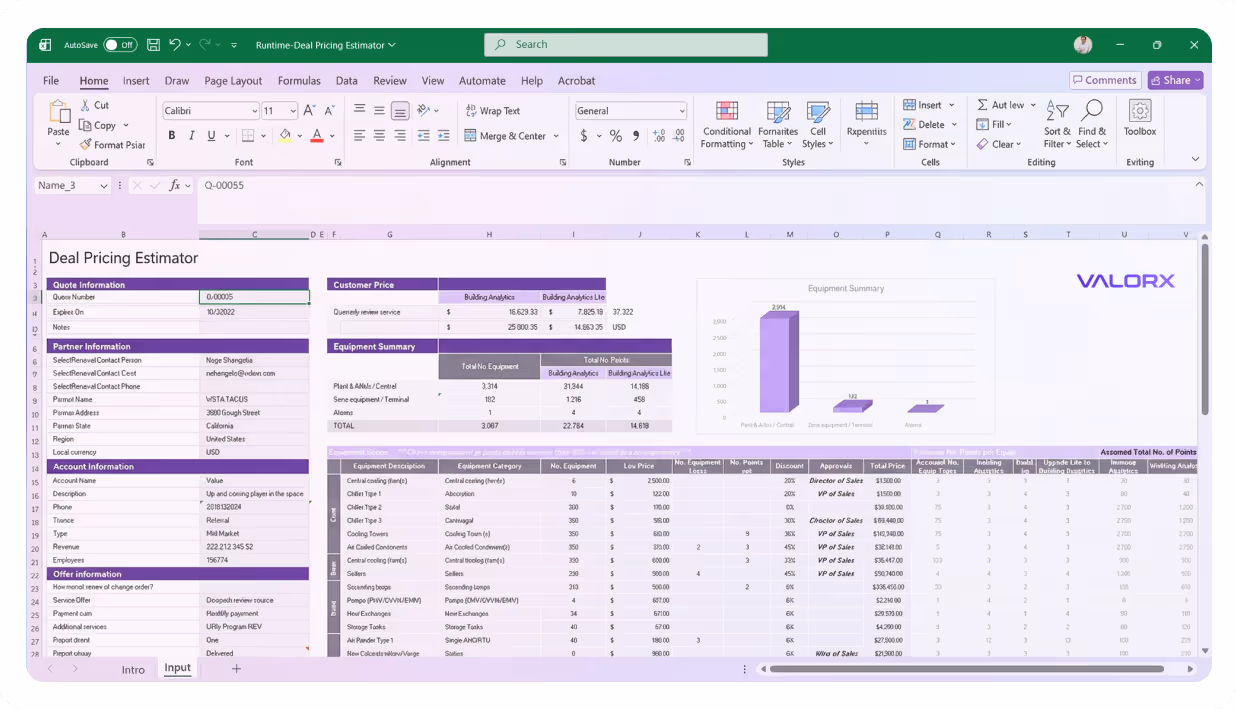
Financial analysis at Excel speed
Run forecasts, variance reports, and pipeline analysis directly from Salesforce—using the Excel interface your team already knows.
Enhancing Salesforce for industry leaders


See how fast Salesforce
can actually feel.
If you can do it in spreadsheet,
you can do it in Valorx.
you can do it in Valorx.
Book a demo
<00 days
to production
00x
faster forecasts in Salesforce
10,000+
SKUs updated in one operation

Built for every team that manages Salesforce
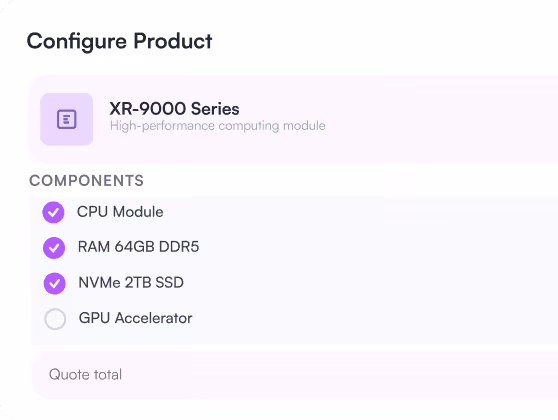
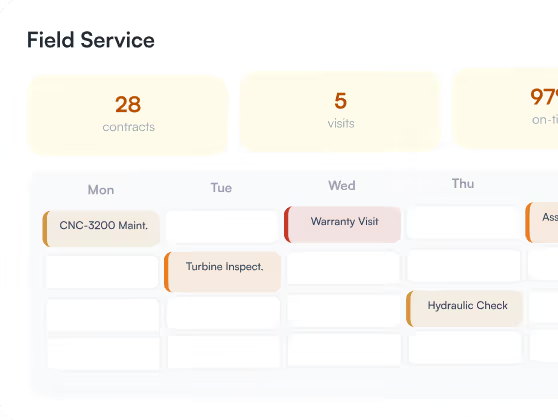
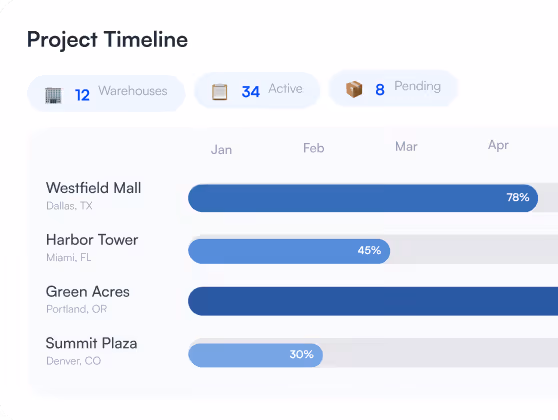
Valorx works across various verticals using Salesforce

CFO / VP Finance
Always-current visibility into financial performance. Board reporting, KPI dashboards, strategic planning.

Revenue Operations
Bridge finance and sales with unified data. Commission calculations, quota tracking, territory analysis.

FP&A Managers
Own forecasting and planning with real-time data access. Revenue forecasting, budget vs. actual, variance analysis.

Accounting
Streamline reconciliation and close processes. Revenue recognition, deferred revenue, audit support.
Work in Salesforce like you work in a spreadsheet.
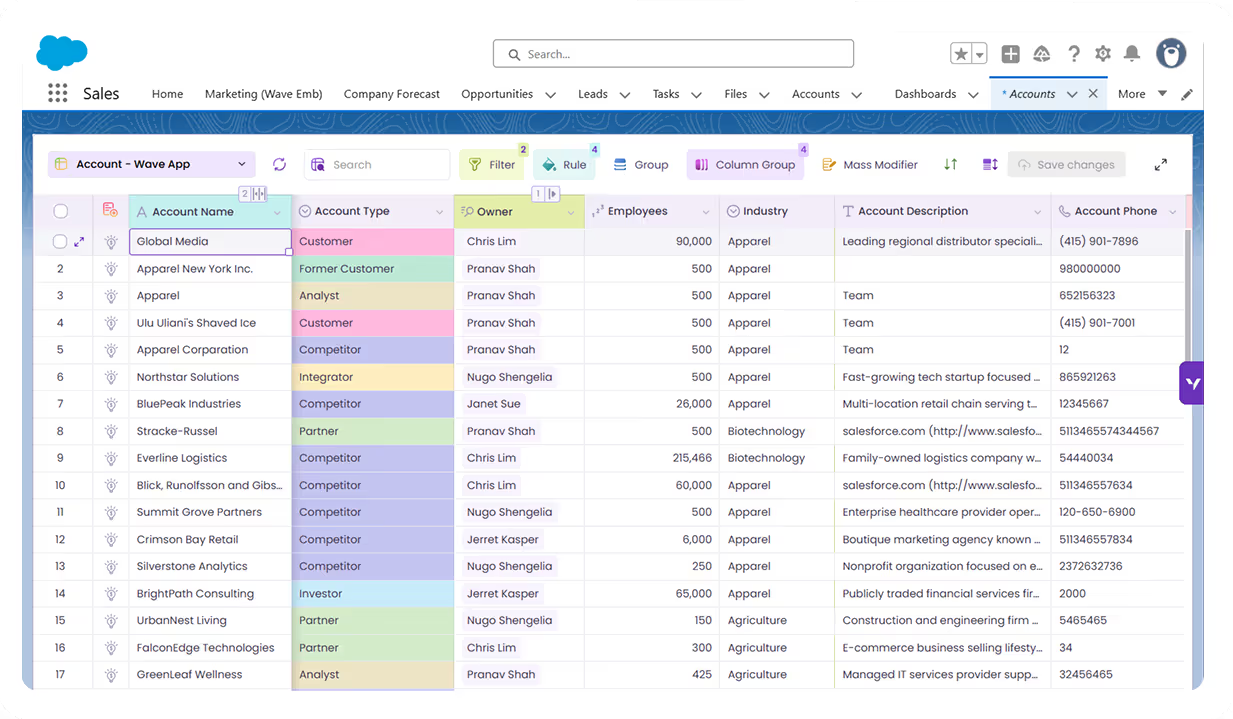
See what Valorx adds to Salesforce
Get more from your Salesforce investment with right tools.
Without Valorx
Pipeline data: request export, wait 1-2 days
Forecasts: built on stale snapshots
Board reports: data is 1-2 weeks old by meeting
Variance analysis: manual reconciliation for days
With Valorx
Pipeline data: refresh in Excel, see current numbers
Forecasts: built on live Salesforce data
Board reports: refresh minutes before presenting
Variance analysis: formulas calculate automatically


Frequently asked questions
Does Valorx work with Manufacturing Cloud?
Yes. Valorx works with all Manufacturing Cloud objects including Sales Agreements, Account
Forecasts, and Warranty Claims.
Can I use Valorx with Salesforce CPQ?
Yes. Bulk edit quote line items, update pricing across products, and compare quotes side-by-side.
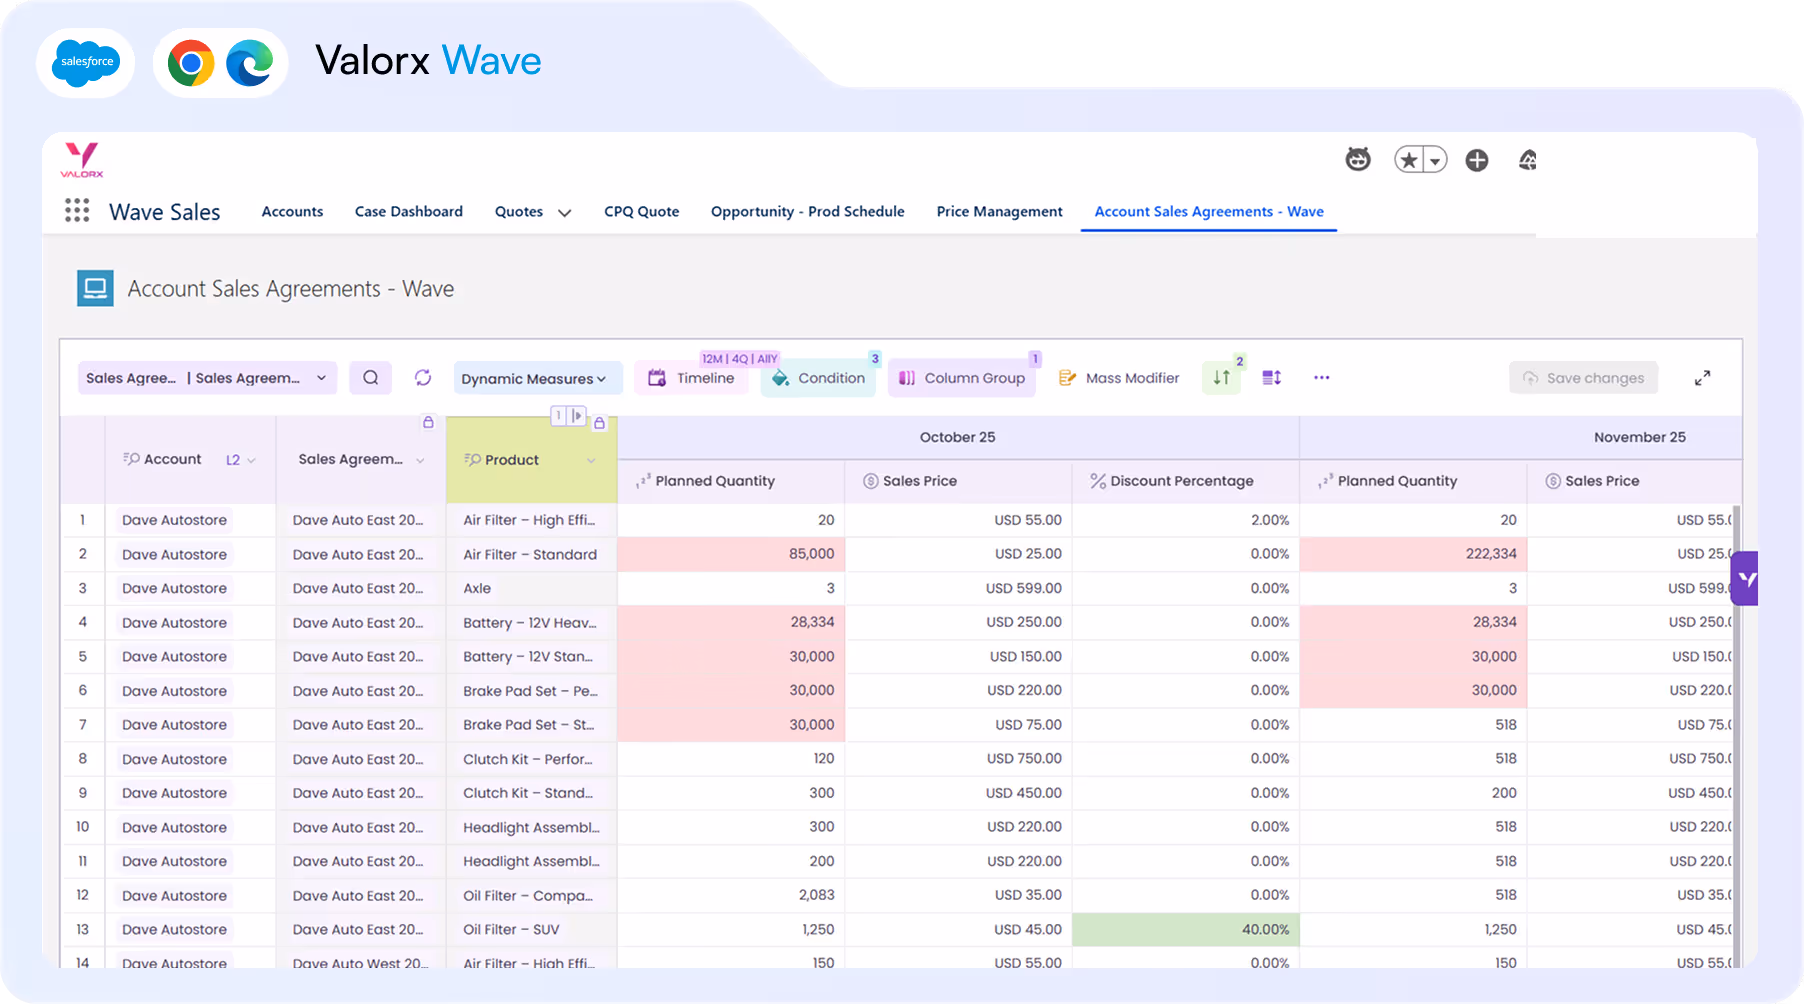
How does Wave help with forecasting?
Wave lets you edit Account Forecast records in bulk—update planned quantities across
accounts, products, and time periods in one grid. Conditional formatting highlights variances
between planned and actual.
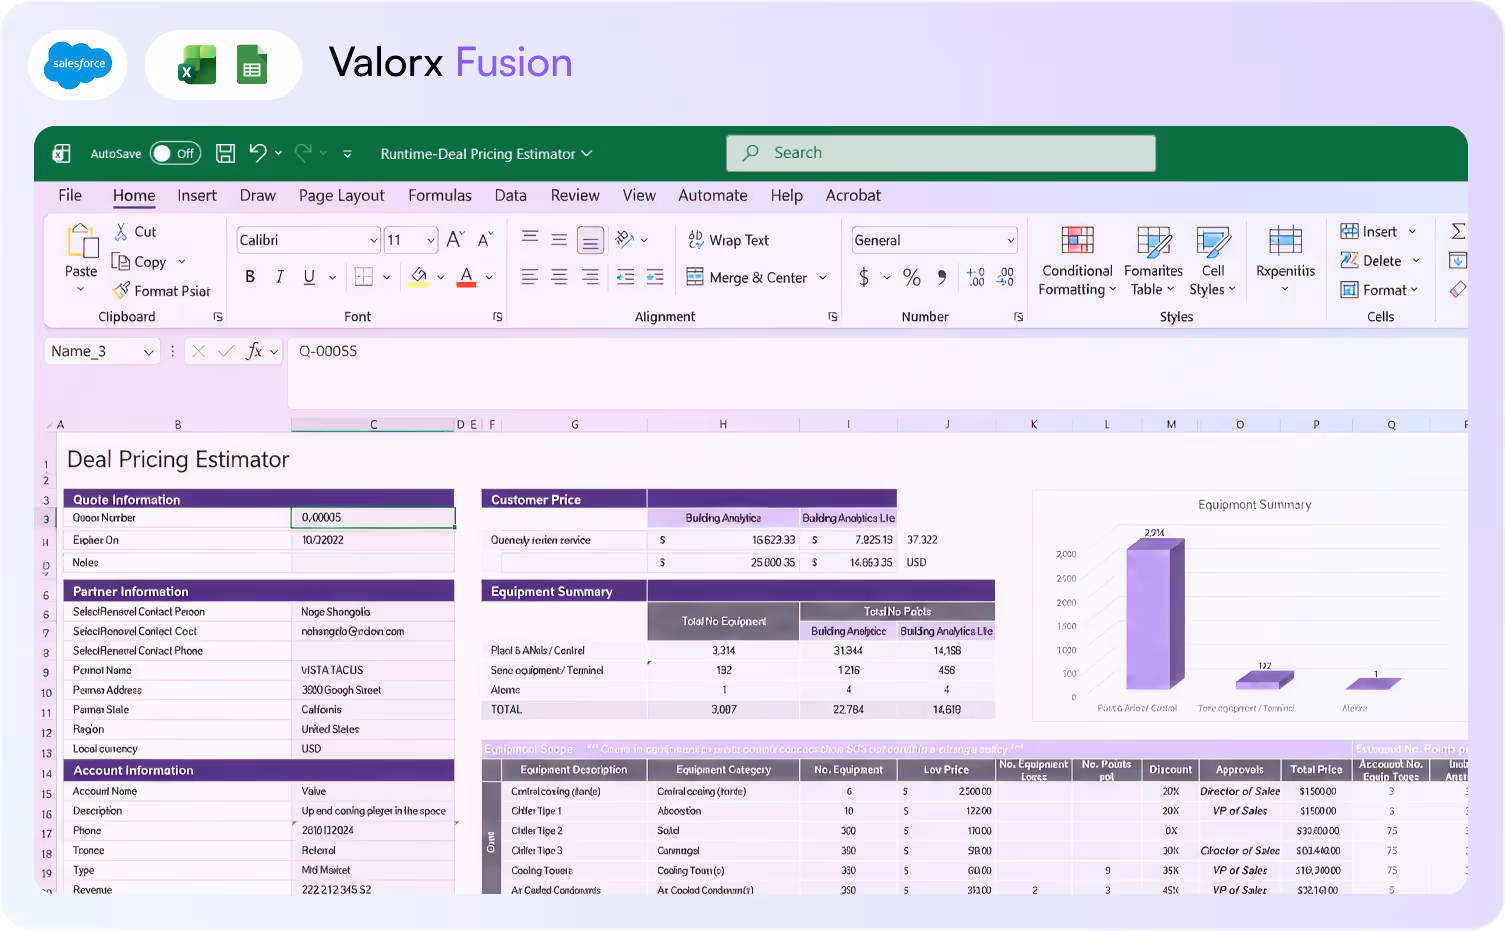
When should I use Fusion instead of Wave for forecasting?
Use Fusion when you need complex calculations, seasonal adjustments, or what-if scenarios
that require Excel's formula capabilities. Fusion syncs live with Salesforce, so your models
stay connected to Manufacturing Cloud data.
Does Valorx respect Salesforce security?
Yes. All permissions, sharing rules, and validation rules are enforced. Users only see and edit
data they have access to.
How fast can we deploy?
Wave deploys in minutes as a managed package. Fusion requires Excel add-in installation.
Most teams are live within 14 days.


Choose the workflow you need:
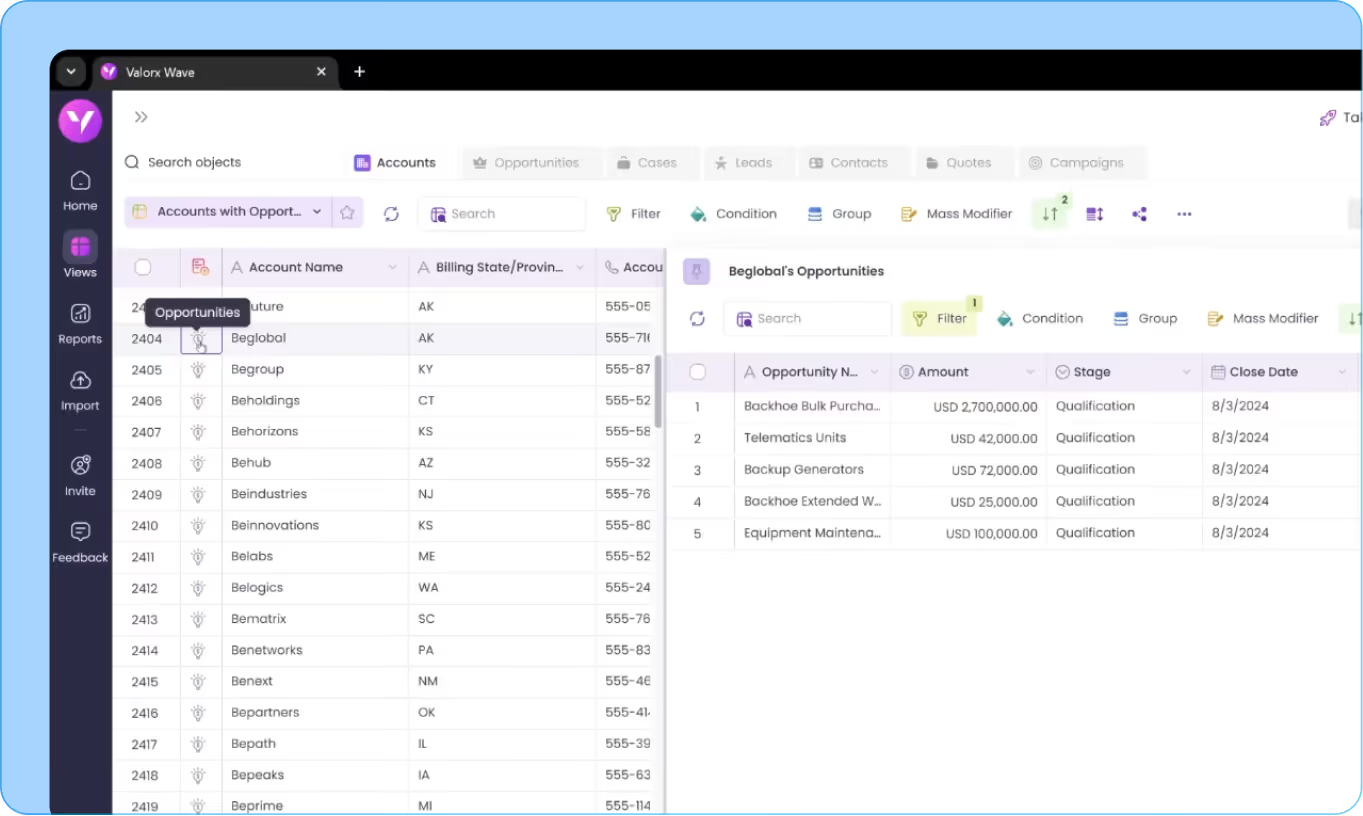
Try Wave in browser Extension
Connect Wave directly with your browser

Try Wave in Salesforce
Integrate Wave in Salesforce

Try Fusion In Excel
Easily use Fusion within Excel

Excel
Salesforce
Browser